Update : SBO topping?Update from 6 June posting as ZL1! unfold a higher probability of a downside bias for the short to medium term outlook.
A triangle wave b possibility will follow a wave c down.
Alternatively, it could also work as wave 1 followed with a triangle wave 2 and downward bias for wave 3 towards the forma
Peers for comparison
Contract highlights
U.S. Soybean Crush: Why Stocks Are Falling While Crush SlowsU.S. soybean oil stocks have fallen to a 12-year low, yet U.S. processors crushed fewer soybeans in September, not more. In a normal market, scarcity pulls supply forward.
This time it did not, because beans were stuck in wet fields and the policy that drives soybean oil demand is still being writ
SOYBEAN OIL - Due for Big MoveSoybean oil futures are gearing up for a significant move. Since June 2026, price has been developing what appears to be a bull flag, with touchpoints at both the top and bottom forming within a triangular structure.
I am no expert when it comes to the soybean market but there are a few meaningful
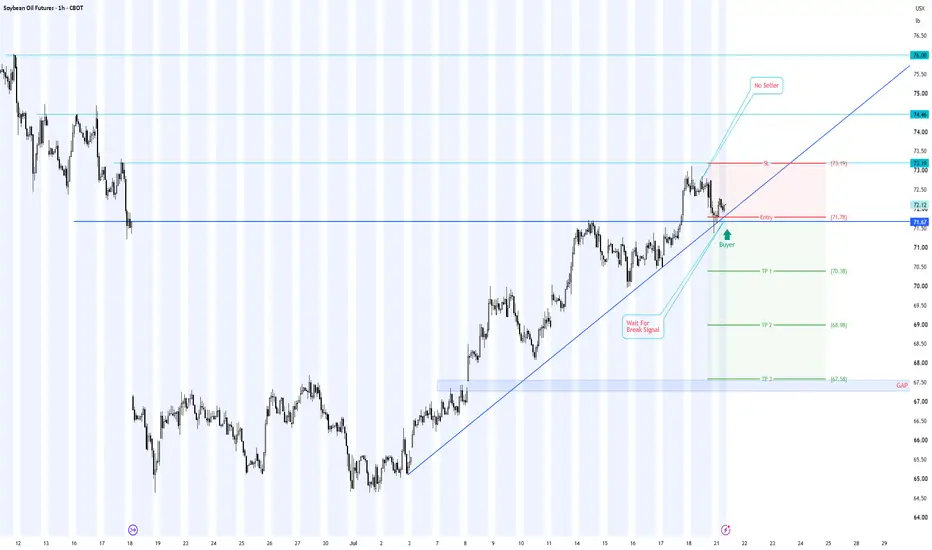
Soybean Oil (ZL1!) 1H: Trapping the Trendline Buyers
1. Buyer & Seller Psychology Analysis
• The Retail Buyer Trap: Retail buyers are aggressively buying the touch of the ascending trendline and horizontal support at 71.78 (marked "Buyer"), expecting the uptrend to resume toward 74.46. This buying behavior has clustered a massive pool of sell-stop l
ZL Long — $ZLN26 long setup on a pullback to the 75.15 breakout ZL has reclaimed the 75.00 area after a capitulation low at 72.86 and is building higher lows on the 1h chart. The cleanest setup is not chasing 75.50, but buying a pullback into the 75.10-75.20 breakout shelf if it holds; invalidation is back below 74.55, while the next meaningful upside level is t
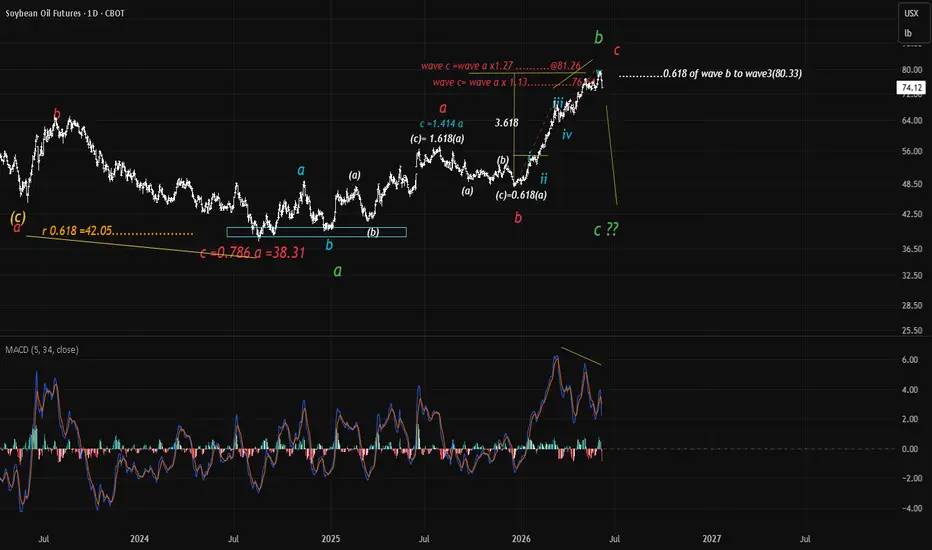
SBO : Topping possibilitySince August 2024 market moved 111.6% over 448 trading days culminated in wave b of a larger degree to be followed by a move down for wave c.
Compelling indications of a high probable turn is seen with pronounced divergence between price and MACD followed by wave c(red) into a zone where 1.13 and 1
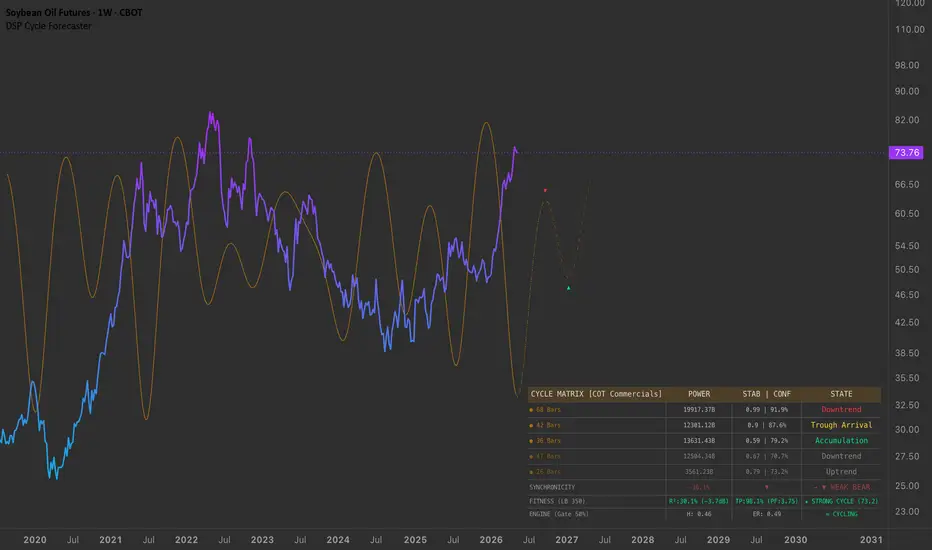
HOW-TO: Decoding Smart Money Cycles Using COT Data & DSPWhile most market participants apply Digital Signal Processing (DSP) strictly to price charts, advanced quantitative analysis allows us to extract cyclical rhythms from fundamental market internals. This publication serves as a technical guide on how to configure and interpret the DSP Cycle Forecast
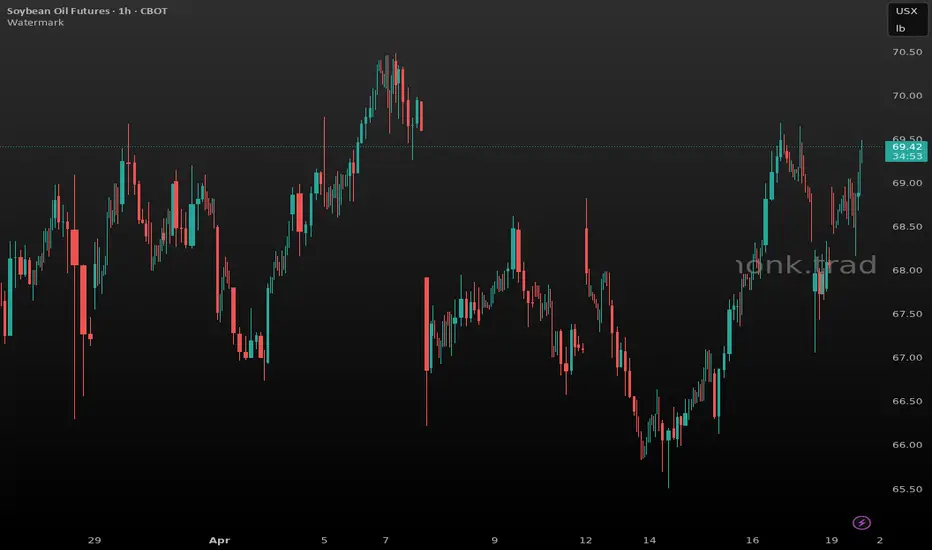
ZL Long — $BOK6 ZL pulling back to breakout support at 69.0 afteHTF 4h shows ZL in a clear uptrend from ~60 in late Feb to highs near 70.4, with each pullback finding buyers at higher lows. Price pulled back from the 70.4 HTF high to ~65.5 area Apr 13-14, then aggressively recovered — the April 16 session saw a strong breakout day with high volume (10k+ on the 0
SOYBEAN OIL MAINTAINS STRONG BULLISH MOMENTUM – HARMONIC PATTERNKEY TAKEAWAYS:
Price structure confirms a breakout from the long-term accumulation zone, transitioning into a strong growth phase.
A Harmonic pattern is forming with a Fibonacci extension convergence point at the 74.60 area.
Short-term profit-taking pressure is appearing at psychological resistan
See all ideas
A representation of what an asset is worth today and what the market thinks it will be worth in the future.
Displays a symbol's price movements over previous years to identify recurring trends.
Frequently asked questions
One way to gain exposure to ZLZ2024 is through a broker that offers futures. Before trading, make sure you understand how the product works and the risks involved.
You can trade ZLZ2024 directly from TradingView:
– Choose a broker: Explore our supported trading partners and pick one that fits your needs
– Compare options: View available brokers side by side to evaluate fees and features
– Connect your account: Open Supercharts, click "Trade", select your broker, and log in
– Start trading: Place orders directly from the chart
Tip: If you're new to trading, try paper trading first — it lets you practice strategies in real market conditions without risking funds.
You can trade ZLZ2024 directly from TradingView:
– Choose a broker: Explore our supported trading partners and pick one that fits your needs
– Compare options: View available brokers side by side to evaluate fees and features
– Connect your account: Open Supercharts, click "Trade", select your broker, and log in
– Start trading: Place orders directly from the chart
Tip: If you're new to trading, try paper trading first — it lets you practice strategies in real market conditions without risking funds.
The nearest expiration date for ZLZ2024 is Dec 13, 2024.
Futures contracts expire on predetermined dates. As expiration approaches, many traders roll positions into the next contract to maintain exposure to the market.
Key metrics to watch near expiration:
• Volume and liquidity: Trading activity often shifts to the next contract month
• Open interest: Falling open interest may signal positions being closed or rolled forward
• Forward curve: Differences between contract prices can help identify market structure, including contango and backwardation
Explore the ZLZ2024 chart to monitor active contracts and contract-month activity.
Futures contracts expire on predetermined dates. As expiration approaches, many traders roll positions into the next contract to maintain exposure to the market.
Key metrics to watch near expiration:
• Volume and liquidity: Trading activity often shifts to the next contract month
• Open interest: Falling open interest may signal positions being closed or rolled forward
• Forward curve: Differences between contract prices can help identify market structure, including contango and backwardation
Explore the ZLZ2024 chart to monitor active contracts and contract-month activity.