Soyabean oil bullishSeasonals: Bullish Cot commercial hedge: Bullish Techincals: Bullish There a 1:2 trade is highly likely as sharedi n the graphLongby Devilz_hunt1
SOYBEAN OIL - Due for Big MoveSoybean oil futures are gearing up for a significant move. Since June 2026, price has been developing what appears to be a bull flag, with touchpoints at both the top and bottom forming within a triangular structure. I am no expert when it comes to the soybean market but there are a few meaningful fundamental catalysts that could support a move toward the $80 level. The primary driver has been surging biodiesel demand. The EPA set the biomass-based diesel requirement under the Renewable Fuel Sby VIAQUANT3
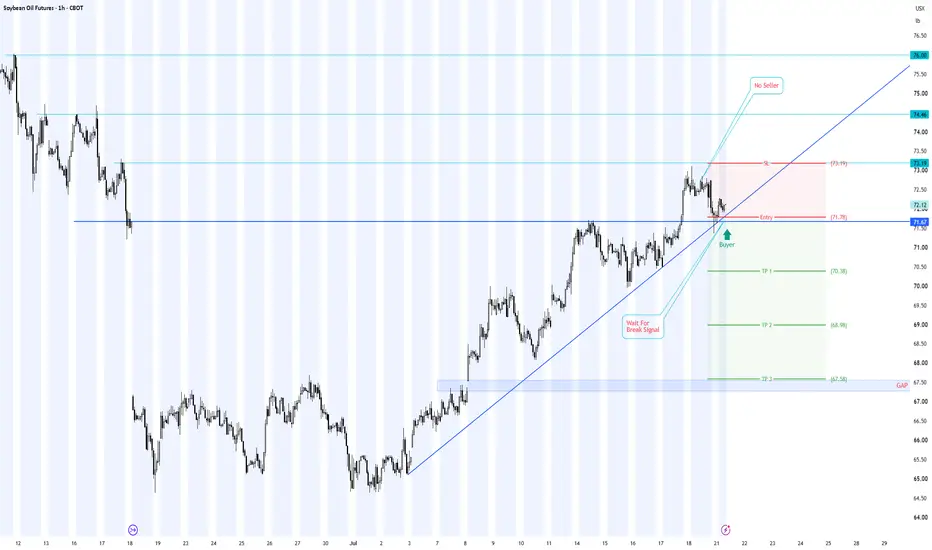
Soybean Oil (ZL1!) 1H: Trapping the Trendline Buyers 1. Buyer & Seller Psychology Analysis • The Retail Buyer Trap: Retail buyers are aggressively buying the touch of the ascending trendline and horizontal support at 71.78 (marked "Buyer"), expecting the uptrend to resume toward 74.46. This buying behavior has clustered a massive pool of sell-stop liquidity (stop losses) directly beneath 71.78. • The Trapped Buyers' Liquidation: As price hesitates at the high (marked "No Seller"), retail buyers are stuck holding positions at an unfavorable leveShortby gongroupvn0
ZL Long — $ZLN26 long setup on a pullback to the 75.15 breakout ZL has reclaimed the 75.00 area after a capitulation low at 72.86 and is building higher lows on the 1h chart. The cleanest setup is not chasing 75.50, but buying a pullback into the 75.10-75.20 breakout shelf if it holds; invalidation is back below 74.55, while the next meaningful upside level is the 76.70 area from the 4h swing high. Reward/risk is acceptable at roughly 2.6:1, though confidence is capped by low RVOL and price still trading below the broader 4h EMA200. 📍 Entry: 75.15 🛑 Stop: 7Longby mnktrd0
SBO : Topping possibilitySince August 2024 market moved 111.6% over 448 trading days culminated in wave b of a larger degree to be followed by a move down for wave c. Compelling indications of a high probable turn is seen with pronounced divergence between price and MACD followed by wave c(red) into a zone where 1.13 and 1.27 of wave a displayed loss of momentum and a 5-wave structure to complete wave c. The wave relationship between wave v(0.618) to wave iii also fell in the resistive zone. a 3.618 ratio from the tby micchua1
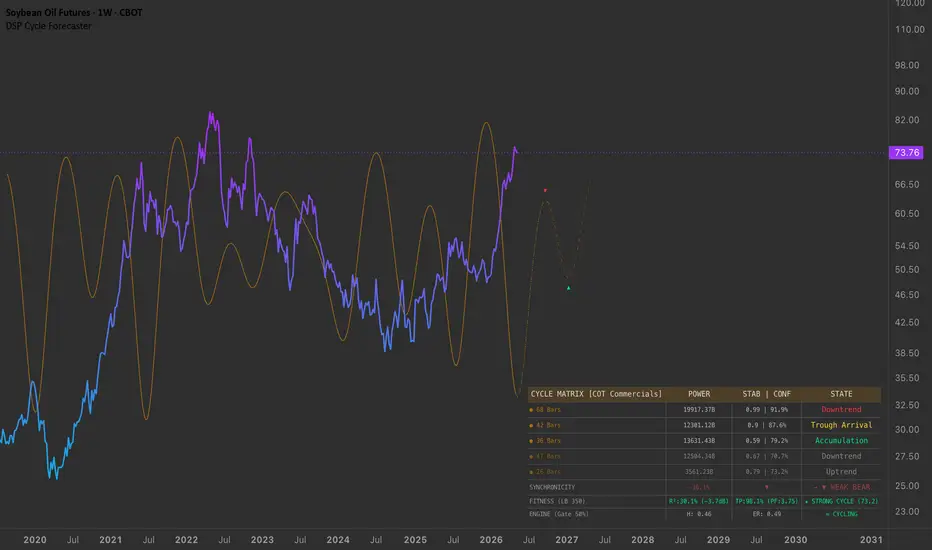
HOW-TO: Decoding Smart Money Cycles Using COT Data & DSPWhile most market participants apply Digital Signal Processing (DSP) strictly to price charts, advanced quantitative analysis allows us to extract cyclical rhythms from fundamental market internals. This publication serves as a technical guide on how to configure and interpret the DSP Cycle Forecaster when tracking institutional flows via the CFTC Commitments of Traders (COT) net positioning. 1. Bypassing Price Noise: Analyzing the "Smart Money" In heavily commercialized commodity markets liEducationby fdx10121
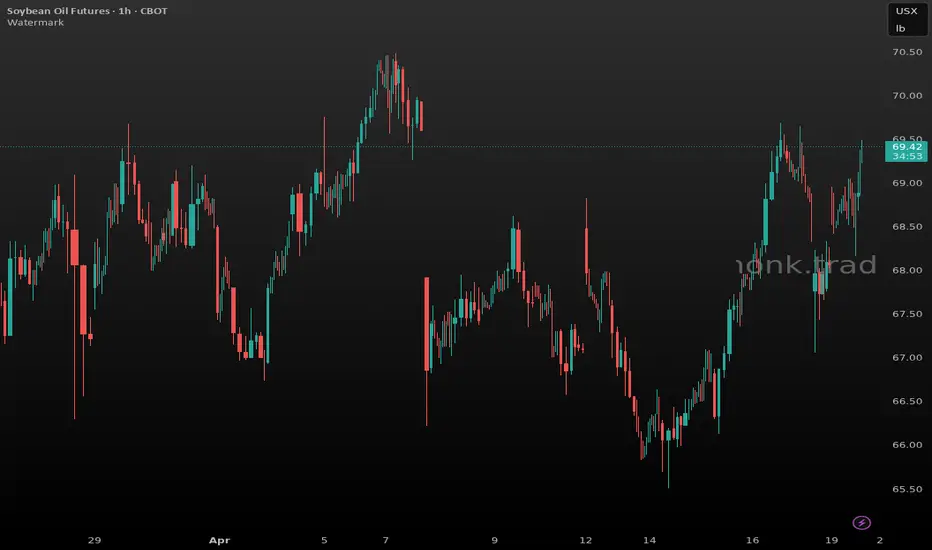
ZL Long — $BOK6 ZL pulling back to breakout support at 69.0 afteHTF 4h shows ZL in a clear uptrend from ~60 in late Feb to highs near 70.4, with each pullback finding buyers at higher lows. Price pulled back from the 70.4 HTF high to ~65.5 area Apr 13-14, then aggressively recovered — the April 16 session saw a strong breakout day with high volume (10k+ on the 08:00 bar) pushing from 68 to 69.5. Current LTF action on Apr 17 shows a healthy pullback from the 69.5 high back toward 68.0-68.1, followed by a weekend gap-up open Apr 20 at 68.86 and steady grind hiLongby mnktrd0
SOYBEAN OIL MAINTAINS STRONG BULLISH MOMENTUM – HARMONIC PATTERNKEY TAKEAWAYS: Price structure confirms a breakout from the long-term accumulation zone, transitioning into a strong growth phase. A Harmonic pattern is forming with a Fibonacci extension convergence point at the 74.60 area. Short-term profit-taking pressure is appearing at psychological resistance levels but has not altered the primary trend. Date: March 26, 2026 | Timeframe: Daily (1D) | Contract Code: ZL1! (Soybean Oil) 1. Trend and Price Structure Overview On the Daily chart, Soybean OiLongby Hung-JK2
SBO Update from 19 Feb 2026Market appears volatile and impulsive in the light of the political situation in the Middle East. Technically wave (c) of a larger degree wave b is unfolding with resistive objective suggested at areas 71.42-72.59 / 76.64 /93.23-93.98. Current bar displayed imminent correction possibility towards 62.53-62.69 / 60.62 and likely a wave 4 congestion before attempting higher levels mentioned above.by micchua1
Soybean Oil Has Moved As Much Since the Beginning of 2026My Long-Term Trajectory for Commodities. It all started years ago when I began investing in gold. Back then, I believed that global money printing was unsustainable and that precious metals were effective inflation-hedge assets. Inflation, in my view, would inevitably escalate over time. Then came 2022, when US CPI hit a high of 9%. That was when gold began drawing stronger attention from central banks and investors. Another belief of mine is that gold is the leader of commodities. As long asLongby konhow10
Oil Is Moving Higher, But It’s Not CrudeWhile many focus on crude oil due to tensions in the Middle East, I’ve noticed that among the few popular oil markets, soybean oil is moving much higher than the others. Could soybean oil be the next to move after precious metals? Soybean Oil Ticker: ZL Minimum fluctuation: 1/100 of one cent (0.0001) per pound = $6.00 Disclaimer: • What presented here is not a recommendation, please consult your licensed broker. • Our mission is to create lateral thinking skills for eLong07:43by konhow14
SBO -Upside push for nowFollowing up on 8 December' 2024 outlook., price movement suggests a potential wave b to the upside. The retracement at wave a(green) presented a confluence of 0.618 retracement and a measured move between wave c to wave a saw support between 42.05-38.31 which pivoted prices towards an upside bias. The current price rise is suggesting the completion of wave c's culmination into a larger cycle wave b. On measured move, the red bars are the potential technical targets worth noting. Rising momentumby micchua20
SBO Bottoming OutlookAfter the bottoming of 37.66 in August 2024 the market went sluggish, but it maintained a bullish swing where rising bottoms were exhibited. A rounded bottoming pattern presented itself with a divergence showing towards the current recent low 48.27 and MACD is moving into positive territory suggest upside potential. Leaning on the wave principle, wave c is likely in the making toward the prior wave b (yellow) as an objective. Support from the rounded bottom formation together with the wave countby micchua10
Technical analysis across soybeans mix (ZL, ZS & ZM) and HOTechnical analysis across soybeans (ZS), soymeal (ZM), soybean oil (ZL), and NY Harbor ULSD (HO) points to an imminent shift in trend for soybean oil, with strong prospects for a reversal and medium-term recovery. Soybean Oil (ZL) – Daily Chart Focus Support Zone & Anchored VWAP: ZL has reached the “golden pocket” reversal area between 50% and 61.8% Fibonacci retracement (48.48–46.63), confirming major technical support. Current price action is also interacting with an anchored VWAP—suggestiby Southwind-CT0
Analysis techniques – Soybean Oil Futures (Dec 2025)Analysis techniques – Soybean Oil Futures (Dec 2025) Date: 03/10/2025 | Timeframe: D1 | Contract Code: ZLZ25 1. Trend Overview and Price Structure Soybean oil (Dec 2025) closed at 50.41 cents/pound (+0.16%), consolidating within a tight range of 49.5 – 50.5. After a prolonged decline since July, the market is forming a temporary base but remains under bearish pressure. Current structure suggests indecision, awaiting a breakout from the consolidation box. 2. Key Technical Levels Resistance: 50.Shortby Hung-JK0
Soybean Oil Weekly Roundup - September 12, 2025🌱 Soybean Oil Weekly Roundup by Southwind 🌱 🗓️ Week ending: September 12, 2025 📊 Price & Chart Daily: Soft close with momentum lagging as price hovers below key moving averages on the rebound, keeping near-term tone steady but unconfirmed for trend expansion. Weekly: A strong rounded-bottom base has been forming since 2024; if confirmed above the neckline, historical pattern behavior supports further upside follow-through. 🟢 Key Technicals Support: 51.13–49.79 (retracement zone and high-volumby Southwind-CT1
Soybean Oil Futures Face Breakdown Risk Below $50 Current candle is a bearish red candle breaking below the lower Bollinger Band → suggests weakness and possible continuation. The 20-day moving average (middle Bollinger Band) is sloping downward. Price is trading below the 20-day MA → bearish short-term momentum. Price is riding the lower band → typical bearish trend behavior. If price breaks below 50.00 with volume, expect acceleration toward 48.50 – 47.00. Shortby SahrinUpdated 0
Soybean Oil Weekly Roundup - Week ending: Aug 29, 2025🌱 Soybean Oil Weekly Roundup by Southwind 🌱 🗓️ Week ending: Aug 29, 2025 📊 Price & Chart - Daily: Soft close, momentum weak, price under key moving averages. - Weekly: Strong **rounded bottom** base building since 2024. Soybean’s bullish setup may help push soy oil higher. 🟢 Key Technicals - Support: 51.13–49.79 (retracement zone, high volume area). - Resistance: 57.17 level (major weekly barrier). Breakout above confirms uptrend. - RSI: Neutral, still not overbought. 🌾 Soybean Factor - SoLongby Southwind-CT0
high RR opportunity as sellers return to support in uptrend 1->4 : creates higher highs and lows, making numebr 1 a major market low when number 2 surpassed the previous pivot before this count, and number 3 a solid market low when number 4 surpassed number 2 4->5 : we return to solid major buyers in number 3 , I decided to make the pivot here becase this is the horizontal intersection of all 3 candles making this pivot without violating any of the candle bodies what do I think will happen ? * with a fractal higher high in the candles it shows a goLongby jacesabr_real0
ZL ON LAST POINT OF SUPPORTExpected to enter C phase and rebound to top TR for JAC before continuing markup.Longby Wyckoffian44210
Why Soybean Oil Outperforms Crude Oil?From their recent lows, soybean oil has quietly crept up by 50%, while crude oil has risen by 40%. The reason goes beyond the recent renewal of tensions in the Middle East — it runs deeper than that. Mirco SoybeanOil Futures Ticker: MZL Minimum fluctuation: 0.02 per pound = $1.20 Disclaimer: • What presented here is not a recommendation, please consult your licensed broker. • Our mission is to create lateral thinking skills for every investor and trader, knowing when toLong08:51by konhow8
Why the Sudden Surge in Soybean Oil Prices?Recent sharp increases in Chicago soybean oil prices reflect a confluence of dynamic global and domestic factors. Geopolitical tensions, particularly those impacting crude oil markets, have played a significant role, as evidenced by the recent surge in Brent crude futures following events in the Middle East. This volatility in the broader energy complex directly influences the cost and strategic value of alternative fuels, positioning soybean oil at the forefront of this market shift. A primaryLongby UDIS_View7

 Long
Long