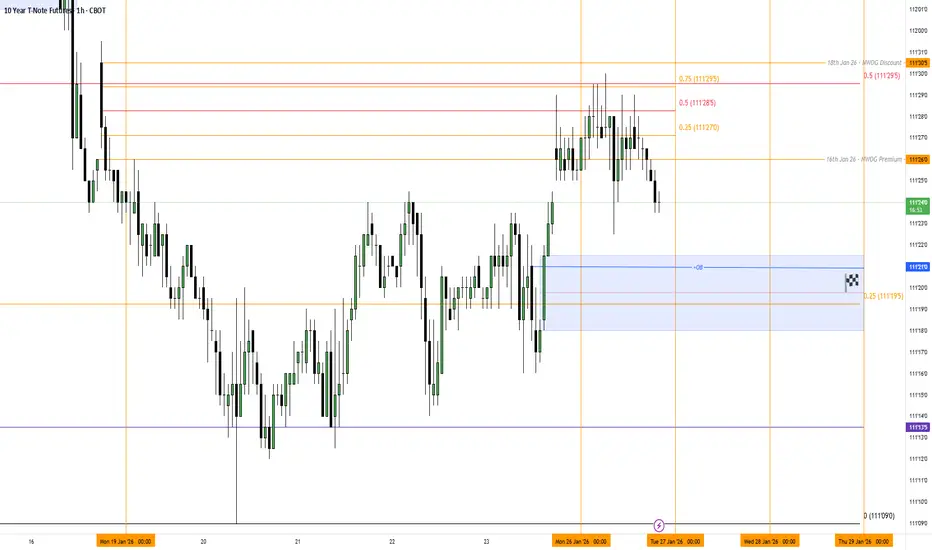
Back to the Basics - Market Structure & Risk ManagementThis is perhaps the most basic structure that the trading community in general considers tradable. It is not the only one that exists, but it certainly repeats quite often and is extremely profitable.
There are two points that need to be understood for effective trading: market structure and risk m
10-Year T-Note Futures (Mar 2027)
No trades
No trades
Compare with 10-Year T-Note Futures (Mar 2027)
ZN 109 Hold: Temporary Relief or Structural Shift? A Market Caught Between Oil Shocks, Fiscal Anxiety, and a Reluctant Fed
The macro backdrop for ZN futures has been anything but quiet over the past month. The US-Iran conflict, which broke out in late February 2026, has been the dominant driver reshaping rate expectations across the board. The dis
A Skeptical Trader's Guide to Trading Repeated Failed BreakoutsTechnical patterns often look straightforward in textbooks. A recognizable formation develops, price eventually breaks through a key level, and traders begin evaluating potential opportunities. In reality, however, markets are rarely that cooperative.
One of the more challenging situations traders
ZN Short — $ZNM26 breaking down through 110.10 support on risingSetup: On the 4h chart ZN has been in a sustained downtrend since the mid-April high near 111.75, making a series of lower highs and lower lows. The most recent bounce off the ~110.10 low stalled at 110.28-110.33 resistance — the prior intraday base from early May — and price is now rolling back ove
ZN Short — $ZNM26 breaking down through 111.30 support with rateSetup: On the 4h, ZN has been rangebound between roughly 110.75 and 112.00 since late March, but the current price action sits in the lower half of that range after failing to hold the Apr 17 spike high near 111.80. The 1h shows a clean staircase breakdown from 111.65 to current levels — lower highs
Technical Shift in 10-Year Treasuries
The recent price action in 10-Year T-Note futures is signaling a potential regime shift. After a prolonged period of consolidation, we are seeing a significant confluence of bearish indicators:
Structural Breakdown: The rejection at the 114'000 resistance level has formed a textbook distribution to
ZN 2026 Yearly outlook
- Where is price?
Price is in area 3, below the static yearly PLdot but above the live yearly PLdot (next year). Direction is down, slope is down but decreasing. Yearly down c-wave aborted, down flow is stopped. Next candle will open above the next years static PLdot.
- What is it doing?
A
10-Year Treasuries Into FOMC: What to Expect1. Big Picture: What’s Been Driving Bonds?
Over the past several months, the U.S. Treasury market has been defined by diverging forces across the curve, the short end (2Y, 5Y) pricing near-term monetary policy outcomes and the long end (10Y, 30Y) reflecting inflation persistence, fiscal supply, an
(ZN1!): The Wedge of Decision. Rate Cut Confirmation Imminent ?The Core Thesis: The 10-Year T-Note futures price has been locked in a massive, multi-year symmetrical triangle or falling wedge pattern. A decisive breakout from this formation will not only determine the next phase of the bond market but will also confirm the direction of the 10-Year Yield, which
See all ideas
Summarizing what the indicators are suggesting.
Neutral
SellBuy
Strong sellStrong buy
Strong sellSellNeutralBuyStrong buy
Neutral
SellBuy
Strong sellStrong buy
Strong sellSellNeutralBuyStrong buy
Neutral
SellBuy
Strong sellStrong buy
Strong sellSellNeutralBuyStrong buy
A representation of what an asset is worth today and what the market thinks it will be worth in the future.
Frequently asked questions
The current price of 10-Year T-Note Futures (Mar 2027) is 107'20'0 USD — it has fallen −0.52% in the past 24 hours. Watch 10-Year T-Note Futures (Mar 2027) price in more detail on the chart.
The volume of 10-Year T-Note Futures (Mar 2027) is 17.00. Track more important stats on the 10-Year T-Note Futures (Mar 2027) chart.
The nearest expiration date for 10-Year T-Note Futures (Mar 2027) is Mar 19, 2027.
Traders prefer to sell futures contracts when they've already made money on the investment, but still have plenty of time left before the expiration date. Thus, many consider it a good option to sell 10-Year T-Note Futures (Mar 2027) before Mar 19, 2027.
Open interest is the number of contracts held by traders in active positions — they're not closed or expired. For 10-Year T-Note Futures (Mar 2027) this number is 61.00. You can use it to track a prevailing market trend and adjust your own strategy: declining open interest for 10-Year T-Note Futures (Mar 2027) shows that traders are closing their positions, which means a weakening trend.
Buying or selling futures contracts depends on many factors: season, underlying commodity, your own trading strategy. So mostly it's up to you, but if you look for some certain calculations to take into account, you can study technical analysis for 10-Year T-Note Futures (Mar 2027). Today its technical rating is strong sell, but remember that market conditions change all the time, so it's always crucial to do your own research. See more of 10-Year T-Note Futures (Mar 2027) technicals for a more comprehensive analysis.