Soybeans: three weeks of topping, short below 1300Soybeans rallied from the 1165 August low to 1335'2 in mid September, about 15% in five weeks. Then the market stalled. For three weeks it went sideways between roughly 1295 and 1335, with three failed pushes at the highs. Today's wide range down bar broke through the floor of that box, and the dail
Peers for comparison
Contract highlights
When a Record Crop Isn't Bearish
Every month, the USDA's World Agricultural Supply and Demand Estimates report does one thing: balance a ledger. On one side sits total supply (what was left over from last year, what this year's harvest produced, and what was imported). On the other side sits total use (what processors crushed, wh
ZS1! (Soybean Futures) – Daily – 9/17/26ZS1! (Soybean Futures) – Daily – 9/17/26
Setup: Short entered @ 1319, SL @ 1364 (risk ~45c)
Thesis: Momentum fade within an otherwise intact uptrend —
this is a counter-trend/exhaustion trade.
Bullish structure still intact (the risk to this short):
- Ascending channel since ~Apr/May '26, price
ZS1!China is expected to purchase 12 million metric tons of soybeans from the United States, following the meeting in South Korea that took place several months ago. After Trump’s statements, the markets surged sharply, but I believe China has not made—and will not make—any public statements on the matt
Soybeans — Producer hedging caps this. What if it doesn't?Producer hedges in soybeans are sitting above 600K contracts right now. That level usually tracks price down.
But if it doesn't this time — price just keeps grinding to fresh highs anyway.
Back in 2020 something similar happened. Hedging was heavy, and price broke higher regardless. What was actua
Will Super El Niño Reshape Soybean Futures?Global weather concerns and insatiable Chinese demand rapidly spike corn, wheat, and soybean prices. Meteorologists from DW News confirm that a historically strong El Niño pattern will disrupt global agriculture. The United Nations warns that climate change exacerbates these erratic weather events.
SOYBEANS Short SignalSoybeans MTF Conf2.0 Short Idea. I don't trade soybeans, so I will not be trading this, but I thought I would share the TDA
Technicals:
Price inside Monthly supply + Daly confirmation 2.0.
Fundamentals/Sentiment:
COT short correlation by banks/insitutions adding into shorts and closing longs.
No i
SOYBEAN FUTURES DXY & REAL YIELD IMPLICATIONS
DXY 100.90, real yield 2.255% — both still restrictive for the broader commodity complex (BCOM 125.72). Hawkish Warsh Fed is a structural headwind, but soybean's demand-side story (crush/biodiesel) is currently strong enough to decouple from the DXY-driven bearish macro
SOYBEAN Futures ...Up dateCommercials became materially more bullish.
Funds became materially more bearish.
Price stopped falling.
That divergence is often seen near important turning points.
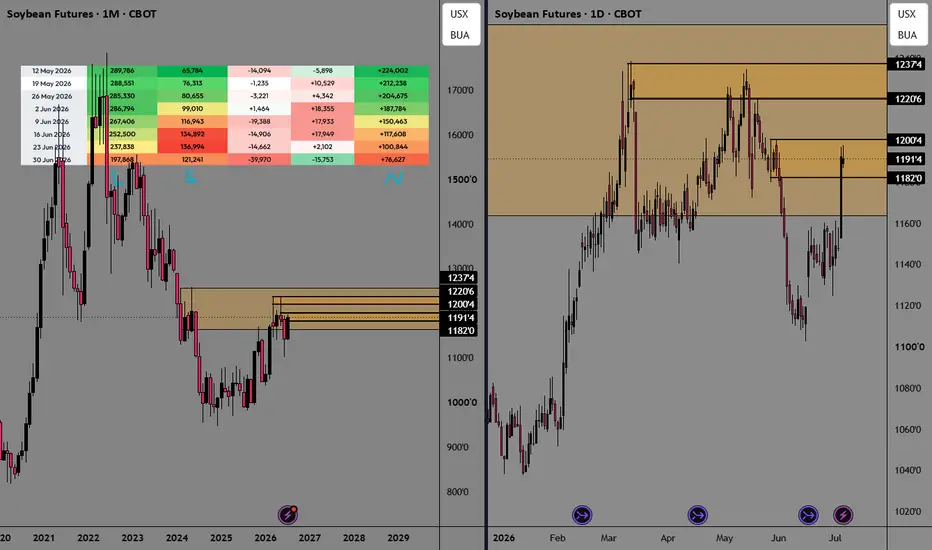
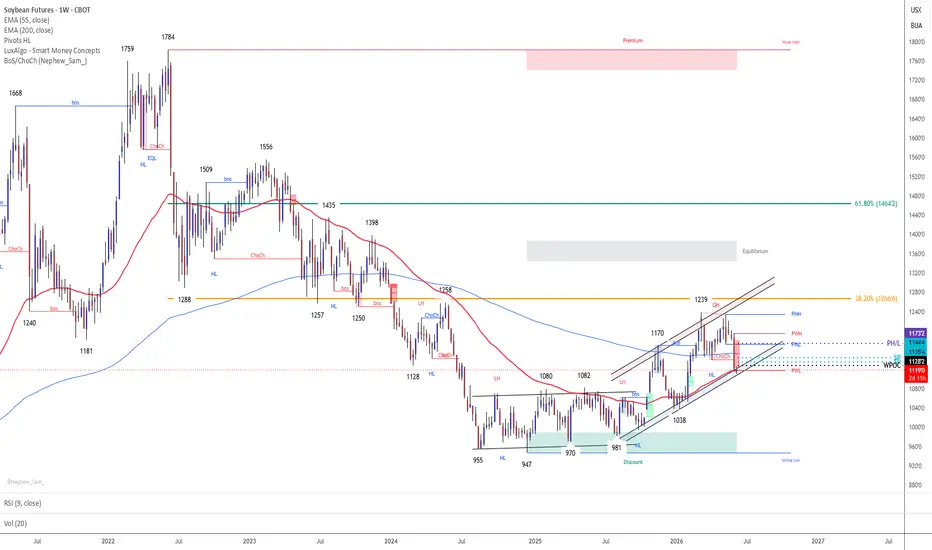
The 1102–1117 zone now looks increasingly like a potential Wyckoff Spring/Test area, while 1170 remains the key BOS level. A daily a
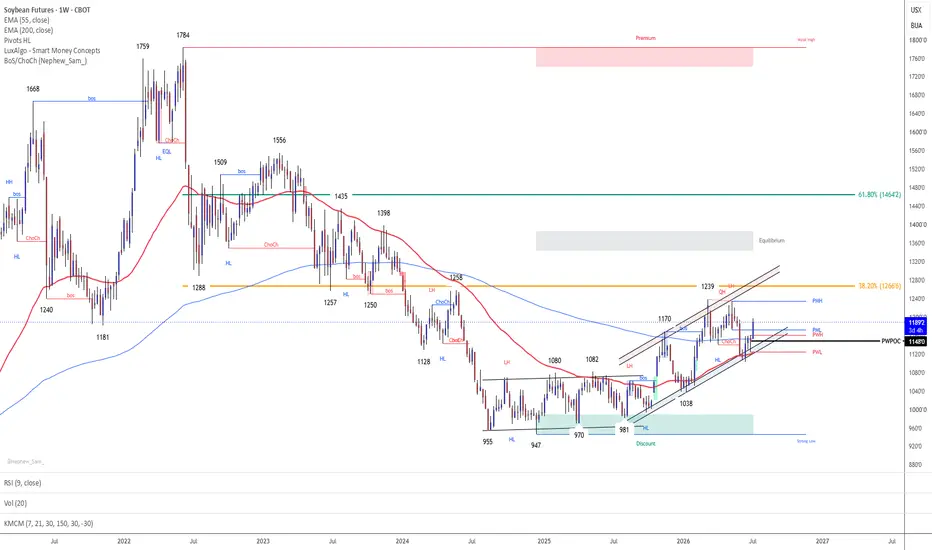
SOYBEAN FUTURES ....SOYBEAN FUTURES –
Price: 1117.0
Weekly 55 EMA: 1116.0
Weekly 200 EMA: 1152.0
DXY: 99.87
US 10Y Real Yield: 2.198%
Bloomberg Commodity Index: 130.48
The macro environment has become significantly less supportive for grains than a month ago:
Headwinds
DXY approaching 100.00
Real Yield back near 2.20%
See all ideas
A representation of what an asset is worth today and what the market thinks it will be worth in the future.
Displays a symbol's price movements over previous years to identify recurring trends.
Frequently asked questions
One way to gain exposure to ZSU2020 is through a broker that offers futures. Before trading, make sure you understand how the product works and the risks involved.
You can trade ZSU2020 directly from TradingView:
– Choose a broker: Explore our supported trading partners and pick one that fits your needs
– Compare options: View available brokers side by side to evaluate fees and features
– Connect your account: Open Supercharts, click "Trade", select your broker, and log in
– Start trading: Place orders directly from the chart
Tip: If you're new to trading, try paper trading first — it lets you practice strategies in real market conditions without risking funds.
You can trade ZSU2020 directly from TradingView:
– Choose a broker: Explore our supported trading partners and pick one that fits your needs
– Compare options: View available brokers side by side to evaluate fees and features
– Connect your account: Open Supercharts, click "Trade", select your broker, and log in
– Start trading: Place orders directly from the chart
Tip: If you're new to trading, try paper trading first — it lets you practice strategies in real market conditions without risking funds.
The nearest expiration date for ZSU2020 is Sep 14, 2020.
Futures contracts expire on predetermined dates. As expiration approaches, many traders roll positions into the next contract to maintain exposure to the market.
Key metrics to watch near expiration:
• Volume and liquidity: Trading activity often shifts to the next contract month
• Open interest: Falling open interest may signal positions being closed or rolled forward
• Forward curve: Differences between contract prices can help identify market structure, including contango and backwardation
Explore the ZSU2020 chart to monitor active contracts and contract-month activity.
Futures contracts expire on predetermined dates. As expiration approaches, many traders roll positions into the next contract to maintain exposure to the market.
Key metrics to watch near expiration:
• Volume and liquidity: Trading activity often shifts to the next contract month
• Open interest: Falling open interest may signal positions being closed or rolled forward
• Forward curve: Differences between contract prices can help identify market structure, including contango and backwardation
Explore the ZSU2020 chart to monitor active contracts and contract-month activity.