ZS1! (Soybean Futures) – Daily – 9/17/26ZS1! (Soybean Futures) – Daily – 9/17/26
Setup: Short entered @ 1319, SL @ 1364 (risk ~45c)
Thesis: Momentum fade within an otherwise intact uptrend —
this is a counter-trend/exhaustion trade.
Bullish structure still intact (the risk to this short):
- Ascending channel since ~Apr/May '26, price stalled near
upper 1/8 of channel (~13.20-13.31 high)
- ADX 37.3 with +DI 26.9 > -DI 10.1 → primary trend is still
strong and bullish by this measure — this is the main thing
that could stop the short out
Bearish momentum signals supporting the short:
- MFI bearish divergence — price made a higher high into
Sept, MFI made a lower high
- Vol(20) 133.76K running below its own avg 146.9K → the
recent push to highs came on weak participation
- MACD crossed below signal line, histogram flipped negative
- CC(SPX,20) = -0.18 — soy is not being driven by equity
correlation right now, this is an independent ag-fundamentals
move (tariff/China demand driven)
Key level: 1290-1300 support/resistance zone. A clean
break below turns this from "overbought pullback" into
confirmation of trend change; a hold/bounce there keeps this
inside the channel as a shallow correction only.
Plan: SL 1364 caps risk if the bullish trend reasserts and
breaks the recent high. Watching 1290-1300 as the first
real test of the bearish thesis.
Not financial advice — my own trade journal notes.
In-depth trading ideas
ZS1!China is expected to purchase 12 million metric tons of soybeans from the United States, following the meeting in South Korea that took place several months ago. After Trump’s statements, the markets surged sharply, but I believe China has not made—and will not make—any public statements on the matter, as that would drive prices higher, which is counterproductive if they intend to carry out a massive purchase.
I’ve noticed that the main dairy monopolies in China are showing chart formations that point to a very probable price increase in the coming months (Mengniu +40%, Yili +20%). This could be aligned with likely large-scale commodity purchases planned by the Chinese government.
I think it is in China’s interest to buy soybeans from the U.S. because Brazil practically has no soybeans available until the new harvest (May–June 2025), China needs to cover record crushing volumes and rebuild stocks ahead of Chinese New Year (January 29, 2026), and it may also want to send a positive political signal to Washington.
Additional data:
There is a high probability of a La Niña event during DJF 2025-2026 and a risk of drought in the Southern Cone, which could drive up the cost of commodities such as soybeans and corn.
Soybeans — Producer hedging caps this. What if it doesn't?Producer hedges in soybeans are sitting above 600K contracts right now. That level usually tracks price down.
But if it doesn't this time — price just keeps grinding to fresh highs anyway.
Back in 2020 something similar happened. Hedging was heavy, and price broke higher regardless. What was actually driving it wasn't really a mystery though — China came back into the market in size on the back of the trade deal that year, and a stretch of storms and dry weather on top of that gave it extra fuel. Beans ended up running close to 40% higher over the following several months.
No idea if the same ingredients show up this time. But when the hedge that's supposed to keep a lid on price isn't doing its job, that's usually a sign something else is in the mix. Worth just watching for now.
Not financial advice — just how I'm reading it. Manage your risk.
Will Super El Niño Reshape Soybean Futures?Global weather concerns and insatiable Chinese demand rapidly spike corn, wheat, and soybean prices. Meteorologists from DW News confirm that a historically strong El Niño pattern will disrupt global agriculture. The United Nations warns that climate change exacerbates these erratic weather events. Consequently, economists predict a severe shock to global food prices lasting well into 2028. Investors must understand how these environmental catalysts drive soybean futures across multiple sectors. This article explores the ripple effects of volatile soybean markets through various vital domains.
Geopolitics and Geostrategy
Soybean futures heavily influence modern geopolitics. Nations aggressively secure food supply chains to prevent civil unrest and economic instability. China consistently imports massive volumes of soybeans to feed its massive livestock population. Extreme weather incidents threaten traditional supply lines, forcing countries to form new trade alliances. Strategists monitor global weather patterns to predict shifts in agricultural dominance. Severe droughts in Southeast Asia or flooding in the Americas alter geopolitical leverage. Consequently, robust soybean reserves grant nations significant geostrategic power during climate crises.
Macroeconomics and Economics
The impending El Niño super-cycle severely impacts global macroeconomics. Economists warn that rising soybean futures drastically inflate food prices worldwide. Heat extremes and altered precipitation patterns decimate crop yields, constricting global supply. High demand colliding with low supply forces commodity prices upward. This dynamic heavily influences inflation rates and central bank policies. Developing nations face the harshest economic shocks as basic food costs skyrocket. Investors closely watch soybean futures as a primary indicator of broader economic health and impending inflationary pressures.
Industry Trends and Business Models
Agricultural volatility forces industries to adapt rapidly. Farmers increasingly adopt climate-resilient crops to mitigate weather risks. Companies pivot away from traditional agriculture toward agile, sustainable business models. Vertical farming and controlled-environment agriculture gain massive traction as unpredictable weather threatens open-field yields. Agribusinesses diversify their supply chains to avoid catastrophic losses from regional weather disasters. Profit margins depend entirely on anticipating market fluctuations driven by climate data. Consequently, dynamic pricing models replace static contracts to accommodate the erratic nature of soybean futures.
Management, Leadership, and Company Culture
Corporate leaders must navigate unprecedented volatility in commodity markets. Effective management requires swift decision-making based on real-time climate and economic data. Leaders foster a company culture centered around innovation and extreme adaptability. Agricultural firms prioritize continuous learning to keep pace with rapid environmental changes. Executives actively recruit meteorologists and data scientists to anticipate supply chain disruptions. Furthermore, sustainable practices dominate corporate values as consumers demand environmentally responsible operations. Successful companies build resilient teams capable of thriving amidst constant market turmoil.
Technology, High-Tech, and Cybersecurity
Technology actively revolutionizes agricultural production and commodity trading. High-tech sensors and AI-driven analytics optimize crop yields despite adverse weather. Precision agriculture minimizes waste and maximizes soybean production efficiency. Meanwhile, traders rely on sophisticated algorithms to navigate volatile futures markets. This heavy reliance on digital infrastructure escalates cybersecurity risks. Hackers routinely target agricultural supply chains and commodity trading platforms. Companies invest heavily in robust cybersecurity measures to protect sensitive pricing data and proprietary farming technologies. Digital defense remains crucial for stabilizing global food markets.
Science and the Pharmaceutical Industry
Climate science directly informs soybean market predictions. Scientists monitor the "Niño 3.4 region" to forecast weather anomalies. They use tools like the Relative Oceanic Niño Index to separate global warming from natural cycles. Interestingly, the pharmaceutical industry heavily relies on soybean derivatives. Soybeans provide crucial isoflavones, proteins, and excipients for countless medications. Supply chain disruptions threaten pharmaceutical manufacturing just as much as food production. Consequently, pharmaceutical companies closely monitor soybean futures to secure raw materials for life-saving drugs and nutritional supplements.
Patent Analysis and Future Innovation
Patent analysis reveals a massive surge in soy-related innovations. Researchers aggressively patent drought-resistant soybean traits to combat severe weather. Biotech firms develop novel plant-based proteins to satisfy shifting consumer diets. Patent filings for climate-resilient agricultural methods increase exponentially each year. This intellectual property race highlights the urgent need for sustainable food solutions. Investors fund these innovations to secure long-term profitability in a volatile market. Ultimately, these patents dictate the future trajectory of global agriculture and stabilize soybean futures against climatic uncertainty.
SOYBEANS Short SignalSoybeans MTF Conf2.0 Short Idea. I don't trade soybeans, so I will not be trading this, but I thought I would share the TDA
Technicals:
Price inside Monthly supply + Daly confirmation 2.0.
Fundamentals/Sentiment:
COT short correlation by banks/insitutions adding into shorts and closing longs.
No idea on fundamentals/crop report.
Overall:
Valid to short straight up inside supply OR wait for 30min/1hr/4hr confirmation.
SOYBEAN FUTURES DXY & REAL YIELD IMPLICATIONS
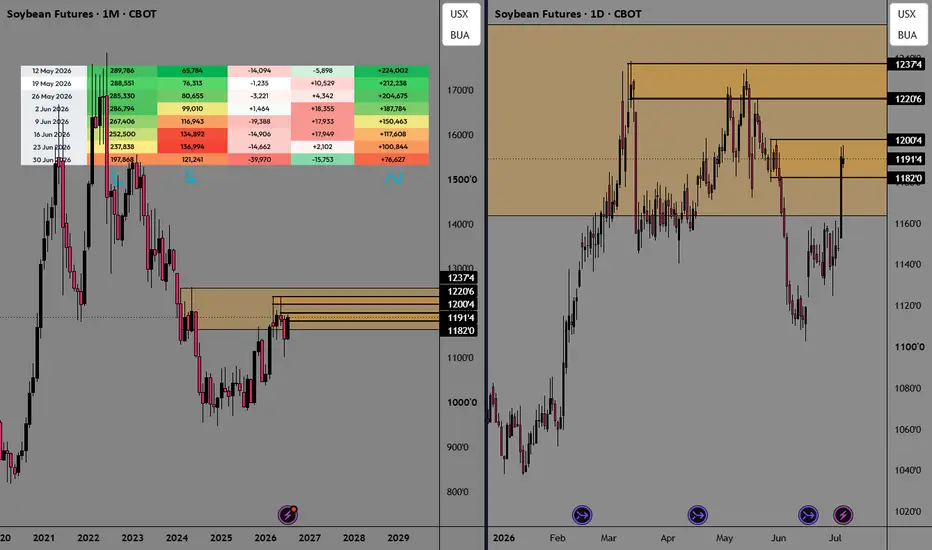
DXY 100.90, real yield 2.255% — both still restrictive for the broader commodity complex (BCOM 125.72). Hawkish Warsh Fed is a structural headwind, but soybean's demand-side story (crush/biodiesel) is currently strong enough to decouple from the DXY-driven bearish macro pressuring metals — similar decoupling dynamic to the wheat fertilizer/Iran narrative flagged earlier this week. LIQUIDITY MAP : Price (1187.4) is trading above the prior weekly high and just below the prior monthly high (1194.4) — resting inside a resistance shelf. Above, the poor high cluster at 1200.6/1212.0/1220.0 represents unfinished business — thin, low-volume territory that acts as a magnet once 1194.4 is cleared. Below, single prints at 1184.6/1174.2/1164.4 are the first layer of untested support on any retracement, backstopped by weekly 200 EMA (1152.4), prior weekly POC (1148), and the poor low at 1146. WYCKOFF / MARKET PROFILE
Structure resembles a markup phase testing into a supply zone, with the single prints beneath (1164.4/1174.2/1184.6) representing unfinished auction — a "b" distribution shape isn't yet confirmed since price hasn't rejected the highs. Given 4H KMCM is FOMO/Overheated while Daily KMCM is Neutral/Balanced, the more probable near-term sequence is a local Upthrust-style test of the poor highs (1200.6+) followed by rotation back toward the weekly POC (1148) or single-print support, rather than clean acceptance and a full Sign-of-Strength extension — unless WASDE (Jul 10) supplies a genuine fundamental trigger. TRADE LOCATION & INVALIDATION
Continuation long (pullback entry): 1174.2–1164.4 single-print zone | Invalidation: close below 1152.4 (weekly 200 EMA) / 1148 (prior weekly POC)
Breakout long (momentum entry): acceptance above 1194.4 Target 1200.6 → 1212.0 → 1220.0 Invalidation: re-entry below 1184.6
Fade short (mean-reversion, 4H overheated): 1200.6–1212.0 Target 1148 (weekly POC) Invalidation: close above 1220.0
SOYBEAN Futures ...Up dateCommercials became materially more bullish.
Funds became materially more bearish.
Price stopped falling.
That divergence is often seen near important turning points.
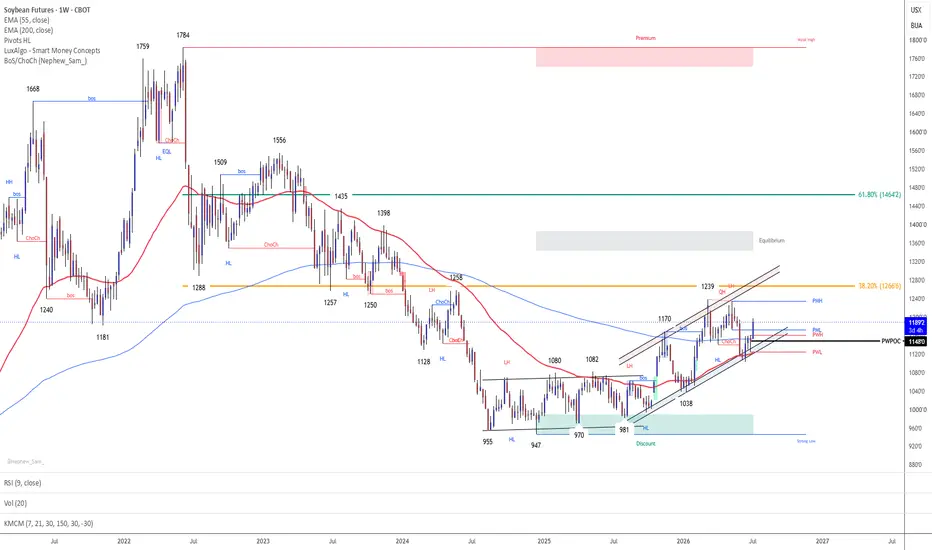
The 1102–1117 zone now looks increasingly like a potential Wyckoff Spring/Test area, while 1170 remains the key BOS level. A daily and weekly close above 1170 would significantly strengthen the case that the decline from 1235 was corrective rather than the start of a larger bear market.
Critical Levels This Week
Support: 1115 → 1102
Resistance: 1170
Liquidity Targets: 1194 → 1200
Trend Confirmation: Above 1170
Trend Failure: Below 1102
The battle between the weekly 200 EMA (1152) and the weekly 55 EMA (1117) remains the most important technical feature on the entire chart.
Current Price: 1151.6
Weekly 200 EMA: 1152.2
We are trading exactly at the weekly 200 EMA.....This is a major decision area.
Invalidation Levels
Bullish Invalidation Daily close below: 1110 Then: 1102
Bearish Invalidation Daily close above: 1170 Then: 1194
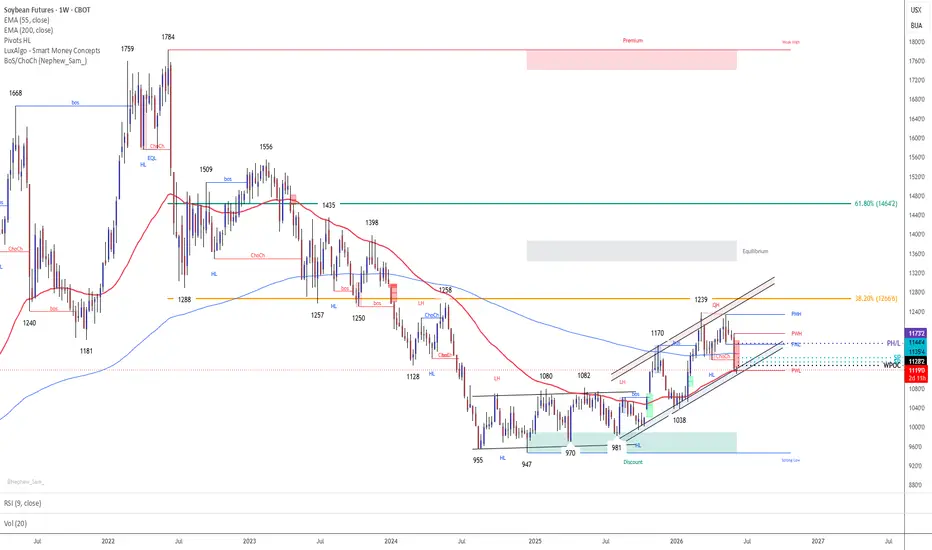
SOYBEAN FUTURES ....SOYBEAN FUTURES –
Price: 1117.0
Weekly 55 EMA: 1116.0
Weekly 200 EMA: 1152.0
DXY: 99.87
US 10Y Real Yield: 2.198%
Bloomberg Commodity Index: 130.48
The macro environment has become significantly less supportive for grains than a month ago:
Headwinds
DXY approaching 100.00
Real Yield back near 2.20%
Bloomberg Commodity Index falling sharply from 138.96 → 130.48
Managed Money reducing longs and aggressively adding shorts.....This is a classic risk-off commodity environment.
USDA Crop Progress Assessment : At current prices the market is increasingly pricing a favorable crop outcome.
Wyckoff Assessment The structure now resembles:
Distribution
Buying Climax:
1235
Automatic Reaction:
1170
Secondary Test:
1194
Sign of Weakness:
Break below 1170
Last Point of Supply:
1194
Current:
Markdown DXY & Real Yield Implications
This combination is typically negative for grains. If: DXY breaks 100 and Real Yield moves above 2.25 : Then pressure likely intensifies. Conclusion :
The market is at the most important technical location since the 955 low.
We have a rare confluence of:
Weekly 55 EMA (1116)
Deeply depressed 36M COT Index (14.9%)
Commercial hedges being reduced
Price testing major support
versus
Aggressive Managed Money short building
DXY near 100
Real Yields near 2.20%
Wyckoff markdown structure
The battle between 1110–1128 will likely determine whether Soybeans are entering a final capitulation phase toward 1082/1038, or beginning a larger re-accumulation process for the second half of the year.
#soybeans #zs1! #commoditytrading #cme #wasde I. COT Structure & Fund Flows: Paper Speculation vs. Commercial Accumulation
To understand why CBOT Soybeans (ZS) futures have trended lower despite structural physical tightness, one must analyze the divergence between paper positioning and physical commercial behavior (Data as of June 2, 2026):
• Paper Bears in Overdrive (Managed Money): The recent downward momentum is entirely driven by systematic and algorithmic. Managed Money (MM) has aggressively liquidated long exposures down to 218,597 lots while spiking short positions by +54.4% (reaching 62,817 lots). Funds are aggressively selling into short-term weather models and technical breakdowns.
• The Commercials are Buying ( Producers): In stark contrast to the aggressive shorting by funds, the world's largest physical agricultural merchants have actively reduced their net short exposure by -3.2% (down to 568,244 lots). Commercials are refusing to lock in short hedges for the new crop at these depressed price levels. Instead, they are taking profits on legacy paper shorts and utilizing that liquidity to quietly sweep physical supplies at a discount as domestic silo inventories deplete to feed record crush operations.
II. Strategic Outlook & Trading Playbook
For international traders and commercial importers, the current pre-event window (week of June 8–12) offers an asymmetric risk-reward setup to accumulate long exposure before a potential structural reversal.
1. Technical Baseline & Value Area
• The current value area for the front-month contracts around 1120 – 1135 cents/bushel is being fiercely defended. This is highlighted by institutional limit-buy orders and massive short-covering volumes (recording a major volume spike of 145K lots on June 5).
• Total market Open Interest (OI) stands at a massive 1,031,640 lots. This massive open interest combined with a multi-month price floor indicates that the speculative short float is heavily trapped at the absolute bottom of the cycle.
2. Execution Strategy
• Accumulation Zone (The "Whale-Tracking" Order): Utilize the current price weakness around the projected US crop cost-of-production floor of 1130 – 1140 cents/bushel (or lower-bound support tests near 1115–1120) to scale into multi-layered Long Grid positions. This positions your average cost alongside the structural accumulation zone of the commercial giants.
• The June WASDE Catalyst (Short Squeeze Risk): If the USDA updates export demand or flashes a tightening revision on June 12, a violent Short Squeeze will likely trigger. Trapped Managed Money algorithms will be forced to buy back shorts via market orders, rapidly clearing the path back toward the 1200 – 1220 technical targets.
3. Breakout Scenarios & Risk Management
• Bullish Breakout (Confirmation): A clean weekly/monthly close above the 1160–1180 resistance cluster will break the macro bearish channel, opening the doors for a structural bull run targeting the historical liquidity nodes at 1250 and 1300.
• Bearish Invalidation: If a major macro liquidation forces a definitive close below the 1100 psychological support, the long-term bullish structure will be delayed, shifting the market into a capitulation phase toward 1040–1060.
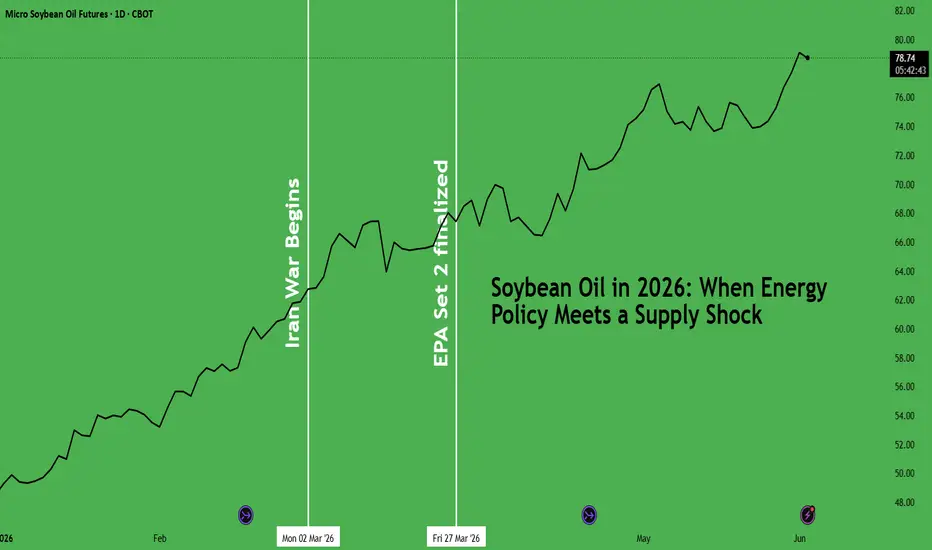
Soybean Oil in 2026: When Energy Policy Meets a Supply ShockSoybean oil is up 62.6% year-to-date in 2026. Soybean oil is an agricultural commodity derived from soybeans. It is widely used in cooking, food processing, and as an industrial input. But the Soybean Oil story is now dominated by biodiesel as increasing quantities of the edible oil are redirected towards energy.
This paper delves into Soybean Oil’s energy story with historical examples of how these cycles usually play out.
Soybean Oil and Energy
When crude rises, conventional diesel becomes expensive, and biodiesel becomes relatively attractive. Leading refiners towards higher substitution quantities, especially during supply shocks.
That demand is further anchored by the U.S. Renewable Fuel Standard (RFS). The RFS legally mandates a minimum annual volume of biomass-based diesel. This creates a demand floor for soybean oil that is independent of crude prices or food demand.
The U.S. Environmental Protection Agency (EPA)’s “Set 2” rule, finalised in March 2026, raised that mandate by 61% in a single step, from 3.35 billion gallons (2025) to 5.4 billion gallons (2026).
Source: EPA
The downstream effect is captured in the USDA May 2026 WASDE. In the 2024/25 crop year, biofuels accounted for 43.7% of all U.S. soybean oil consumed domestically. By 2026/27, that share is projected to reach 54.4%. Over half of domestic soybean oil is now used for energy.
Source: USDA (WASDE), May 2026
Soybean Oil is a More Resilient Energy Bet
The rolling 20-day correlation between ZL (Soybean Oil Futures) and CL (Crude Oil Futures) peaked near 1.0 in late March, when the Hormuz disruption and the EPA Set 2 announcement landed within days of each other. By April, crude sold off sharply on ceasefire news. Soybean oil not only held but continued to advance. Correlation collapsed toward zero. At 0.28, the two are now trading independently.
Crude has since retraced further, yet soybean oil has held its gains. In other words, policy is driving ZL, not crude prices.
Technical Signals
Price holds above all MAs following a 9/21 bullish crossover. R1 at 79.74 is the next test; a break opens R2 at 81.75.
MACD has crossed back above its signal line, signalling renewed momentum. RSI at 70 is approaching overbought but remains below the prior peak of 80, leaving room to run.
Source: CME CVOL
Implied volatility spiked on the Hormuz shock, then collapsed as price extended. The market is not pricing in downside risk. IV is now near YTD lows while price sits at YTD highs. The minor recovery in recent days is worth watching.
Managed Money has started to cut back net long after a historic buildup:
Managed money entered 2026 deeply net short at -70K contracts, then flipped aggressively as the Hormuz shock and EPA Set 2 hit simultaneously. Positioning peaked at 170K net longs in the week ending May 5 before profit-taking set in. At 141K, longs are trimming but not exiting.
Historical Trade Setup
Russia-Ukraine Supply Shock — February 2022
Russia’s invasion of Ukraine on February 24, 2022 triggered an acute global vegetable oil supply shock. Sunflower oil exports from the Black Sea collapsed, driving demand rotation aggressively into soybean oil. A tactical long on ZLH22 (Soybean Oil Futures, March 2022) captured the ensuing rally.
CME Micro Soybean Oil Futures (MZL) were launched on February 24, 2025 and were not available during the 2022 period. The trade below uses micro contract sizing for illustration.
Long CME Micro Soybean Oil Futures, MZL (Illustrative Equivalent)
Entry: USc 65.94/lb — February 24, 2022
Exit: USc 82.63/lb — April 19, 2022
Gross Profit: (82.63 − 65.94) × 6,000 / 100 = USD 1,001
This trade would have yielded a net gain of 25.3%.
EPA RFS Set 1 Mandate Announcement — June 2023
The EPA’s finalised RFS “Set 1” rule on June 21, 2023, raised the biomass-based diesel mandate to 2.82 billion gallons, lifting soybean oil prices as feedstock demand rose sharply. Despite an initial sell-the-news reaction on the day, the market grasped the scale of the demand shift and bid aggressively over the following weeks.
CME Micro Soybean Oil Futures (MZL) were launched on February 24, 2025 and were not available during the June 2023 period. The trade below uses micro contract sizing for illustration.
Long CME Micro Soybean Oil Futures, MZL (Illustrative Equivalent)
Entry: USc 57.13/lb — June 21, 2023
Exit: USc 68.21/lb — July 24, 2023
Gross Profit: (68.21 − 57.13) × 6,000 / 100 = USD 665
This trade would have yielded a net gain of 19.4%.
In 2026, both types of catalysts are active simultaneously. The Hormuz closure brought the energy supply shock; the EPA Set 2 rule brought the demand mandate. Historically, either driver on its own has been enough to move soybean oil prices sharply. The current setup compounds them.
The ZL/ZM ratio measures soybean oil's price relative to soybean meal. Both come from the same crush process, but only soybean oil carries the biodiesel demand channel, which is what has driven the premium to current levels.
At 0.24, the ratio has moved above every level recorded in the past five years, including the Russia-Ukraine high of 0.20. In every prior instance, a spike of this magnitude was followed by compression. The EPA Set 2 mandate complicates the picture somewhat: it has raised the structural demand floor for soybean oil in a way prior cycles did not, so any reversion may be shallower than history alone would suggest. That said, at current levels, ZM is the leg most likely to recover relative ground.
This content is sponsored.
MARKET DATA
CME Real-time Market Data helps identify trading setups and more effectively express market views. If you have futures in your trading portfolio, you can check out on CME Group data plans available that suit your trading needs at tradingview.com/cme .
DISCLAIMER
This case study is for educational purposes only and does not constitute investment recommendations or advice. Nor are they used to promote any specific products, or services.
Trading or investment ideas cited here are for illustration only, as an integral part of a case study to demonstrate the fundamental concepts in risk management or trading under the market scenarios being discussed.
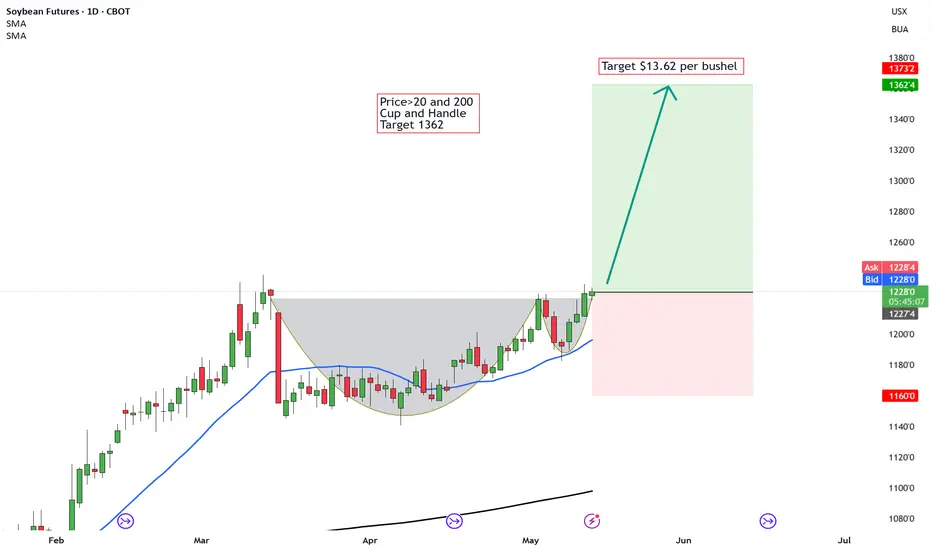
SOYBEANS - The unspoken market that is set to soarSoybeans are beginning to show renewed bullish momentum as weather risks, global food demand and biofuel trends continue supporting agricultural commodities.
Technically, the market is breaking higher from a strong continuation structure while remaining above key moving averages.
Agricultural markets can move aggressively when supply concerns and technical momentum align together.
🌍 Fundamentals
Global Food Demand
Soybeans remain one of the world’s most important food and animal feed commodities.
Biofuel Demand
Soybean oil demand continues growing because of renewable diesel and biofuel production.
China Demand
China remains one of the world’s biggest soybean importers.
Supply Concerns
Lower crop yields or export disruptions can quickly tighten global inventories.
📈 Technicals
Cup and Handle Formation
Soybeans appear to be forming a bullish cup and handle continuation pattern.
Above the 20 & 200MA
Price remains above major moving averages, supporting the bullish structure.
Breakout Attempt
The market is attempting to break above recent resistance levels.
Higher Lows
Buyers continue stepping in on pullbacks, showing improving momentum.
Target Projection
The measured move projects a potential upside target near:
🎯 $13.62
⚠️ Important Note About Soybean Pricing
Soybean futures are priced differently from stocks or forex.
The number:
12286
usually means:
1228.6 cents per bushel or $12.28
A:
Bushel = a farming measurement unit
100 points = 1 cent movement in many futures quotes
So:
12286 ≈ $12.286 per bushel
1362 target ≈ about $13.62 per bushel
ZS Long — $ZSN26 pullback into 1200-1202 support after flushing Setup: The 4h chart shows ZS bottomed near 1165 in mid-March and carved a higher-low structure through April, culminating in a sharp impulse leg from 1175 to 1226 into May 4. After that peak the contract sold off hard over May 5-6 with elevated volume — a distribution flush that ran from 1226 down to the 1183-1185 zone. Price has since bounced and is currently reclaiming the 1200-1202 shelf, which served as consolidation support during the late-April ramp. The 1h chart shows the bounce off 1183 low was decisive, with the May 7-8 session grinding back through 1190s and now tagging 1208 into the close. The key structural level is 1200-1202 — the prior range highs and the launch pad before the May 4 breakout.
Flow: Grain complex broadly firming with ZW and ZC also bid, consistent with DXY weakness and commodity tailwinds. Non-commercial net long remains heavily elevated at +193,939 contracts, though open interest dropped sharply (-93k WoW) suggesting some speculative liquidation — the flush from 1226 to 1183 was consistent with that unwinding. The surviving net long position with a recovering price suggests the washout is absorbing weak longs rather than reversing the trend. Broad risk-on tape and DXY weakness provide macro tailwind for the commodity complex.
Plan: Stop sits below the May 7 swing low at 1183-1185 — a close below 1187 invalidates the higher-low recovery thesis and suggests the distribution is extending. Target is the prior high cluster around 1222-1226 from the May 4 peak — a full retrace of the selloff. R/R is approximately 2:1 from current levels. TTL is set to allow price to digest and retest the 1200-1202 zone; if it cannot hold that shelf on a pullback within the session, the setup fails.
📍 Entry: 1202.00
🛑 Stop: 1187.00
🎯 Target: 1222.00
⚖️ R:R: 1.33
Global Supply, China Demand, and the Soybean OutlookGlobal Flows, Policy Risk, and the Headlines Driving ZS
Soybeans futures trade under the ticker ZS and represent one of the most globally interconnected agricultural contracts. Price is primarily influenced by United States acreage and yield expectations, South American production, export demand from China, currency movements, biofuel policy, and freight dynamics along major river systems.
The most important recurring reports for traders include the United States Department of Agriculture World Agricultural Supply and Demand Estimates report, commonly referred to as WASDE, the Prospective Plantings and Quarterly Stocks reports, weekly Export Sales data, and Brazil and Argentina crop updates from agencies such as CONAB in Brazil. Weather models during the United States growing season and during the South American summer are also critical drivers of volatility.
On the global stage, the United States, Brazil, and Argentina remain the dominant exporters. Brazil has overtaken the United States as the largest exporter in recent years, while China remains by far the largest importer, typically accounting for more than sixty percent of global soybean trade. Any shift in Chinese crush margins, hog herd dynamics, or trade policy has an outsized impact on price discovery in ZS.
Recent sentiment has been shaped by several specific developments. In late 2025, persistent dryness across parts of central Brazil raised concerns about yield potential during early pod setting, contributing to risk premium being priced into futures. At the same time, renewed tension in the Black Sea region and ongoing instability in parts of the Middle East increased broader commodity risk appetite, spilling over into grains as funds added exposure across the agricultural complex.
In December 2025, soybeans came under pressure after updated Brazilian production estimates pointed to better than feared output, while Argentine weather improved with timely rains. The United States dollar also firmed on stronger economic data, weighing on export competitiveness. Additionally, weaker Chinese crush margins and reports of slower import pacing added to the bearish tone.
In early February 2026, headlines shifted after the United States Department of Agriculture reported daily flash sales of U.S. soybeans to China. The purchases were viewed as state backed buying amid renewed trade engagement, reinforcing expectations that Beijing was actively securing U.S. supply despite Brazil’s advancing harvest. The confirmation of Chinese demand forced a repricing of export expectations and triggered initiative buying, shifting short term order flow back to the upside.
Going forward, traders should monitor additional USDA flash sales to China, updates tied to the U.S. China trade communication, and any policy signals that suggest acceleration or pause in Chinese purchasing activity. These are the macro headlines most likely to influence price in the near term.
What the Market Has Done
• Since 2024, the market has been in a large sideways range until April 2025, where the market started to compress as buyers stepped up bids and sellers stepped down offers within the range. Buyers were able to overwhelm the offers and the market broke out of the compression in October 2025, auctioning up to 1190 (daily level 2). This breakout coincided with mounting concerns about Brazilian dryness and elevated geopolitical tension that lifted the broader commodity complex.
• Buyers attempted to hold above 1140, which marked the high of the multi year range, through November 2025, but failed. Sellers took back control and auctioned prices back down within the larger multi year range, down to 1055 in the vicinity of the October 2025 VPOC, where buyers stepped up to defend. The December 2025 selloff aligned with improved South American rainfall forecasts, firmer United States dollar conditions, and softer Chinese demand signals.
• From the last week of December into January 2026, the market balanced and formed a bid block, rotating within value as participants established acceptance near the lows.
• In the first week of February, buyers initiated and the market imbalanced out of the January 2026 VA after the United States Department of Agriculture reported daily flash sales of U.S. soybeans to China. The announcement came amid renewed trade dialogue and reports that Chinese state buyers were actively securing U.S. cargoes despite Brazil’s advancing harvest. The confirmation of large export sales shifted near term demand expectations and forced short covering, allowing price to reclaim 1135 and rotate back into the offer block with pace.
What to Expect in the Coming Weeks
Key level to watch is 1140, which aligns with the November 2025 VAL and the offer block low.
Bullish Scenario
• If buyers are able to defend 1140 at the offer block low, expect the market to move up to 1190 (daily level 2), where sellers are expected to respond.
• If price breaks and accepts above daily level 2, expect continuation toward 1220 at the June 2024 VPOC. This would be significant, as it would mark the first return to that level since June 2024 and confirm a structural shift in control to buyers.
Neutral Scenario
• If the market approaches the edges at 1190 on the top and 1140 on the bottom without pace and volume, expect possible false breaks at the edges and reversion back into the offer block range.
• Expect a two way auction within the offer block range as the market establishes value higher, with rotational activity dominating until a catalyst provides expansion.
Bearish Scenario
• If buyers are not able to defend 1140, expect long liquidation and a move back down through the current month LVA toward 1070 in the vicinity of the bid block and trend line.
• At that level, expect buyers to respond, but failure there would open the door for a deeper rotation back toward 1055 (Oct 2025 VPOC).
Conclusion
Soybeans are trading at a macro sensitive inflection. Technically, 1140 defines whether buyers maintain initiative or lose control back into balance. Fundamentally, the dominant driver is sovereign level demand and trade policy, particularly confirmed Chinese purchases of U.S. supply and the tone of bilateral trade communication.
If additional USDA flash sales confirm continued Chinese buying, the technical structure supports acceptance above daily level 2 and continuation toward the June 2024 VPOC. If demand headlines fade, the market risks reverting back into prior balance.
Watch the headlines, then watch the response at key levels. That reaction will reveal whether this move is repositioning or true structural change.
This article is for informational and educational purposes only and does not constitute financial advice. Futures trading involves substantial risk and is not suitable for all investors.
Disclaimer: This is not financial advice. Analysis is for educational purposes only; trade your own plan and manage risk.
Acronyms:
C - Composite
w - Weekly
m - Monthly
VA - Value Area
VAH - Value Area High
VAL - Value Area Low
VPOC - Volume Point of Control
LVN - Low Value Node
HVN - High Value Node
LVA - Low Value Area
SP - Single print
ATH - All time high
Neckline Breaks and Trader Nerves: A Quick Guide to Bearish H&S The head and shoulders pattern is like the market’s way of clearing its throat and saying, “Things might be changing up here.” Once that neckline snaps, traders often sit up straighter — not because something magical happened, but because the chart finally drew a clean line between “maybe” and “now it matters.”
In this ZS (Soybean Futures) example, price slipped under the neckline and started wandering toward lower ground. Traders who work with this pattern usually focus on three things:
A possible bounce back toward the neckline (because markets love second chances),
A clear invalidation level (in this case, above 1136),
A logical downside objective such as the gap-and-support combo near 1070'4.
That simple trio turns a chaotic chart into a calm plan.
Contract specs matter too. The ZS contract moves in bigger bites:
Tick: 1/4 of one cent (0.0025) per bushel = $12.50 per contract
Margin: $2,000 per contract
The MZS (Micro Soybean Futures) contract takes smaller ones:
Tick: 0.0050 per bushel = $2.50 per contract
Margin: $200 per contract
Traders who want more precision sometimes choose the micro so their stop-loss distance and account size stay on speaking terms. Either way, the chart sets the idea, but the contract size sets the comfort level.
And of course, the golden rule in pattern-based trading: the market can still do whatever it wants. That’s why traders define their exit if wrong, their objective if right, and their size before clicking anything. A head and shoulders isn't about predicting — it's about organizing.
The chart example ties it all together: neckline break, resistance overhead, downside target below. Simple, structured, and practical — just the way traders like it.
Want More Depth?
If you’d like to go deeper into the building blocks of trading, check out our From Mystery to Mastery trilogy, three cornerstone articles that complement this one:
🔗 From Mystery to Mastery: Trading Essentials
🔗 From Mystery to Mastery: Futures Explained
🔗 From Mystery to Mastery: Options Explained
When charting futures, the data provided could be delayed. Traders working with the ticker symbols discussed in this idea may prefer to use CME Group real-time data plan on TradingView: www.tradingview.com - This consideration is particularly important for shorter-term traders, whereas it may be less critical for those focused on longer-term trading strategies.
General Disclaimer:
The trade ideas presented herein are solely for illustrative purposes forming a part of a case study intended to demonstrate key principles in risk management within the context of the specific market scenarios discussed. These ideas are not to be interpreted as investment recommendations or financial advice. They do not endorse or promote any specific trading strategies, financial products, or services. The information provided is based on data believed to be reliable; however, its accuracy or completeness cannot be guaranteed. Trading in financial markets involves risks, including the potential loss of principal. Each individual should conduct their own research and consult with professional financial advisors before making any investment decisions. The author or publisher of this content bears no responsibility for any actions taken based on the information provided or for any resultant financial or other losses.
From Neckline to Target: Setting H&S Bearish Entries and ExitsUnderstanding the Head & Shoulders Breakdown
A bearish head and shoulders pattern gives traders a structured way to define entries and exits using price geometry rather than emotion. The pattern forms when a market transitions from strength to distribution, creating a left shoulder, a higher head, and then a lower right shoulder as momentum begins to fade. The neckline acts as the key support level that separates a developing pattern from a completed one.
In the case study illustrated on the chart, the daily timeframe shows a fully developed head and shoulders structure that confirmed during the December 5 trading session, when price closed below the neckline. This type of close is often interpreted by traders as evidence that bearish participation has taken control of the pattern. Whether a trader enters immediately or waits for a retest, the priority becomes identifying the levels that will structure the trade: the area of invalidation, the downside objective, and the points where risk must be controlled.
A confirmed neckline break does not imply certainty about future price direction. Instead, it provides an organized framework—a map traders can use to define where their idea is considered valid and where it is considered invalid. The educational value of this pattern lies not in its ability to predict, but in its ability to help traders pre-plan actions with clarity.
Structuring the Bearish Entry: Neckline Retests and Resistance Zones
One of the most common approaches to trading a bearish head and shoulders is to monitor for a modest bounce back toward the neckline after the breakdown. Retests do not always occur, but when they do, many traders see them as opportunities to enter with more control over the distance between entry and stop.
In this example, price sits beneath a well-defined UFO resistance area between 1123 and 1136. This band aligns with a cluster of unfilled sell orders, which may reinforce bearish pressure if price attempts to climb. More importantly, the upper boundary of the zone—1136—serves as an objective point of invalidation. If price were to move above that level, the logic of the completed bearish structure would no longer hold. Therefore, traders could use this upper boundary as a stop-loss level. It is neither arbitrary nor emotional; it is derived directly from the structure.
This type of predefined invalidation is essential because even the cleanest technical patterns can fail. The purpose of using a pattern is not to guarantee the outcome, but to know exactly when the trade thesis no longer makes sense. In this framework, the neckline provides context for the entry, while the resistance zone provides clarity for where the idea is wrong.
Defining the Target: Gap Alignment and Technical Confluence
After establishing where a trade becomes invalid, traders turn to the question of where it becomes complete. In pattern-based trading, target selection often blends classical measurement rules with the identification of technical areas where price has reason to react. In this case study, the downside objective centers on 1070'4, where two important elements align.
First, there is an open gap at this price level. Gaps frequently attract price because they represent prior imbalances in trading activity—areas where the market moved too quickly for participants to fully transact. When price revisits such a location, it becomes a zone where activity may increase. Second, the gap coincides with a region of unfilled buy orders that may serve as a UFO support area. When gaps and demand zones overlap, the confluence strengthens the rationale for using the level as a target.
Because the bearish pattern is already confirmed, traders using this structure may calculate a reward-to-risk ratio by comparing the distance from the entry zone to the stop (near 1136) and the distance from the entry zone to the target (1070'4). The role of the target is not to predict where price will go, but to anchor the trade in a predefined and measurable plan. It transforms the setup into a risk-managed scenario rather than an open-ended directional hope.
Understanding Contract Specs, Margin, and Risk Management
Traders using standardized futures contracts must structure their decisions around contract size, tick value, and margin requirements. The chart example in this idea uses the standard ZS contract, which represents 5,000 bushels. The micro contract (MZS) represents 500 bushels. This difference directly affects position sizing and the dollar impact of each tick. Because margin requirements vary over time, traders should always check the latest values before entering any position.
Tick (Minimum Price Fluctuation:
ZS: 1/4 of one cent (0.0025) per bushel = $12.50 per contract
MZS: 0.0050 per bushel = $2.50 per contract
Current Margin Requirements:
ZS: $2,000 per contract
MZS: $200 per contract
A key benefit of having two contract sizes available is flexibility. Traders seeking to maintain disciplined risk parameters often use micro contracts to fine-tune exposure, ensuring that the stop-loss level does not exceed their predefined risk tolerance. The objective of the head and shoulders pattern is not merely to identify a direction but to help traders organize their plan around risk boundaries. Knowing the contract’s characteristics enables the trader to size positions correctly.
Risk management remains the foundation of pattern-based approaches. Price can behave unpredictably, even when the chart seems decisive. This is why traders emphasize position sizing, controlled leverage, and strict adherence to the stop-loss level. The goal is not to avoid losses entirely but to keep them manageable and consistent. A well-constructed head and shoulders strategy relies not only on identifying the pattern but on respecting the risk parameters that accompany it.
Bringing It All Together: Structure, Context, and Discipline
The chart included in this idea illustrates the essential elements of the bearish head and shoulders setup: the left shoulder, head, and right shoulder; the neckline break; the gap at 1070'4; and the resistance band between 1123 and 1136. These levels form the backbone of a structured trading plan. Rather than reacting to market movement in real time, traders can use these predefined reference points to guide decision-making with consistency.
The purpose of this article is educational. It demonstrates how entries, exits, and risk parameters can be structured around a classical bearish head and shoulders pattern, how confluence strengthens downside targets, and how contract specifications help traders align position size with their risk tolerance. Above all, it shows that disciplined planning matters more than attempting to anticipate every price movement.
When charting futures, the data provided could be delayed. Traders working with the ticker symbols discussed in this idea may prefer to use CME Group real-time data plan on TradingView: www.tradingview.com - This consideration is particularly important for shorter-term traders, whereas it may be less critical for those focused on longer-term trading strategies.
General Disclaimer:
The trade ideas presented herein are solely for illustrative purposes forming a part of a case study intended to demonstrate key principles in risk management within the context of the specific market scenarios discussed. These ideas are not to be interpreted as investment recommendations or financial advice. They do not endorse or promote any specific trading strategies, financial products, or services. The information provided is based on data believed to be reliable; however, its accuracy or completeness cannot be guaranteed. Trading in financial markets involves risks, including the potential loss of principal. Each individual should conduct their own research and consult with professional financial advisors before making any investment decisions. The author or publisher of this content bears no responsibility for any actions taken based on the information provided or for any resultant financial or other losses.
CBOT Soybean Technicals and Fundamentals (ZS1!) - Dec 05, 2025Soybeans remain in a corrective phase after confirming a short‑term top, with price likely to probe lower supports unless weather or WASDE headlines flip the sentiment.
🟤 CBOT Soybean Technicals (ZS1!)
- 🧱 **Pattern**: A clear **Head & Shoulders** has formed on the daily chart, with price breaking down toward the neckline zone around **1105–1100¢**, right on a key high‑volume node and 0.382–0.5 retracement of the October–November rally.
- 📉 **Downside levels**: Next supports sit near **1078¢** (0.5 retracement / demand box) and **1055–1060¢** (0.618 + 200‑day area), while immediate resistance is now **1138–1150¢** at the right‑shoulder and failed breakout area.
- 📊 **Momentum**: Daily and 2‑hour **RSI** have rolled over below their signal lines, and the weekly chart is stalling directly under the **200‑week MA** and a thick volume shelf, highlighting heavy supply overhead.
🎯 Trading Bias & Strategy
- 🐻 **Bias**: As long as price holds below roughly **1140–1150¢**, the working assumption is a **corrective leg toward 1080–1060¢**, where multiple supports cluster and responsive buyers are likely to show.
- 📌 **Invalidation**: A strong close back above the right‑shoulder band and weekly supply zone around **1160–1170¢** would negate the topping structure and reopen the path toward the recent swing high near **1170¢+**.
- 🧮 **Tactics**: Favour **sell‑the‑rally** setups into resistance or maintain producer hedges until either (a) a flush into the lower box prints exhaustion signals, or (b) bulls recapture the neckline with decisive volume.
🌎 Fundamentals Right Now
- 💵 **Price context**: Front‑month CBOT soybeans are trading near **1110–1115¢/bu**, softer on the day but still above the autumn lows, mirroring a market that has bounced but is struggling to sustain a trend.
- 🇺🇸 **U.S. balance sheet**: USDA’s latest outlook keeps **2025/26 U.S. ending stocks near 290 mbu**, tight versus recent years, but expectations for the December WASDE lean toward only minor tweaks, not a shock.
- 🌐 **World stocks & demand**: Global 2024/25 soybean ending stocks are projected around **123 MMT**, while U.S. export sales and inspections trail last year, diluting the bullish impact of tighter U.S. carryout.
## 🇧🇷 South America & Weather Risk
- 🌱 **Brazil crop**: Brazil’s 2025/26 soybean crop is still forecast near a **record 175–178 MMT**, but planting has faced a messy mix of **excess rains in central areas** and ongoing concerns in parts of the south, keeping weather risk embedded in prices.
- 🔄 **Climate setup**: Forecasters flag a decent chance of **La Niña‑style patterns** later in the season, which often raise dryness risk in southern Brazil and Argentina and could pressure yields if conditions worsen.
- 🐉 **China demand**: Chinese buying continues but at a more selective pace, and with U.S. export commitments still lagging last year, rallies are likely to meet selling unless South American weather deteriorates or import demand accelerates meaningfully.
Net effect: 🎛️ the market sits in a **range‑trade regime**—technicals lean corrective short term, while fundamentals juggle **record South American potential vs. relatively snug U.S. stocks**, leaving weather and the upcoming WASDE as the key catalysts for any break from the current structure.
Soybeans Surge on Thin Ice: Lessons from 2019Soybean prices have surged nearly 8% in two weeks, driven by renewed US-China trade tensions. While this looks like a familiar, event-driven rally, the fundamentals tell a different story.
Conflicting Weak Fundamentals
China has not purchased any US soybeans for the 2025/26 marketing year. In 2024/25, Chinese buying stalled after May. That’s unusual given that the prior year saw over 500,000 tons of late-season sales. The slowdown dropped China’s share of total US soybean commitments to 45% from 55%, the lowest since 2018.
Source – Reuters
That matters because 2018 marked the last time soybeans became a trade weapon. Back then, US soybean exports fell 18% from 2017/18 to 2018/19 despite record production. Exports recovered briefly in 2020-21 but have since declined again. If history rhymes, the 2025 conflict could have longer-term consequences for US producers and exporters.
The puzzle is that prices have climbed despite worsening fundamentals. Futures rose after the latest escalation, hinting that traders may be pricing in an eventual resolution. If tensions ease before the seasonal export peak over the next two months, demand could lift prices further. If not, the current rally may prove unsustainable. The key uncertainty lies in timing - whether a diplomatic thaw comes soon enough to coincide with US export strength.
Source – Kansas City Fed
Performance and Parallels with 2019
The structure of this year’s rally mirrors the 2019 pattern. Then, too, optimism around US-China negotiations drove soybean futures higher. On 13 December 2019, as the Phase-One trade deal was announced, CBOT soybean futures rallied about 9.8% for the month. That uptrend persisted until the onset of COVID-19, which derailed demand and disrupted logistics, preventing the expected rebound in US exports.
The technical setup also echoes that period. In both 2019 and 2025, the Relative Strength Index (RSI) crossed into overbought territory above 70-a rare signal under normal conditions. Between 2020 and 2022, RSI readings were inflated by one-off global shocks. In contrast, the 2019 and 2025 spikes both stem from optimism around de-escalation, underscoring how trade détente tends to trigger strong momentum buying.
Today, market sentiment again hinges on reports that China may resume US soybean purchases. Investors are reacting to statements and commentary including remarks from industry figures suggesting Beijing could pivot back toward US supply as signs that tariffs or import restrictions may soften. If these expectations materialize, the rally could extend into early 2026, though the fundamental picture remains weak.
Historical Trade Example
To illustrate how optimism-driven price spikes have historically translated into trade outcomes, consider the 2019 example.
A trader buying one CBOT soybean futures contract (5,000 bushels) at $8.70 per bushel in early December and exiting at $9.50 in early January would have captured a 9% gain.
Entry: 870 cents/bushel
Exit: 950 cents/bushel
Profit/Loss: 80 cents/bushel = USD 0.8/bushel
Each contract of Soybean futures provides exposure to 5000 bushels:
Profit/Loss per Contract = 0.8 x 5000 = USD 4,000
Traders can express the same view using CME Micro Soybean Futures, which provide exposure to one-tenth of the standard contract’s notional value and require lower margin.
The 2025 setup resembles that pattern. If de-escalation signs strengthen into year-end, a similar short-term momentum trade could play out. However, if diplomatic talks stall or China delays purchases, prices could quickly retrace.
The recent rally has also occurred on low trading volume, with limited activity during the upward move and higher volume concentrated near resistance levels. Additionally, the price action around these resistance levels shows long wicks, suggesting a failed breakout and indicating weak momentum.
In essence, this rally is speculative optimism priced into a weak fundamental base. For traders, it is a short-duration opportunity with defined risk: the thesis hinges on improved trade headlines within the next two months. For producers and longer-term investors, the focus should remain on export commitments and Chinese buying patterns rather than short-lived technical surges.
History suggests that while geopolitical relief rallies can deliver sharp gains, they often fade once the narrative loses momentum. The 2025 soybean rally may yet prove another example of that cycle - strong on hope, but fragile on fundamentals.
This content is sponsored.
MARKET DATA
CME Real-time Market Data helps identify trading set-ups and express market views better. If you have futures in your trading portfolio, you can check out on CME Group data plans available that suit your trading needs tradingview.com/cme .
DISCLAIMER
This case study is for educational purposes only and does not constitute investment recommendations or advice. Nor are they used to promote any specific products, or services.
Trading or investment ideas cited here are for illustration only, as an integral part of a case study to demonstrate the fundamental concepts in risk management or trading under the market scenarios being discussed. Please read the FULL DISCLAIMER the link to which is provided in our profile description.
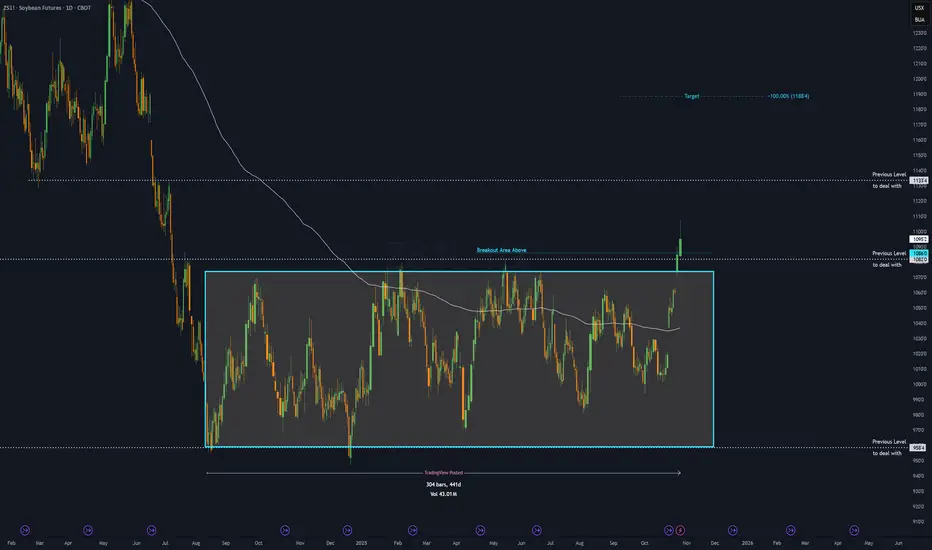
ZS - 14 months RECTANGLE══════════════════════════════
Since 2014, my markets approach is to spot
trading opportunities based solely on the
development of
CLASSICAL CHART PATTERNS
🤝Let’s learn and grow together 🤝
══════════════════════════════
Hello Traders ✌
After a careful consideration I came to the conclusion that:
- it is crucial to be quick in alerting you with all the opportunities I spot and often I don't post a good pattern because I don't have the opportunity to write down a proper didactical comment;
- since my parameters to identify a Classical Pattern and its scenario are very well defined, many of my comments were and would be redundant;
- the information that I think is important is very simple and can easily be understood just by looking at charts;
For these reasons and hoping to give you a better help, I decided to write comments only when something very specific or interesting shows up, otherwise all the information is shown on the chart.
Thank you all for your support
🔎🔎🔎 ALWAYS REMEMBER
"A pattern IS NOT a Pattern until the breakout is completed. Before that moment it is just a bunch of colorful candlesticks on a chart of your watchlist"
═════════════════════════════
⚠ DISCLAIMER ⚠
The content is The Art Of Charting's personal opinion and it is posted purely for educational purpose and therefore it must not be taken as a direct or indirect investing recommendations or advices. Any action taken upon these information is at your own risk.
Soybeans on the RiseSoybean futures have seen a significant upward trend over the past two weeks, largely ignoring the pressure of the U.S. harvest season. This bullish move is not being driven by the fundamentals of crop supply, but almost entirely by political speculation surrounding the high-stakes trade talks between the United States and China.
The Political Catalyst: Hopes for Chinese Demand
The primary fuel for the rally is the highly anticipated meeting this week between U.S. President Donald Trump and Chinese President Xi Jinping. Traders are pricing in the optimistic possibility that the two leaders will announce a breakthrough, specifically a deal that commits China to resuming "substantial" purchases of U.S. soybeans. Since China is the world's largest soybean importer and has been largely absent from the U.S. market, a renewed commitment could instantly boost American export demand and drain the massive supply currently sitting in U.S. storage bins. This speculation is creating a fear of missing out (FOMO) among traders, leading to aggressive buying.
The Market Fog: Lack of USDA Data
Exacerbating the price volatility is the ongoing U.S. government shutdown. With the Department of Agriculture (USDA) unable to release key reports like the Crop Progress and WASDE updates, the market is effectively "flying blind." In this vacuum of reliable data, any headline or rumor about the trade talks holds outsized influence, amplifying the price reaction. This lack of official information is also compounded by U.S. farmers who are holding back their harvested crops, choosing to store their soybeans rather than sell at current prices while they wait for a potential, politically-driven price spike.
What Retail Traders Should Watch Next
The current soybean rally is built on rhetoric, not finalized details. The market is heavily exposed to a single event: the outcome of the U.S.-China meeting.
1. The Deal's Content: If an agreement on large-scale soybean purchases is confirmed, futures could spike higher.
2. The Deal's Failure: Conversely, if the meeting disappoints, is postponed, or fails to produce a clear commitment on agricultural purchases, soybean prices are vulnerable to a sharp, sudden correction.
What's Next for Soybeans?The soybean market over the last four weeks has been volatile, largely driven by a combination of geopolitical tensions, U.S. harvest developments, and South American weather. The market has seen consolidation within a range where it seems to be carving out higher lows and may be on track for prices to rise. The 50-day and 200-day moving average are right in line with each other on this daily chart and the market saw selling pressure from these levels in the recent down move. Futures prices generally remain under pressure from large supply estimates but see spikes and drops based on daily news.
Most recently, prices have seen a sharp downturn, especially heading into the second week of October, with November soybean futures dropping significantly on fears of escalating U.S.-China trade tensions. The ongoing trade war has severely impacted U.S. soybean exports, as China (the world's largest buyer) has largely avoided new crop purchases. News and rhetoric regarding trade talks, including discussions of a potential meeting between the U.S. and Chinese leaders, have caused significant price swings.
The U.S. harvest is underway, and while some initial reports suggested yields slightly below the most recent USDA forecasts, the overall projected supply remains high, which is a bearish factor. However, logistical issues, such as critically low water levels on the Ohio and Mississippi Rivers, are raising concerns about the ability to move the massive crop, potentially firming the cash basis in some areas.
Favorable weather for planting in Brazil and recovery from past drought conditions in Argentina are contributing to the expectation of large future global supplies, which puts long-term pressure on prices. Along with that, a U.S. government shutdown led to a postponement of key reports, such as the USDA's monthly WASDE report, leaving traders with less official information and relying more on private estimates and harvest reports.
*CME Group futures are not suitable for all investors and involve the risk of loss. Copyright © 2023 CME Group Inc.
**All examples in this report are hypothetical interpretations of situations and are used for explanation purposes only. The views in this report reflect solely those of the author and not necessarily those of CME Group or its affiliated institutions. This report and the information herein should not be considered investment advice or the results of actual market experience.
Analysis techniques – Soybean Futures (Nov 2025)Date: 30/09/2025 | Timeframe: D1 | Contract Code: ZSX25
1. Trend Overview and Price Structure
Soybean futures (Nov 2025) remain under pressure after failing to hold the 10,500 resistance. Prices are trading below 10,200 and are testing the psychological 10,000 level, with risks of retesting the 9,790 support. The dominant trend remains bearish.
2. Key Technical Levels
Resistance: 10,160 – 10,500 – 10,750
Support: 10,000 – 9,790 – 9,610
3. Detailed Technical Analysis
Short-term trend: The bearish momentum persists, with consecutive red candles confirming seller dominance.
Trading volume: No major spikes, but sellers remain in control.
Wave structure: A new bearish wave is unfolding, with 9,790 as the immediate target.
Confirmation signals: A recovery above 10,160 is needed to invalidate the bearish outlook.
4. VNC Intelligence Strategic View
With the U.S. 2025 harvest nearing completion and expectations for strong yields, supply pressure remains elevated. Meanwhile, slower Chinese demand adds to the bearish tone. Only unexpected weather disruptions or acreage cuts in 2026 planting could shift sentiment back to bullish.
5. Suggested Technical Strategies
Primary Short Setup:
Entry: 10,050 – 10,100
TP: 9,790
SL: 10,220
Probability: 65%
Counter-trend Long Setup:
Entry: 9,790 – 9,810
TP: 10,050
SL: 9,610
Probability: 50%
6. Corporate Hedging Guidance
Importers may consider gradual buying around 9,800 – 9,790 to secure costs, while U.S. farmers are advised to lock in partial sales near 10,100 – 10,200 to protect margins amid a prevailing bearish environment.