When a Record Crop Isn't Bearish
Every month, the USDA's World Agricultural Supply and Demand Estimates report does one thing: balance a ledger. On one side sits total supply (what was left over from last year, what this year's harvest produced, and what was imported). On the other side sits total use (what processors crushed, what was exported, and what remains at the end of the marketing year as ending stocks).
That final number, ending stocks, and the ratio it forms against total use (the stocks-to-use ratio, a measure of
In-depth trading ideas
Soybeans: three weeks of topping, short below 1300Soybeans rallied from the 1165 August low to 1335'2 in mid September, about 15% in five weeks. Then the market stalled. For three weeks it went sideways between roughly 1295 and 1335, with three failed pushes at the highs. Today's wide range down bar broke through the floor of that box, and the daily swing chart has turned down.
Plan
Entry: 1299'0, on the break of the range floor. The trade is live.
Stop: 1335'2, above the triple top and the contract high.
First profit taking: one third of the
ZS1! (Soybean Futures) – Daily – 9/17/26ZS1! (Soybean Futures) – Daily – 9/17/26
Setup: Short entered @ 1319, SL @ 1364 (risk ~45c)
Thesis: Momentum fade within an otherwise intact uptrend —
this is a counter-trend/exhaustion trade.
Bullish structure still intact (the risk to this short):
- Ascending channel since ~Apr/May '26, price stalled near
upper 1/8 of channel (~13.20-13.31 high)
- ADX 37.3 with +DI 26.9 > -DI 10.1 → primary trend is still
strong and bullish by this measure — this is the main thing
that could stop
ZS1!China is expected to purchase 12 million metric tons of soybeans from the United States, following the meeting in South Korea that took place several months ago. After Trump’s statements, the markets surged sharply, but I believe China has not made—and will not make—any public statements on the matter, as that would drive prices higher, which is counterproductive if they intend to carry out a massive purchase.
I’ve noticed that the main dairy monopolies in China are showing chart formations tha
Soybeans — Producer hedging caps this. What if it doesn't?Producer hedges in soybeans are sitting above 600K contracts right now. That level usually tracks price down.
But if it doesn't this time — price just keeps grinding to fresh highs anyway.
Back in 2020 something similar happened. Hedging was heavy, and price broke higher regardless. What was actually driving it wasn't really a mystery though — China came back into the market in size on the back of the trade deal that year, and a stretch of storms and dry weather on top of that gave it extra fu
Will Super El Niño Reshape Soybean Futures?Global weather concerns and insatiable Chinese demand rapidly spike corn, wheat, and soybean prices. Meteorologists from DW News confirm that a historically strong El Niño pattern will disrupt global agriculture. The United Nations warns that climate change exacerbates these erratic weather events. Consequently, economists predict a severe shock to global food prices lasting well into 2028. Investors must understand how these environmental catalysts drive soybean futures across multiple sectors.
SOYBEANS Short SignalSoybeans MTF Conf2.0 Short Idea. I don't trade soybeans, so I will not be trading this, but I thought I would share the TDA
Technicals:
Price inside Monthly supply + Daly confirmation 2.0.
Fundamentals/Sentiment:
COT short correlation by banks/insitutions adding into shorts and closing longs.
No idea on fundamentals/crop report.
Overall:
Valid to short straight up inside supply OR wait for 30min/1hr/4hr confirmation.
SOYBEAN FUTURES DXY & REAL YIELD IMPLICATIONS
DXY 100.90, real yield 2.255% — both still restrictive for the broader commodity complex (BCOM 125.72). Hawkish Warsh Fed is a structural headwind, but soybean's demand-side story (crush/biodiesel) is currently strong enough to decouple from the DXY-driven bearish macro pressuring metals — similar decoupling dynamic to the wheat fertilizer/Iran narrative flagged earlier this week.
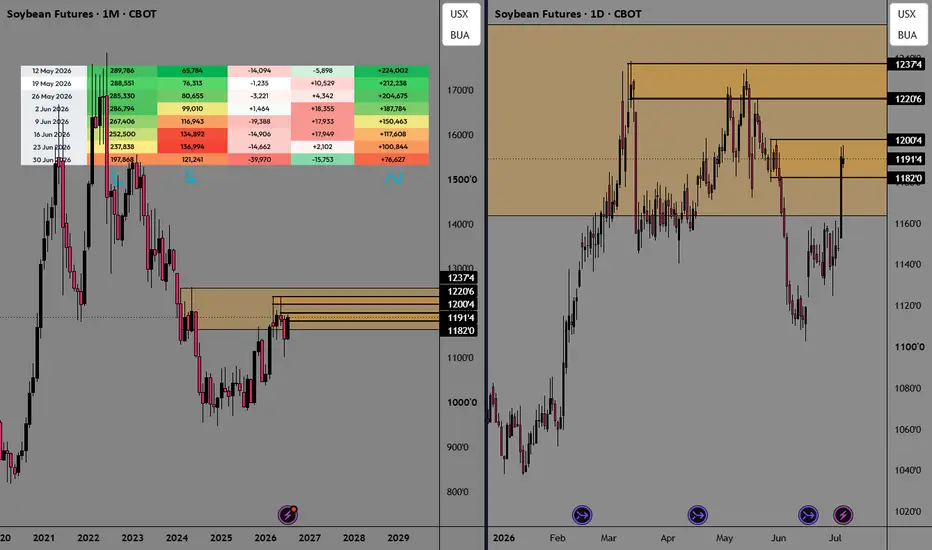
SOYBEAN Futures ...Up dateCommercials became materially more bullish.
Funds became materially more bearish.
Price stopped falling.
That divergence is often seen near important turning points.
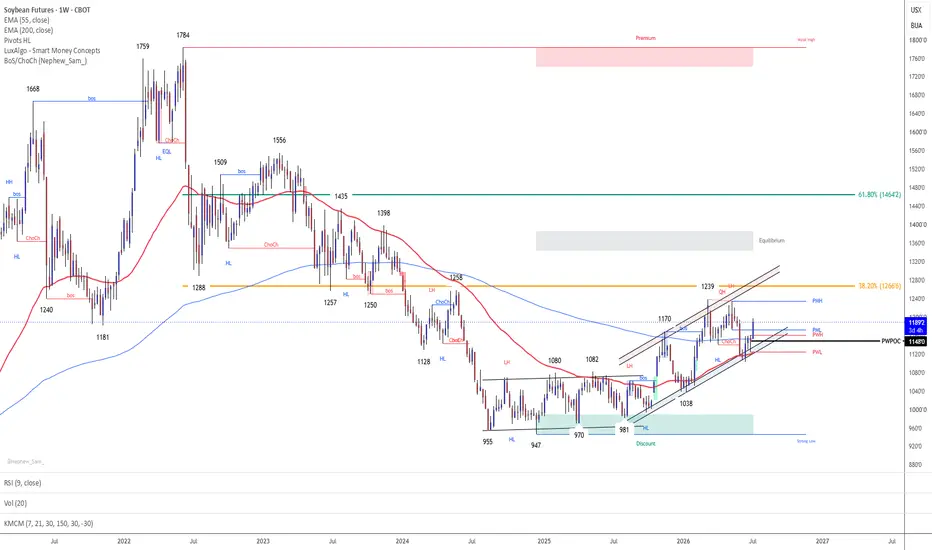
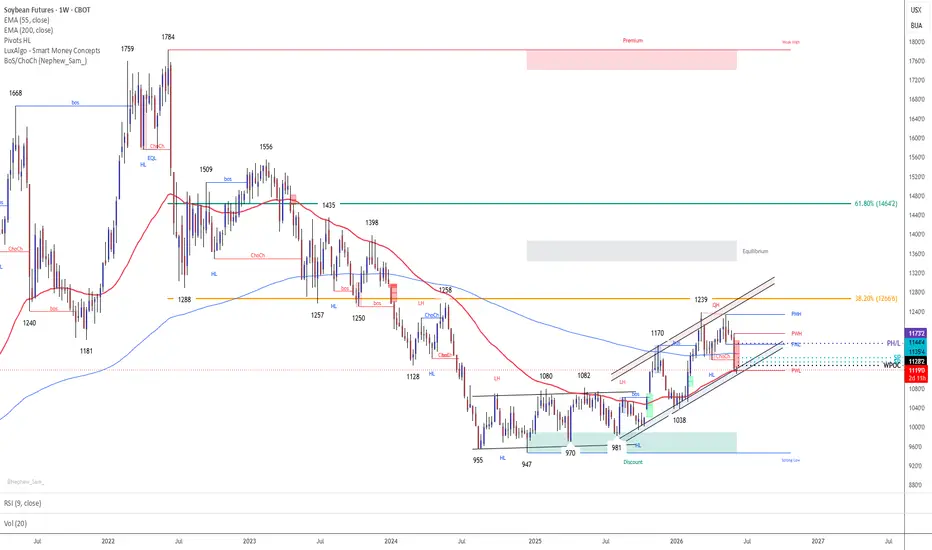
The 1102–1117 zone now looks increasingly like a potential Wyckoff Spring/Test area, while 1170 remains the key BOS level. A daily and weekly close above 1170 would significantly strengthen the case that the decline from 1235 was corrective rather than the start of a larger bear market.
Critical Levels This Week
Support: 1115 → 1
SOYBEAN FUTURES ....SOYBEAN FUTURES –
Price: 1117.0
Weekly 55 EMA: 1116.0
Weekly 200 EMA: 1152.0
DXY: 99.87
US 10Y Real Yield: 2.198%
Bloomberg Commodity Index: 130.48
The macro environment has become significantly less supportive for grains than a month ago:
Headwinds
DXY approaching 100.00
Real Yield back near 2.20%
Bloomberg Commodity Index falling sharply from 138.96 → 130.48
Managed Money reducing longs and aggressively adding shorts.....This is a classic risk-off commodity environment.
#soybeans #zs1! #commoditytrading #cme #wasde I. COT Structure & Fund Flows: Paper Speculation vs. Commercial Accumulation
To understand why CBOT Soybeans (ZS) futures have trended lower despite structural physical tightness, one must analyze the divergence between paper positioning and physical commercial behavior (Data as of June 2, 2026):
• Paper Bears in Overdrive (Managed Money): The recent downward momentum is entirely driven by systematic and algorithmic. Managed Money (MM) has aggressively liquidated long exposures down to 218,597 l
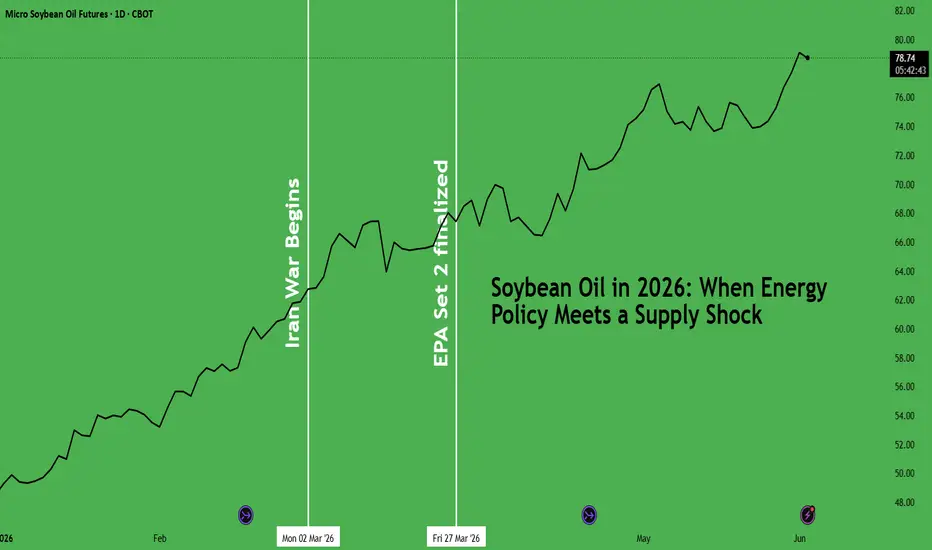
Soybean Oil in 2026: When Energy Policy Meets a Supply ShockSoybean oil is up 62.6% year-to-date in 2026. Soybean oil is an agricultural commodity derived from soybeans. It is widely used in cooking, food processing, and as an industrial input. But the Soybean Oil story is now dominated by biodiesel as increasing quantities of the edible oil are redirected towards energy.
This paper delves into Soybean Oil’s energy story with historical examples of how these cycles usually play out.
Soybean Oil and Energy
When crude rises, conventional diesel becom
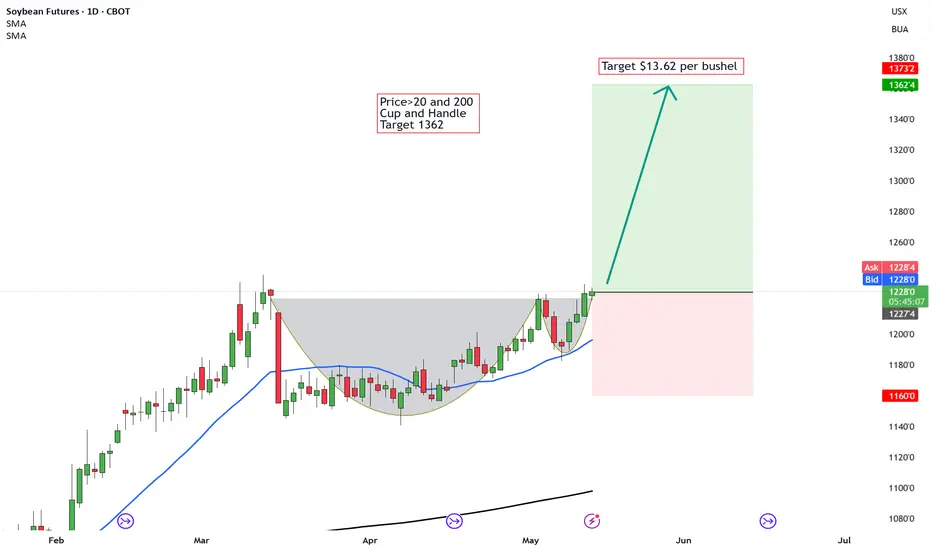
SOYBEANS - The unspoken market that is set to soarSoybeans are beginning to show renewed bullish momentum as weather risks, global food demand and biofuel trends continue supporting agricultural commodities.
Technically, the market is breaking higher from a strong continuation structure while remaining above key moving averages.
Agricultural markets can move aggressively when supply concerns and technical momentum align together.
🌍 Fundamentals
Global Food Demand
Soybeans remain one of the world’s most important food and animal feed co
ZS Long — $ZSN26 pullback into 1200-1202 support after flushing Setup: The 4h chart shows ZS bottomed near 1165 in mid-March and carved a higher-low structure through April, culminating in a sharp impulse leg from 1175 to 1226 into May 4. After that peak the contract sold off hard over May 5-6 with elevated volume — a distribution flush that ran from 1226 down to the 1183-1185 zone. Price has since bounced and is currently reclaiming the 1200-1202 shelf, which served as consolidation support during the late-April ramp. The 1h chart shows the bounce off 1183
Global Supply, China Demand, and the Soybean OutlookGlobal Flows, Policy Risk, and the Headlines Driving ZS
Soybeans futures trade under the ticker ZS and represent one of the most globally interconnected agricultural contracts. Price is primarily influenced by United States acreage and yield expectations, South American production, export demand from China, currency movements, biofuel policy, and freight dynamics along major river systems.
The most important recurring reports for traders include the United States Department of Agriculture Wor
Neckline Breaks and Trader Nerves: A Quick Guide to Bearish H&S The head and shoulders pattern is like the market’s way of clearing its throat and saying, “Things might be changing up here.” Once that neckline snaps, traders often sit up straighter — not because something magical happened, but because the chart finally drew a clean line between “maybe” and “now it matters.”
In this ZS (Soybean Futures) example, price slipped under the neckline and started wandering toward lower ground. Traders who work with this pattern usually focus on three things:
A p
From Neckline to Target: Setting H&S Bearish Entries and ExitsUnderstanding the Head & Shoulders Breakdown
A bearish head and shoulders pattern gives traders a structured way to define entries and exits using price geometry rather than emotion. The pattern forms when a market transitions from strength to distribution, creating a left shoulder, a higher head, and then a lower right shoulder as momentum begins to fade. The neckline acts as the key support level that separates a developing pattern from a completed one.
In the case study illustrated on the
CBOT Soybean Technicals and Fundamentals (ZS1!) - Dec 05, 2025Soybeans remain in a corrective phase after confirming a short‑term top, with price likely to probe lower supports unless weather or WASDE headlines flip the sentiment.
🟤 CBOT Soybean Technicals (ZS1!)
- 🧱 **Pattern**: A clear **Head & Shoulders** has formed on the daily chart, with price breaking down toward the neckline zone around **1105–1100¢**, right on a key high‑volume node and 0.382–0.5 retracement of the October–November rally.
- 📉 **Downside levels**: Next supports sit near **1078¢**
Soybeans Surge on Thin Ice: Lessons from 2019Soybean prices have surged nearly 8% in two weeks, driven by renewed US-China trade tensions. While this looks like a familiar, event-driven rally, the fundamentals tell a different story.
Conflicting Weak Fundamentals
China has not purchased any US soybeans for the 2025/26 marketing year. In 2024/25, Chinese buying stalled after May. That’s unusual given that the prior year saw over 500,000 tons of late-season sales. The slowdown dropped China’s share of total US soybean commitments t
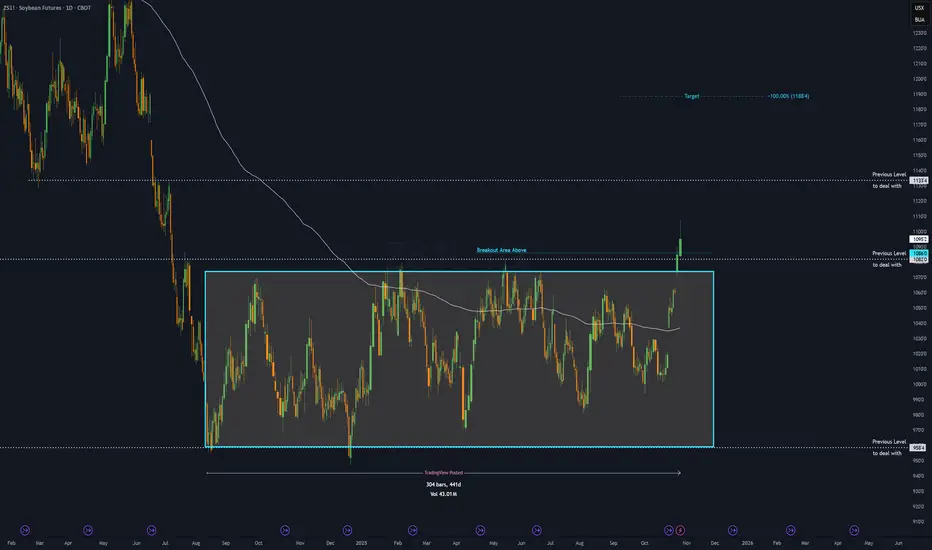
ZS - 14 months RECTANGLE══════════════════════════════
Since 2014, my markets approach is to spot
trading opportunities based solely on the
development of
CLASSICAL CHART PATTERNS
🤝Let’s learn and grow together 🤝
══════════════════════════════
Hello Traders ✌
After a careful consideration I came to the conclusion that:
- it is crucial to be quick in alerting you with all the opportunities I spot and often I don't post a good pattern because I don't have the opportunity to write down a proper didactical comment;
- sin
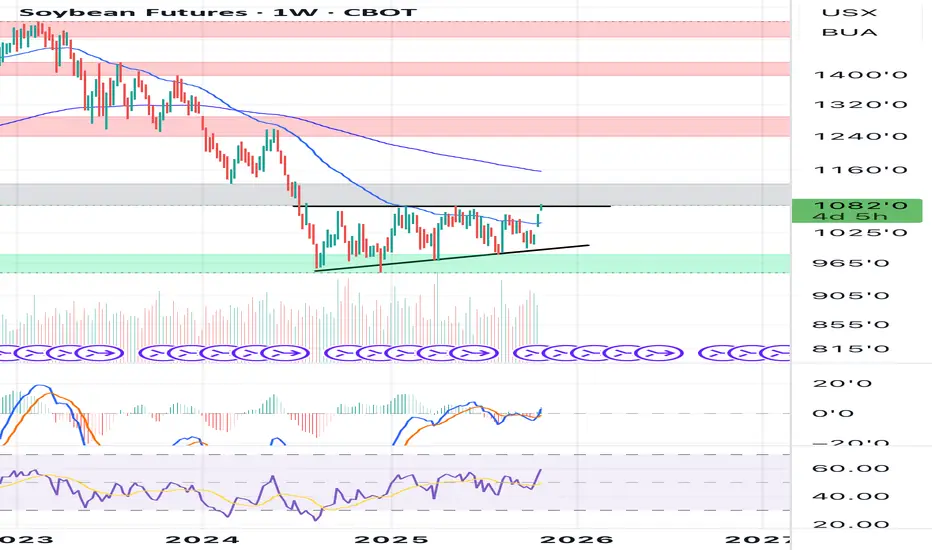
Soybeans on the RiseSoybean futures have seen a significant upward trend over the past two weeks, largely ignoring the pressure of the U.S. harvest season. This bullish move is not being driven by the fundamentals of crop supply, but almost entirely by political speculation surrounding the high-stakes trade talks between the United States and China.
The Political Catalyst: Hopes for Chinese Demand
The primary fuel for the rally is the highly anticipated meeting this week between U.S. President Donald Trump and