Wheat: LRC 400% at 666.25 lost, short againI closed my first wheat short at 673'6 when the breakdown below 681.75 stalled on 666.25, the quarterly LRC 400% level. That level held for a week of small bars, with every dip bought. Today it gave way: price is trading at 660'6, below 666.25 and below the lows of that whole pause.
The structure b
Peers for comparison
Contract highlights
Wheat Futures : Major Support Breakdown And Retest Bearish SetupExecutive Summary
The 4-hour chart for CBOT Wheat Futures presents a high-probability bearish continuation setup following a decisive structural breakdown below a major multi-week ascending trendline and the critical 680'0 support level. Price has completed a retest of this former support zone, whi
Wheat: HRC 1/2 at 681.75 lost, shortWheat ran from the 626'6 August low to 795'0 at the start of September, a 27% rally in four weeks. It has been stepping down ever since. The first leg lost the 719.43 zone, the strongest S/R model level in this area (clustered swing pivots going back to 1969), and that zone then capped every bounce
CBOT Wheat — Pullback Holds Support, Next Leg Higher in FocusWheat continues to behave beautifully from a technical standpoint.
We recently saw price fail almost exactly at the Fibonacci extension at 792. Since then, the pullback has retraced straight back to the first level of support at 711 — the July 2026 high — and that prior resistance is now acting as
Incremental analysis of wheatWheat remains structurally bullish.
Strong liquidity inflows, highlighted by the rising volume profile, support further upside toward the previous record high. Renewed Black Sea disruptions, Russia–Ukraine tensions, tighter U.S. wheat supply, and adverse weather risks are reinforcing the bullish fun
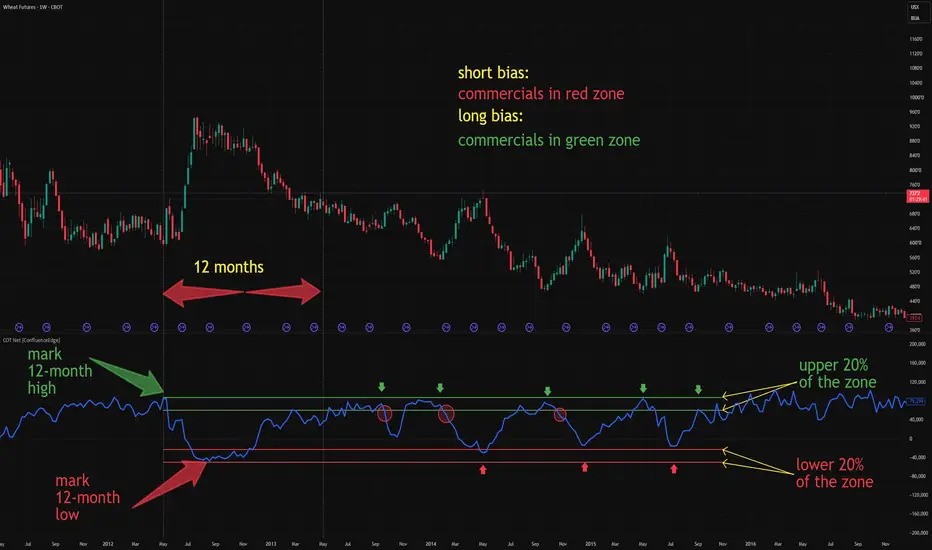
COT 101 · Lesson 05 — Net Positioning Extremes🔵 WHAT "EXTREME" MEANS
A net position is extreme when it sits at the edge of its own history — the highest or lowest reading in 6, 12, or 24 months. Not "high", not "low": the outer band of what this market has actually seen. The next lesson gives this a precise number.
🔵 WHY WHEAT
The earlier
Chart of the Week: CBOT Wheat FuturesWheat has been one of the standout movers of 2026, trending sharply higher for most of the year — and the past six weeks have brought a marked acceleration to the upside.
Notably, this week's high landed almost exactly on one of our Fibonacci extensions at 792/bushel — the 1.618 extension of the m
Grain Under Fire: What Wheat Is (And Isn't) Pricing InWheat has surged 30.8% since June 30, breaking out to trade above its May 2024 high for the first time. Following an initial rally in July, prices spent most of August consolidating. A sharp single-session spike late in the month reignited the upward trend, driven by escalating Black Sea disruption
Can Wheat Futures Trigger a Global Crisis?Geopolitics, Geostrategy, and Macroeconomics
Chicago wheat futures recently surged to three-year highs near $7.70 per bushel. Intensifying warfare in the Black Sea region directly threatens critical grain export terminals. Russia and Ukraine historically supply over twenty-five percent of global wh
ZW1! 1H: Descending Channel Breakout & Resistance Reclaim1. Market Context
On the 1H chart, Wheat Futures (ZW1!) broke out above the purple descending channel. Price bounced strongly off the "Buyer" base and is currently pressing against the key horizontal resistance at 656'2.
2. Trader Behavior & House Trap Analysis
• Where Traders Place Orders: Seeing
See all ideas
A representation of what an asset is worth today and what the market thinks it will be worth in the future.
Displays a symbol's price movements over previous years to identify recurring trends.
Frequently asked questions
One way to gain exposure to ZWN2021 is through a broker that offers futures. Before trading, make sure you understand how the product works and the risks involved.
You can trade ZWN2021 directly from TradingView:
– Choose a broker: Explore our supported trading partners and pick one that fits your needs
– Compare options: View available brokers side by side to evaluate fees and features
– Connect your account: Open Supercharts, click "Trade", select your broker, and log in
– Start trading: Place orders directly from the chart
Tip: If you're new to trading, try paper trading first — it lets you practice strategies in real market conditions without risking funds.
You can trade ZWN2021 directly from TradingView:
– Choose a broker: Explore our supported trading partners and pick one that fits your needs
– Compare options: View available brokers side by side to evaluate fees and features
– Connect your account: Open Supercharts, click "Trade", select your broker, and log in
– Start trading: Place orders directly from the chart
Tip: If you're new to trading, try paper trading first — it lets you practice strategies in real market conditions without risking funds.
The nearest expiration date for ZWN2021 is Jul 14, 2021.
Futures contracts expire on predetermined dates. As expiration approaches, many traders roll positions into the next contract to maintain exposure to the market.
Key metrics to watch near expiration:
• Volume and liquidity: Trading activity often shifts to the next contract month
• Open interest: Falling open interest may signal positions being closed or rolled forward
• Forward curve: Differences between contract prices can help identify market structure, including contango and backwardation
Explore the ZWN2021 chart to monitor active contracts and contract-month activity.
Futures contracts expire on predetermined dates. As expiration approaches, many traders roll positions into the next contract to maintain exposure to the market.
Key metrics to watch near expiration:
• Volume and liquidity: Trading activity often shifts to the next contract month
• Open interest: Falling open interest may signal positions being closed or rolled forward
• Forward curve: Differences between contract prices can help identify market structure, including contango and backwardation
Explore the ZWN2021 chart to monitor active contracts and contract-month activity.