BTC1! Bullish Fib Zone Retest: Bulls Defend 62,520Setup: Bitcoin CME futures on the daily chart. Bulls stepped in at the 62,520 area on August 17 and pushed price all the way to the external high at 87,825, printing a bullish CHoCH at 82,215 along the way. After taking profit at the high, price pulled back and has now filled the imbalance from 61,190 to 69,100. That whole fill happened inside the Fib zone, and price wicked into the 62,520 key level. The bulls may be returning to the scene.
Key levels:
External high: 87,825
Bullish CHoCH: 82,2
In-depth trading ideas
BTCUSD: The Calm Before Another Sell-Off?In my view, BTCUSD remains firmly bearish in the short term , as neither the macroeconomic backdrop nor the current technical structure provides sufficient support for a sustained recovery.
From a fundamental perspective, the Fed's hawkish stance, a stronger US dollar, and weakening inflows into Bitcoin ETFs continue to weigh on the cryptocurrency market. Meanwhile, concerns over potential regulatory tightening in the US are keeping investors cautious toward risk assets, further limiting Bit
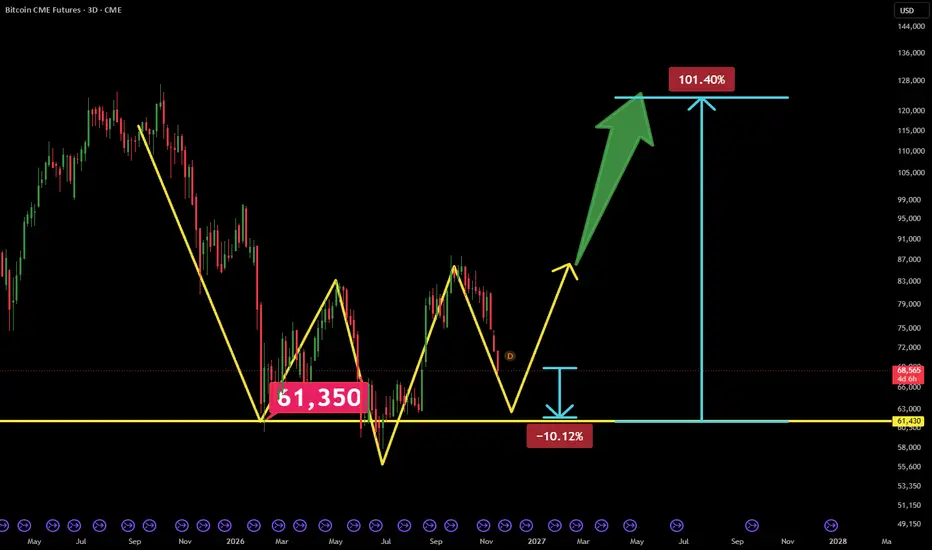
Bitcoin (BTC): One Final 10% Drop Before a 100% Rally? Bitcoin (BTC) could experience one final 10% decline before initiating a powerful bullish reversal, potentially delivering a 100% rally from its final bottom.
From a technical perspective, this scenario would involve the formation of an Inverse Head and Shoulders (IH&S) pattern, a classic bullish reversal structure.
The final 10% correction could establish the right shoulder, completing the accumulation phase. Once BTC breaks above the neckline with strong trading volume, the pattern would be
Bitcoin is About to Die?Months ago we spotted the daily Head and Shoulders pattern forming, and more recently we shifted focus to the much larger weekly Head and Shoulders structure.
Right now, CRYPTOCAP:BTC is testing a massive floor where two major support levels meet in the exact same spot: the pattern neckline and the upward trendline from 2023 around $64k to $65k.
What makes this move so dangerous is what is happening under the hood. Even with this drop, weekly RSI is not even oversold yet, meaning sellers sti
Bitcoin (BTC): Long-Term Growth & 5X Trade-Numbers (PP: 450%)For all of my CME traders, I have something awesome ready for you. Full confirmation of a bull market on Bitcoin, long-term growth. I am also sharing for your convenience the full trade-numbers below.
Strategy: This is a very easy buy and hold, just let it grow. The market is set to grow long-term. The bear market is already over, we will never see Bitcoin moving below $60,000 again.
_____
LONG BTCUSDT
Leverage: 5X
Potential: 450%
Allocation: 10%
Entry zone: $58,000 - $64,100
Targets:
1
BTCUSD – Selling Pressure Builds as Bitcoin Eyes $70,000Bitcoin continues to face pressure from both macroeconomic and technical factors, making a sustained recovery increasingly difficult. With risk aversion rising and key support levels coming under pressure, I still favor a bearish move toward $70,000.
According to Reuters on November 9, Bitcoin fell to $73,708, its lowest level since August, amid concerns that a Democrat-controlled U.S. Congress could introduce stricter cryptocurrency regulations. Meanwhile, the reported $6 billion Binance hack
Bitcoin CME | Is Wave IV Still Developing?Reading time: Approximately 3 minutes
Following my previous weekly analysis, I’m taking a closer look at Bitcoin’s larger-degree structure through the daily CME futures chart.
In the current count, the advance toward approximately $126,000 marks the completion of Wave III. The market may now be developing Wave IV. The main question is whether this correction is taking a sideways form or preparing for a deeper decline.
Why Keep the Current Count in Focus?
One important guideline in Elliott Wa
S&P 500, US 10Y and Bitcoin: the levels that matter ....After a week of big moves, a chart is the best way to cut through the noise. In periods of uncertainty, markets tend to mean-revert to their long-term moving averages, and over many years I’ve found the 55-week and 200-week MAs to be the most reliable of these.
S&P 500 (SPX), daily and weekly
Breaking the 7507 low confirms a near-term top.
Near-term support: 200-day MA at 7325, then the June low at 7237.
Key level: the 55-week MA at 7195. I suspect this is where we head, and price action there
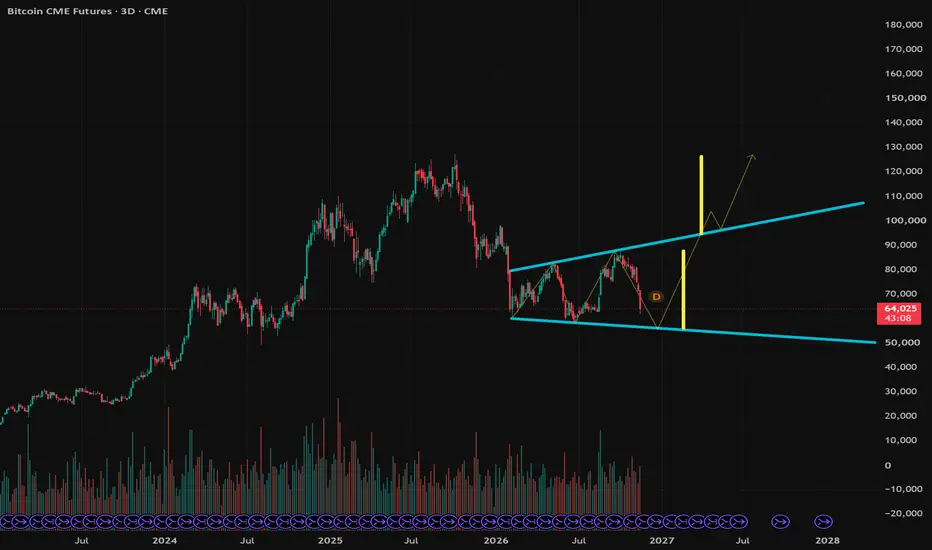
$BTC Megaphone BottomOne possible bottom formation could be a symmetrical broadening formation, or Megaphone patter.
If it plays out, expect a bottom in the low- to mid-50K region for Bitcoin, then a 1Q27 breakout to new local highs, before revisiting prior ATH of $127K in 2H27.
The pattern is slightly better than a coin flip. Technical target is prior ATH.
Bitcoin rebounds from $62,000 after a bruising weekend
Bitcoin fell to around $62,000 on November 15 before recovering to about $64,800 early Monday. The weekend selloff extended last week’s decline as expectations of higher US interest rates and renewed volatility in AI-linked stocks weighed on risk appetite.
The dollar remained firm as traders priced in a Federal Reserve rate increase in December. US consumer prices rose 0.4% month on month in October against a 0.3% forecast, while core inflation came in at 0.3% against expectations of 0.2%. Oc
BTC futures at a decision point after a sharp four-day declineBTC futures have fallen from roughly 75,000 into the high-67,000 area, leaving price below a sequence of lower highs.
The first area to watch is 66,800–67,300, where the latest selloff is trying to stabilize. A reclaim of 69,200–70,000 would be the first evidence that momentum is improving. A sustained break below 66,800 would keep the bearish structure intact.
Bullish scenario: price holds the current support area and reclaims 69,200, opening room toward 70,000 and the prior breakdown zone.
BTC1! - Why complicate things? (Nov 2026 edition)Went short Thursday Nov 5, there's the stop as of now... sizing is KEY, but not for thee..... not here anyway :-)
When you start trading a proven system, you stop worry about the utter nonsense that prevents most traders from winning....
When stops need to be moved, I'll update here.
And yes all of my public posts are delayed for a reason. Ask why or think harder :-)
**note** in the chart above you see all of the trades we've done in 2026. The trade previous to the current one was a short-fo
Bitcoin and Ether Facing a Massive Line in the SandBoth Bitcoin and Ether are flashing major warning signs on the weekly charts, and zooming out to the monthly view shows the exact same breakdown risk.
Bitcoin
On CRYPTOCAP:BTC , a massive Head and Shoulders pattern has formed over the past couple of years. Price is dropping straight toward the neckline floor, which lines up directly with the 2023 upward trendline around $64k to $65k. When two major support lines meet at the exact same spot, that level becomes a true line in the sand. If CRYPT
BTC/USD – Liquidity Sweep & Bullish Reversal Setup | 15MBTC/USD is showing signs of a potential bullish reversal after taking liquidity below the recent swing low.
Following multiple bearish Breaks of Structure (BOS), price appears to be stabilizing around the 76,350 level. The recent liquidity sweep and price reaction suggest a possible shift in short-term market momentum.
**Trade Setup:**
- **Pair:** BTC/USD (Bybit Futures)
- **Timeframe:** 15-Minute (15M)
- **Direction:** BUY / LONG 🟢
- **Entry:** 76,350.0
- **Stop Loss (SL):** 75,466.5
- **Fina
CCI system monthly: major indexes, ME, UGL, BTCSimilar to the weekly and the daily. Not much to buy here but there are support levels to target for entries. Fear Greed index creeping south, I think it gets into the low teens and perhaps single digits as the crims load up the truck with inventory. If not, that read regarding a similar look to the .com bubble turns more realistic and I have to figure out if I want to be a shorter or not. Prolly not. I do not like the idea of unlimited risk.
How CME Bitcoin Futures Address Structural Risk in Crypto MarketCME Micro Bitcoin futures ( CME:MBT1! )
CME Micro Bitcoin futures (MBTZ6) closed the week near 78,160, up 1.55% on the day but still well below the September–October highs. Year-to-date, MBT is down 12%, comparing to CME Micro E-Mini Nasdaq 100 futures (MNQZ6), up 12% YTD.
The year-to-date chart between micro BTC futures and Micro Nasdaq-100 futures shows three distinct sharp declines in Bitcoin. The first two were idiosyncratic; the third was not.
In the early part of the year, CME Bitcoin
MBT Micro Bitcoin Futures: Key Levels After the Binance HackBitcoin has had a rough month. As of October 30, 2026, Bitcoin was down about 7% for October, its weakest October since at least 2016. Over the same period the S&P 500 lost 0.9%, the Nasdaq Composite lost 5.3%, and gold fell about 7%, while the Dow gained 1.7%. In the week ended October 30, Bitcoin fell about 5.4% and Ether fell about 6.2%, so Ether lagged.
Two developments drove the latest leg lower. First, the Federal Reserve held its policy rate at 3.75% to 4.00% on October 28 in a 10 to 2 v
Update: BTC possible wave C Since 6 June postings, BTC has displayed the completion of an irregular wave b to be followed by wave c which probably head towards the blue rectangle range as an objective owing to clustering of support possibilities.
Noticeable the rally of wave b ended below the head and shoulder neckline with resistance for the second time further fortify the idea of an impending downturn.
MACD is into the negative territory and with the crossing of the signal line augment a higher probability for the downsi
Bitcoin Weekly: Why 11 Trades Were Not EnoughA weekly CME Bitcoin futures test showed net $561,634.50 and a profit factor of 7.571 on one fixed full-size contract after its stated costs. The replay reproduced all eleven closed trades. There was no discovered gap or dual-touch error that reversed those eleven outcomes.
That is exactly why this case matters. Eleven trades are still only eleven observed market episodes, and just five were in the held-back segment. Resampling the same outcomes or trying nearby parameter settings cannot create
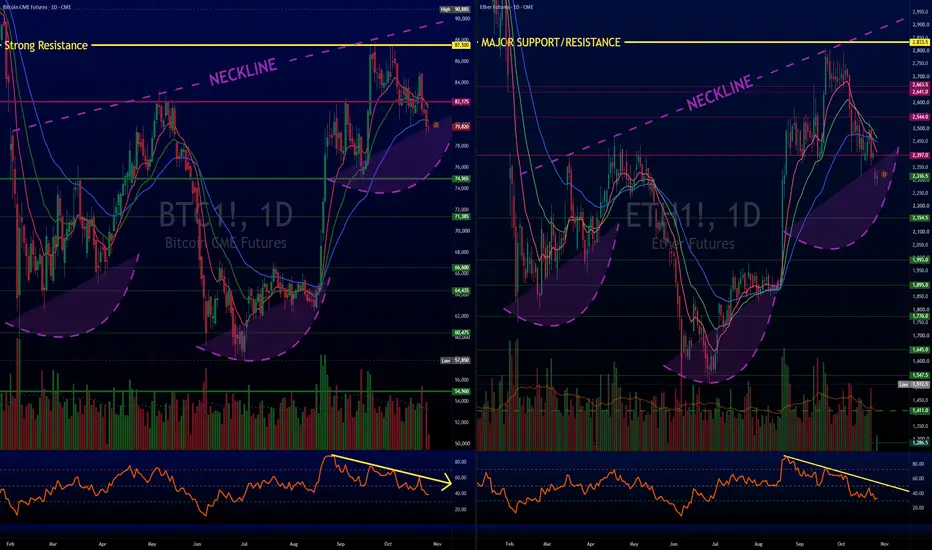
$BTC & $ETH: The Major Ceiling TestTake a step back from the daily chop and look at the bigger picture. We often talk about bottoming setups, but real market patterns are rarely neat and pretty. What matters is where real buying pressure shows up and where sellers run out of room.
Right now, both Bitcoin and Ether futures look like they are forming a giant bottom base that stretches all the way back to early this year.
The Three Step Bottom
The Left Base: The chop between February and April.
The Deep Flush: The big summer dro
BTC: Dip First, Then 90KBitcoin CME Futures (1D)
The higher time frame structure is bullish. Short term, I see two possible paths, and both lead to 90K.
Scenario 1 (primary): shallow pullback
Price pulls back into the 78,600 – 79,825 zone, where several VWAPs and support levels converge.
A bounce from this zone confirms buyers are defending it, and the move toward 90K begins from there.
Scenario 2: deeper sweep
Price drops to 74,780 and takes the stop losses sitting below the recent major low.
A fast reclaim after
Bitcoin's CME gaps: 96% filled, 14 are still open"CME gaps always fill" is one of crypto's most repeated lines. CME's Bitcoin futures used to close for the weekend while Bitcoin kept trading, so Monday often opened away from Friday's close: a gap. We counted every one.
What we measured
CME's Bitcoin futures (the front month on TradingView), daily sessions from December 2017 to May 2026. A gap is the Sunday evening open against Friday's close. We left out the weekend after each month's last Friday, when the contract rolls and the jump is ju