BTC1! Bullish Fib Zone Retest: Bulls Defend 62,520Setup: Bitcoin CME futures on the daily chart. Bulls stepped in at the 62,520 area on August 17 and pushed price all the way to the external high at 87,825, printing a bullish CHoCH at 82,215 along the way. After taking profit at the high, price pulled back and has now filled the imbalance from 61,1
Peers for comparison
BTCUSD: The Calm Before Another Sell-Off?In my view, BTCUSD remains firmly bearish in the short term , as neither the macroeconomic backdrop nor the current technical structure provides sufficient support for a sustained recovery.
From a fundamental perspective, the Fed's hawkish stance, a stronger US dollar, and weakening inflows into
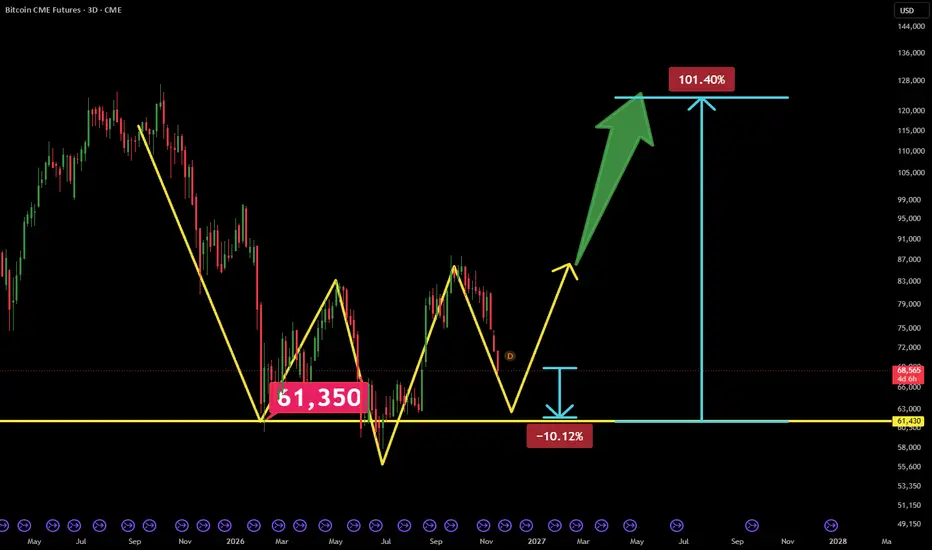
Bitcoin (BTC): One Final 10% Drop Before a 100% Rally? Bitcoin (BTC) could experience one final 10% decline before initiating a powerful bullish reversal, potentially delivering a 100% rally from its final bottom.
From a technical perspective, this scenario would involve the formation of an Inverse Head and Shoulders (IH&S) pattern, a classic bullish r
Bitcoin is About to Die?Months ago we spotted the daily Head and Shoulders pattern forming, and more recently we shifted focus to the much larger weekly Head and Shoulders structure.
Right now, CRYPTOCAP:BTC is testing a massive floor where two major support levels meet in the exact same spot: the pattern neckline and t
Bitcoin (BTC): Long-Term Growth & 5X Trade-Numbers (PP: 450%)For all of my CME traders, I have something awesome ready for you. Full confirmation of a bull market on Bitcoin, long-term growth. I am also sharing for your convenience the full trade-numbers below.
Strategy: This is a very easy buy and hold, just let it grow. The market is set to grow long-term.
BTCUSD – Selling Pressure Builds as Bitcoin Eyes $70,000Bitcoin continues to face pressure from both macroeconomic and technical factors, making a sustained recovery increasingly difficult. With risk aversion rising and key support levels coming under pressure, I still favor a bearish move toward $70,000.
According to Reuters on November 9, Bitcoin fell
Bitcoin CME | Is Wave IV Still Developing?Reading time: Approximately 3 minutes
Following my previous weekly analysis, I’m taking a closer look at Bitcoin’s larger-degree structure through the daily CME futures chart.
In the current count, the advance toward approximately $126,000 marks the completion of Wave III. The market may now be de
S&P 500, US 10Y and Bitcoin: the levels that matter ....After a week of big moves, a chart is the best way to cut through the noise. In periods of uncertainty, markets tend to mean-revert to their long-term moving averages, and over many years I’ve found the 55-week and 200-week MAs to be the most reliable of these.
S&P 500 (SPX), daily and weekly
Break
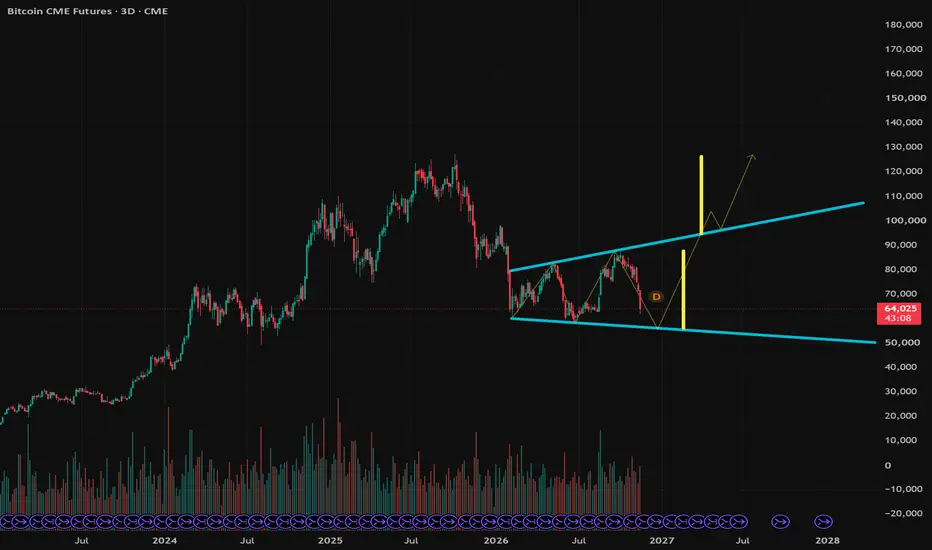
$BTC Megaphone BottomOne possible bottom formation could be a symmetrical broadening formation, or Megaphone patter.
If it plays out, expect a bottom in the low- to mid-50K region for Bitcoin, then a 1Q27 breakout to new local highs, before revisiting prior ATH of $127K in 2H27.
The pattern is slightly better than a
See all ideas
A representation of what an asset is worth today and what the market thinks it will be worth in the future.
Displays a symbol's price movements over previous years to identify recurring trends.
Frequently asked questions
One way to gain exposure to BTCH2019 is through a broker that offers futures. Before trading, make sure you understand how the product works and the risks involved.
You can trade BTCH2019 directly from TradingView:
– Choose a broker: Explore our supported trading partners and pick one that fits your needs
– Compare options: View available brokers side by side to evaluate fees and features
– Connect your account: Open Supercharts, click "Trade", select your broker, and log in
– Start trading: Place orders directly from the chart
Tip: If you're new to trading, try paper trading first — it lets you practice strategies in real market conditions without risking funds.
You can trade BTCH2019 directly from TradingView:
– Choose a broker: Explore our supported trading partners and pick one that fits your needs
– Compare options: View available brokers side by side to evaluate fees and features
– Connect your account: Open Supercharts, click "Trade", select your broker, and log in
– Start trading: Place orders directly from the chart
Tip: If you're new to trading, try paper trading first — it lets you practice strategies in real market conditions without risking funds.
The nearest expiration date for BTCH2019 is Mar 29, 2019.
Futures contracts expire on predetermined dates. As expiration approaches, many traders roll positions into the next contract to maintain exposure to the market.
Key metrics to watch near expiration:
• Volume and liquidity: Trading activity often shifts to the next contract month
• Open interest: Falling open interest may signal positions being closed or rolled forward
• Forward curve: Differences between contract prices can help identify market structure, including contango and backwardation
Explore the BTCH2019 chart to monitor active contracts and contract-month activity.
Futures contracts expire on predetermined dates. As expiration approaches, many traders roll positions into the next contract to maintain exposure to the market.
Key metrics to watch near expiration:
• Volume and liquidity: Trading activity often shifts to the next contract month
• Open interest: Falling open interest may signal positions being closed or rolled forward
• Forward curve: Differences between contract prices can help identify market structure, including contango and backwardation
Explore the BTCH2019 chart to monitor active contracts and contract-month activity.