Crypto Market Update Part 1: The Reversal ConfirmsPounding the table across July and August is paying off.
While leverage was taken off the table to manage risk, sitting fully loaded on the spot accumulated through the summer lows remains the winning play. Alongside spot, high beta crypto proxies like NASDAQ:BTDR , NASDAQ:DGXX , and NASDAQ:HIVE continue to hold strong positioning, with eyes still firmly on NASDAQ:COIN and NYSE:CRCL for added upside torque.
Ethereum Led The Way, Now Bitcoin Joins The Breakout
It was obvious to anyone tracking market structure that Ethereum took the reins first. As highlighted recently, ETH cleared and began consolidating directly above its upward sloping neckline, giving bulls the initial tell that structural buyers were back.
Today, Bitcoin is validating that strength by punching straight through its own major neckline resistance. The multi month inverse head and shoulders pattern is formally triggering.
Key Takeaways On The Setup
Macro Bottom In Place:
The bottom that started taking shape back in July is officially in the rearview mirror. What was a high probability accumulation zone then is now an active breakout.
Confirmation In Play:
Bitcoin clearing this neckline flips previous supply into major macro demand. ETH is holding firm above its own base, giving the entire crypto complex the tailwind it needed. The cycle transition from summer accumulation into autumn expansion, opinion, is actively underway.
The Only Real Risk:
The single spoiler here would be an aggressive reversal that wipes out current gains and closes the weekly candle red. That scenario looks very doubtful given the breadth and follow through across spot and equities today.
Stay tuned for Part 2, where we will dive into measured targets and Fibonacci extensions for both CRYPTOCAP:ETH and $BTC.
TGtg!
In-depth trading ideas
$ETH & SOL: Relative Strength & Pattern ReviewI had to adjust to the upward slanted dashed white neckline. IMO makes far more technical sense than the previous horizontal line.
CRYPTOCAP:ETH is not just testing a random level; it is consolidating right on top of this upward-sloping neckline while holding above its short term/fast EMAs.
Ethereum continues to show the cleanest structural integrity among the majors. Even with near term momentum cooling on crypto this pullback is far more constructive than CRYPTOCAP:BTC , which is still seeking footing for a right shoulder.
CRYPTOCAP:SOL has mustered an impressive run, but its vulnerability to broader market drag is evident.
Solana managed to clear its previous summer swing highs, confirming solid underlying bidding into the move. However, the major overhead resistance zone near the upper purple line seems to be too much at the moment.
If BTC and the broader crypto complex roll over, CRYPTOCAP:SOL is prone to retesting the primary green breakout level below. The move remains constructive overall, but it demands caution at current resistance.
Takeaway
CRYPTOCAP:ETH presents the most technically sound base of the group by consolidating directly over confirmed neckline support. CRYPTOCAP:SOL retains solid relative momentum, but its extended run leaves it vulnerable to a deeper liquidity retest if broader crypto sentiment falters.
TGtg!
$BTC and $ETH 4H Update: Big Resistance Test AheadBoth Bitcoin and Ethereum are knocking right on the door of key resistance areas while sentiment is getting super hot again.
Here is what the 4 hour charts are showing right now:
CRYPTOCAP:BTC is tapping the top of its upward channel, red line. Volume has been drying a tad on the push higher, which usually hints at buyer exhaustion. The 4H RSI managed to climb out of its downtrend, but momentum on the squeeze indicator has completely faded to zero. When momentum goes flat right at the ceiling, big volatility tends to follow fast.
CRYPTOCAP:ETH is stalling just under the red line supply zone. Earlier sell volume was heavy, but the latest candles show tiny volume bars. Sellers are taking a break, but buyers have not stepped up with real force yet either. The RSI has been hovering sideways around 55 to 60, cooling off through time instead of price.
What to watch out for:
When everyone gets overly bullish into major overhead supply, a sharp pullback is often a higher probability outcome than just drifting sideways. Whales and market makers love to use these spots to flush late high leverage longs and grab cheap liquidity below support.
Game Plan:
Holding spot long term is fine since the bigger trend stays strong above major EMAs. However, chasing or sitting on heavy leverage right into resistance carries real downside wick risk. Taking some profits on leveraged plays or moving stop losses up under the fast EMA ribbon protects your stack before volatility picks a direction.
We have some leveraged exposure, minimal, but we bought FAR LOWER, and all spot, and similar ETF positions.
Trade smart and manage your risk out there.
TGtg!
Ether - Reversal Strategy Long Setup
🍀Overview
I am not a discretionary technical analyst, so I rely on predefined setups rather than subjective chart analysis. I built the rules into a strategy to make the decision-making process more systematic.
This setup occurred before I developed the strategy. I am documenting it retrospectively and will continue to follow the trade until the strategy or I exit the position.
🍀Process
Ticker : CME:MET1!
Date : 09/02/2026
Timeframe : Daily
Direction : Long
Strategy : Reversal Strategy
Strategy Overview : Overview: A Reversal Strategy for Trading on the Daily Timeframe
Strategy Chart : Please refer to the 2nd screenshot
Signals
Main signal: RSI crossed above 30, indicating an exit from the oversold zone. This contributed a score of 0.5
Confirmation signal: The NATR Oscillator reached 80.9, exceeding the required threshold of 80. This contributed a score of 0.5
Signal Scoring
Long setup score = main signal score + confirmation signal score = 0.5 + 0.5 = 1.0
Long score threshold: 1.0
The long setup score met the required threshold. The strategy therefore placed a long bracket order.
Risk Management
Reward-to-risk ratio: 4:1
Entry: 2178.0 (the close of the setup candle)
Stop distance: 860.5 (approximately 4x daily ATR)
Target distance: 3442.5 (approximately 16x daily ATR)
Order Management : Bracket order
Limit entry: 2178.0
Market stop: 1296.5
Limit target: 5706.0
Baseline
Assume the worst has already happened: the stop loss has been reached.
🍀Outcome
Trade Execution
The strategy executed the long trade at the open of the following trading day.
Trade Status
Trading: active
Stay lucky!🍀
ETH Mirroring the Breakout: Locking In Leveraged GainsWhile CRYPTOCAP:BTC has commanded most of the spotlight, CRYPTOCAP:ETH is executing a textbook inverse head and shoulders of its own. With 2x leveraged vehicles like AMEX:ETHT ripping 60%+ off the late June base, prudent risk management dictates scaling gains into this vertical extension while letting core exposure ride.
Technical Breakdown
Inverse Head & Shoulders: Ethereum has cleanly tested the multi month neckline, completing the bottoming structure formed since the June lows.
Overhead Targets & Gap Resistance:
Neckline should be the first barrier. It breaks this we are looking at the overhead gap fill.
Structural horizontal supply zones, resistance: Red lines, thicker means stronger.
Momentum Extension: Daily RSI pushed into overbought territory alongside surging TTM momentum bars, typical of impulsive breakout legs but signaling elevated short term pullback risk.
Positioning & Execution Strategy
Scale Leveraged Runners: Systematically trimming 2x $exposure as structural targets to eliminate beta decay and lock in outsized alpha.
Core & Yield Holdings ( CBOE:NEHI , CBOE:BTCI , Spot Ethereum and Bitcoin): Maintain core spot positioning and income generating proxies, initiating only light, staged rotations on extended resistance tags rather than full exits. Unless we see HEAVY staged selling. Then sell majority positions with core trailers adding more when it is fit.
TGtg
eth1! finished correctiongood eve'
we've been projecting ether to slingshot toward the highs over the next year, and i wanted to share this important chart with you.
this is CRYPTOCAP:ETH futures, showing a perfectly completed simple zigzag correction. textbook completion, 5, 3, 5.
---
if we're correct, the next move up will be violent and unexpected by most.
it will break all time highs, then enter price expansion territory.
---
we project an average target of $42k for this run, but even that remains a relatively low target.
Part 1: The Inflection Point $BTC & $ETHFirst and foremost, speaking for myself, I prefer to rely on charts. As far as I know this data is not manipulated. You can manipulate fundamental data. However, we also look at fundamental data to help us round out our views. On that note…
Theme:
Why Crypto sits at a make or break macro crossroad. We believe that things are aligning for a surge.
The Stretched Elastic Band:
Crypto is at a massive structural fork in the road. Either major support shelves break globally, or we are sitting on the launchpad for the next leg up.
The Macro Liquidity Shift:
As central banks transition toward rate cuts and debt refinancing, capital naturally moves down the risk curve seeking yield. Crypto acts as a high beta sponge for expanding M2 liquidity.
Institutional Plumbing:
Spot ETFs and corporate balance sheet treasuries create a continuous baseline bid, quietly absorbing liquid supply off exchanges.
Regulatory Guardrails & RWAs:
Bipartisan momentum around market structure legislation, like the Clarity Act, provides traditional finance with the legal framework to tokenize real world assets on public L1 settlement layers, ed by Ethereum.
The "Inverse Cramer" Trigger:
Mainstream media ringing the panic bell and dumping holdings over late stage doom narratives right as prices sit on multi month support is historically the ultimate retail capitulation signal.
Takeaway:
The charts show where the pressure is building, but liquidity, institutional adoption, and sentiment washouts are the fuel.
TGTG
ETH Long — Accumulation data and a clean failed breakdown line uAccumulation data pointing to higher prices provides a strong fundamental tailwind for this structural long. With a flawless failed-breakdown trigger and solid 2.0R to resistance, the setup is well-aligned for a push toward the highs.
📍 Entry: 1917.5
🛑 Stop: 1885.5
🎯 Target: 1981.5
⚖️ R:R: 2.00
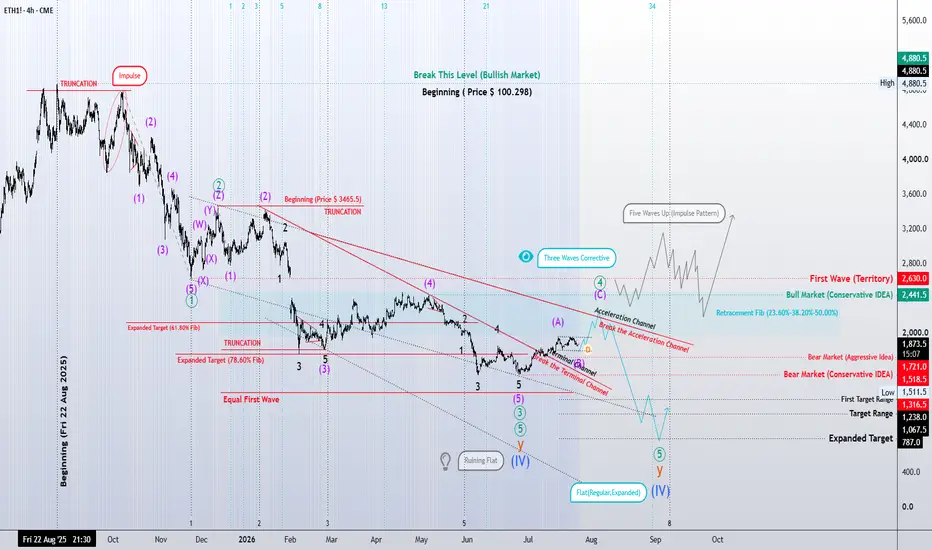
Ethereum | Running Flat or a Larger Corrective Extension?
Our current structural analysis suggests that Ethereum has reached one of the most critical stages of its correction.
In the conservative scenario, the ongoing correction may complete as a Running Flat. If confirmed, this would likely mark the end of the corrective phase and open the door for a five-wave impulsive advance, signaling the beginning of the next bullish cycle.
However, until the bullish structure is fully confirmed, the aggressive scenario remains equally valid. From this perspective, the correction may still extend, allowing Wave Y to evolve into either a Regular Flat or an Expanded Flat. For that reason, declaring the correction complete at this stage would be premature.
At the moment, the most important factor is the quality of the upcoming advance. Will the market develop a clear five-wave impulse, confirming that the correction has ended, or will the current rally become part of a larger corrective structure?
As always, this analysis is not a prediction of the future. It is my structural interpretation of the market based on the rules, guidelines, and relationships of the Elliott Wave Principle. As new waves unfold, the market—not the analyst—will determine which scenario remains valid.
📌 If the logic behind this scenario is not entirely clear, I encourage you to review the previous analyses attached to this idea. They are part of the same research path and provide the broader structural context behind the current wave count.
Price is the result. Structure is the cause.
— Mr. Nobody | Elliott Wave Principle
Ethereum
Jul 12
Is Wave C Complete, or Is the Correction Still Unfolding?
ETH Long — ETH's pullback into support is offering a clean strucEthereum offers a clean, unextended pullback to support with a favorable 1.91R. With no distinct catalyst on the wire, this setup trades purely on its technical structure. The alignment and healthy proximity to resistance make it a solid structural long.
📍 Entry: 1904.5
🛑 Stop: 1876.0
🎯 Target: 1959.0
⚖️ R:R: 1.91
ETH Long — ETH shrugged off a failed breakdown and is holding VWEther is flashing a classic failed breakdown trigger with VWAP support underneath, offering an asymmetric upside payout. The ongoing rollout of spot ETFs and expanded margin futures access on major brokerages provides a persistent institutional tailwind that strongly validates buying this dip.
📍 Entry: 1833.5
🛑 Stop: 1801.0
🎯 Target: 1950.0
⚖️ R:R: 3.58
Double Bottom: Short-Term Bounce or the Start of a New Trend?Chart patterns are among the most recognizable tools in technical analysis, and few are as widely followed as the double bottom. The pattern often signals that selling pressure may be fading after a prolonged decline, with buyers beginning to challenge the prevailing trend. Once price breaks above the pattern's neckline, many traders immediately focus on the traditional measured-move target, expecting the market to travel the projected distance before momentum fades.
However, an important question often goes unanswered: does every double bottom simply lead to its projected objective, or can some breakouts mark the beginning of an entirely new trend?
Understanding the difference can help traders place chart patterns within a broader market context instead of treating them as isolated signals. In this educational case study, we'll examine a developing setup in Ether Futures (ETH) while also discussing Micro Ether Futures (MET). The objective is not to anticipate future price action, but rather to explore how combining multiple technical tools may provide additional insight into whether a breakout is more likely to remain a short-term move or evolve into something much larger.
Understanding the Double Bottom
A double bottom is a classic bullish reversal pattern that forms after an extended decline. It consists of two distinct lows separated by an intermediate rally. The area between the two lows forms the neckline, and only when price closes above this level does the pattern become technically confirmed.
Traditionally, the expected objective is calculated by measuring the vertical distance between the lows and the neckline, then projecting that same distance upward from the breakout level.
This measured move provides traders with a logical reference point, but it should not be interpreted as a guaranteed destination. Financial markets rarely move in perfectly measured swings, and numerous factors can influence whether momentum fades before the objective is reached, reaches the objective precisely, or continues well beyond it.
For this reason, experienced traders often look for additional technical evidence that helps distinguish between a temporary recovery and the early stages of a broader trend reversal.
A Developing Ether Futures Case Study
The accompanying chart illustrates an interesting educational example using Ether Futures (ETH) listed on CME.
After several months of downward price action, the market has developed a recognizable double bottom. The neckline of the pattern is located near 1,851.0, which represents the technical breakout level required to validate the formation.
Using the traditional measured-move calculation, the projected objective is approximately 2,189.0.
Viewed in isolation, this analysis would suggest that traders simply monitor whether price can reach the projected objective. Yet markets are rarely that straightforward. Some breakouts achieve their measured targets before sellers regain control and the primary downtrend resumes. Others become the first stage of an entirely new bullish trend that extends far beyond the original projection.
This distinction forms the central question of our analysis.
Looking Beyond the Pattern
One limitation of relying exclusively on chart patterns is that they describe price structure without necessarily describing the broader condition of the trend itself.
A breakout confirms that buyers have overcome an important resistance level, but it does not automatically reveal whether institutional participation is sufficient to sustain a longer-term advance.
This is where combining complementary technical tools can provide additional context.
Rather than asking only whether the double bottom has broken out, traders may also ask whether independent evidence suggests that the prevailing trend itself is beginning to change.
When several unrelated analytical techniques begin pointing toward the same conclusion, the resulting technical confluence can sometimes provide a more complete understanding of the evolving market structure.
Adding Trend Confirmation
One additional layer of analysis comes from the Supertrend indicator.
At the time of this study, the indicator continues to classify Ether Futures as being in a downtrend. However, something particularly interesting is occurring.
The Supertrend's extreme price level currently sits near 1,863.9, only a short distance above the double-bottom breakout level at 1,851.0.
The proximity of these two technical levels creates an area of potential confluence.
If price were to move above the neckline while also exceeding the Supertrend extreme, the market would not only be confirming the chart pattern itself, but it would also be providing additional evidence that the prevailing trend may be changing.
This distinction is important.
A breakout above the neckline alone may simply activate the measured move associated with the pattern.
A breakout that simultaneously shifts the broader trend environment may suggest that the measured target represents only an intermediate milestone rather than the final objective.
Of course, no technical indicator can guarantee future outcomes, and confirmation should always be viewed as one piece of evidence rather than definitive proof.
The Importance of Nearby Resistance
Even when bullish conditions improve, markets rarely move upward in a straight line.
The chart identifies an important UnFilled Orders (UFO) resistance zone located approximately between 1,959.0 and 2,140.5.
This area deserves attention because it lies directly between the breakout level and the projected double-bottom objective.
As price approaches overhead resistance, it is common for supply to increase temporarily. Markets frequently pause, consolidate, or retrace before attempting another advance.
Consequently, a temporary pullback after a successful breakout would not necessarily invalidate the bullish structure.
Instead, traders often monitor whether buyers continue defending progressively higher lows after such retracements.
If buying interest remains active despite short-term selling pressure, the developing structure may continue strengthening over time.
Conversely, failure to sustain the breakout could indicate that the pattern was insufficient to reverse the broader trend.
The objective is therefore not simply to identify resistance, but to understand how price behaves once resistance is encountered.
Measured Move or New Trend?
This brings us back to the original question.
If the market only confirms the double bottom, traders may naturally focus on the projected objective near 2,189.0 as the primary technical reference.
However, if the breakout also coincides with broader trend confirmation, the market structure itself may begin to change.
In such situations, the measured move becomes less of a destination and more of an intermediate checkpoint within a potentially larger trend development.
This illustrates why technical analysis often benefits from combining multiple perspectives rather than relying on a single chart pattern in isolation.
Instead of asking only "Where is the target?", traders may also consider asking:
Has the prevailing trend changed?
Is momentum improving?
Are important resistance levels being absorbed?
Is price continuing to establish higher highs and higher lows following the breakout?
Answering these questions may provide a richer understanding of market conditions than the measured projection alone.
Illustrative Trade Scenario
The following example is presented solely for educational purposes as a case study illustrating risk management concepts rather than as a trading recommendation.
One possible approach would involve waiting for confirmation above both the double-bottom breakout level near 1,851.0 and the nearby Supertrend confirmation level around 1,863.9.
The traditional chart objective would remain approximately 2,189.0, while a protective stop could hypothetically be placed beneath the breakout structure to define risk if the pattern were to fail.
Because every trader uses different position sizing methodologies, the exact stop location and resulting reward-to-risk ratio will vary.
The important lesson is not the specific numbers themselves, but rather the principle of defining both potential reward and acceptable risk before entering any position.
Should the broader trend continue strengthening beyond the measured objective, traders may then reassess market structure rather than assuming the initial projection automatically represents the end of the move.
Ether Futures and Micro Ether Futures
CME lists two relevant U.S. dollar-denominated contracts for this case study: the standard Ether Futures contract (ETH) and the smaller Micro Ether Futures contract (MET).
The contract specifications are materially different:
o Ether Futures (ETH)
Contract size: 50 ether
Minimum price fluctuation (tick): $0.50 per ether = $25.00 per contract
Current margin requirement: approximately $29,000 per contract
o Micro Ether Futures (MET)
Contract size: 0.10 ether
Minimum price fluctuation (tick): $0.50 per ether = $0.05 per contract
Current margin requirement: approximately $58 per contract
This means one standard ETH contract is equivalent in size to 500 MET contracts.
The much smaller MET contract allows position size to be adjusted in finer increments. This may be particularly relevant when the distance between the proposed entry and the technical invalidation level would otherwise create excessive dollar risk in the standard ETH contract.
For example, a $100 move in Ether would correspond to:
$5,000 of contract-value movement for one ETH contract
$10 of contract-value movement for one MET contract
Margin requirements are time-sensitive and may change as volatility and market conditions evolve. They also differ from broker-required initial, maintenance, overnight, or intraday margins. Traders should therefore verify the applicable amount with their futures broker before assessing position size.
The Role of Risk Management
Regardless of how attractive a chart pattern may appear, no technical setup guarantees success.
Markets continuously respond to new information, changing liquidity conditions, and evolving participant behavior.
For this reason, risk management remains one of the most important components of any trading methodology.
Some principles frequently considered include:
Defining risk before entering a position.
Avoiding oversized positions relative to account size.
Allowing the market to confirm a breakout rather than anticipating it.
Accepting invalidation when technical conditions change.
Remaining flexible as new information develops.
Perhaps the most valuable lesson is that uncertainty never disappears from financial markets.
Technical analysis seeks to organize probabilities, not eliminate uncertainty.
Final Thoughts
Double bottoms remain one of the most respected reversal patterns in technical analysis because they provide a clear framework for identifying potential changes in market sentiment.
Yet the measured objective should not necessarily be viewed as the final chapter of every successful breakout.
Sometimes it represents exactly what the pattern delivers—a defined move that eventually loses momentum.
Other times, the breakout occurs alongside broader evidence suggesting that the prevailing trend itself may be changing.
By combining classical chart patterns with trend analysis and nearby support and resistance assessment, traders can develop a more comprehensive framework for evaluating whether a breakout is simply a short-term bounce or the possible beginning of a broader trend reversal.
Whether the traditional measured objective ultimately becomes the destination—or merely the first milestone—depends on how the market continues to evolve after confirmation.
Data Consideration
When charting futures, the data provided could be delayed. Traders working with the ticker symbols discussed in this idea may prefer to use CME Group real-time data plan on TradingView: www.tradingview.com - This consideration is particularly important for shorter-term traders, whereas it may be less critical for those focused on longer-term trading strategies.
General Disclaimer
The trade ideas presented herein are solely for illustrative purposes forming a part of a case study intended to demonstrate key principles in risk management within the context of the specific market scenarios discussed. These ideas are not to be interpreted as investment recommendations or financial advice. They do not endorse or promote any specific trading strategies, financial products, or services. The information provided is based on data believed to be reliable; however, its accuracy or completeness cannot be guaranteed. Trading in financial markets involves risks, including the potential loss of principal. Each individual should conduct their own research and consult with professional financial advisors before making any investment decisions. The author or publisher of this content bears no responsibility for any actions taken based on the information provided or for any resultant financial or other losses.
Post 1 - Crypto Analysis: Bitcoin & EthereumBitcoin & Ethereum
Is This True Capitulation?
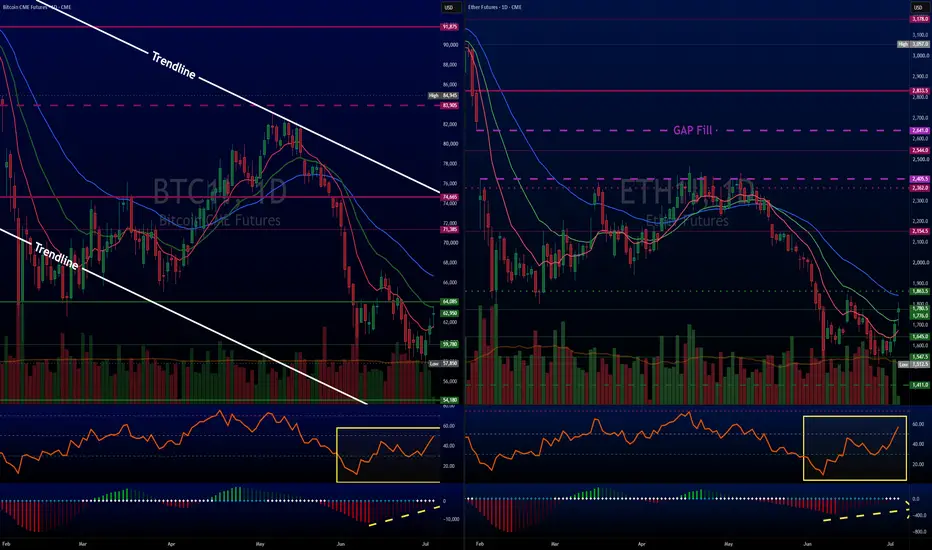
The price action certainly rhymes with it. When you look at, CRYPTOCAP:ETH sharp +4.55% rip to $1,780 is a textbook response to a severely overextended market asset mean reverting out of deep value territory. The massive selling pressure that dominated June drove both assets into structural support grids.
The Technical Reality: We Need Transformed Flow
While the RSI hook and the decelerating TTM Squeeze histograms (the yellow dashed trajectories showing shortening red bars) look beautiful for a short term trade, this is purely structural relief so far.
The Missing Ingredient: True capitulation requires an exhaustive volume climax where supply dries up. Right now, we have the bounce, but we haven't established a clear floor of institutional accumulation yet.
Risk Management:
Catching this move early last week with leveraged BTC/BITX was a sharp technical play into a major macro demand pocket.
However, until CRYPTOCAP:BTC prints a higher low or cleanly snaps the primary descending white trendline near $74k, the intermediate down trend remains intact. The bleeding is pausing, but it is most likely not over.
Turning Conflicting Signals into Structured DecisionsOne of the biggest misconceptions in trading is the belief that every good opportunity should look obvious. Many traders wait for every indicator, every chart pattern, and every momentum signal to point in the same direction before considering a position. While this sounds logical, markets rarely offer such perfect alignment.
Instead, they often present conflicting information. A chart may display a bullish pattern while momentum remains weak. A trend may appear constructive while resistance sits immediately overhead. Oscillators may begin improving before price confirms the move.
At first glance, conflicting signals appear to complicate decision-making. In reality, they can offer one of the most valuable lessons in trading: uncertainty is unavoidable, but risk can still be structured.
This idea can be illustrated using Ether futures as a practical case study.
Every Decision Has Pros and Cons
Trading is not unique in requiring decisions under uncertainty.
Buying a home involves weighing location against cost. Accepting a new job means balancing opportunity against risk. Starting a business requires optimism while acknowledging uncertainty.
Every meaningful decision contains arguments for and against it.
Financial markets are no different.
Waiting until every piece of evidence agrees often means waiting for a move that has already developed. On the other hand, acting on a single indicator while ignoring conflicting information can expose traders to unnecessary risk.
Rather than searching for certainty, experienced traders often focus on building a structured process for evaluating competing evidence.
The objective is not to eliminate uncertainty.
The objective is to make disciplined decisions despite uncertainty.
A Chart That Tells Two Stories
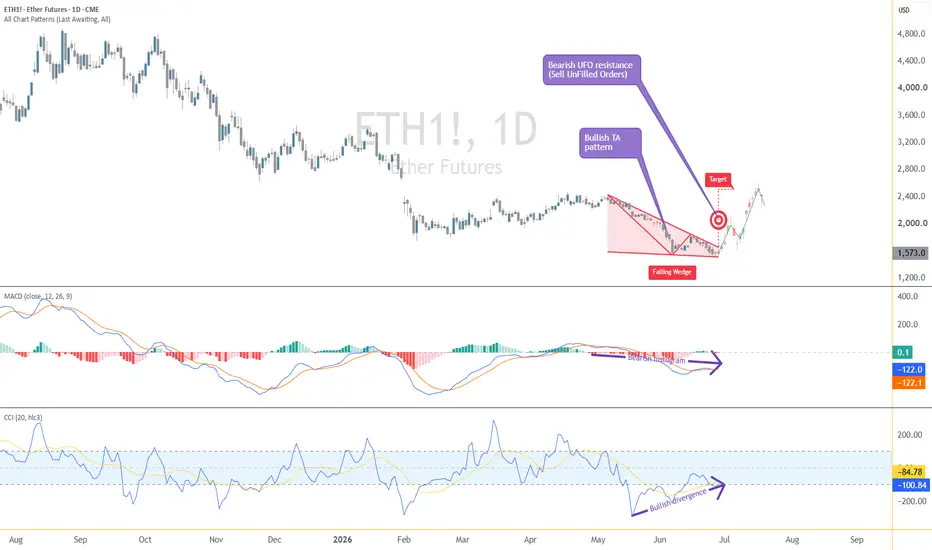
The accompanying daily chart of Ether futures provides an interesting example.
At first glance, several bullish characteristics are visible.
Price has developed a falling wedge, a classical chart pattern frequently associated with the possibility of an upside resolution after a period of declining prices. As the wedge narrows, selling pressure appears to become less aggressive, allowing buyers an opportunity to regain control.
The Commodity Channel Index (CCI) adds another constructive observation.
Although price recently produced lower lows, the CCI formed a bullish divergence, suggesting downside momentum may be weakening. Divergences do not guarantee reversals, but they often encourage traders to monitor price action more closely.
If those were the only observations available, many traders might conclude that the market presents a constructive technical picture.
However, the chart also contains meaningful bearish evidence.
Immediately above price lies a bearish UFO resistance (Sell UnFilled Orders) between approximately 1,959.0 and 2,140.5. This area represents a zone where previously unexecuted sell orders may still be waiting, potentially increasing selling pressure should price revisit the region.
Momentum also introduces caution.
The MACD histogram remains below the zero line, indicating bearish momentum has not fully reversed despite recent price improvement.
The result is a chart where neither buyers nor sellers possess overwhelming technical evidence.
Bullish signals exist.
Bearish signals exist.
Neither side completely dominates the discussion.
For many traders, this is exactly where uncertainty begins.
Replacing Opinions with a Decision Matrix
Instead of asking a simple question—
"Is this chart bullish or bearish?"
—it may be more useful to ask a different one:
"What evidence supports each side?"
Viewed this way, the chart becomes less emotional and more objective.
Bullish observations
Falling wedge pattern.
CCI bullish divergence.
Early signs that selling pressure may be slowing.
Bearish observations
Bearish UFO resistance directly overhead.
MACD histogram remains negative.
Overhead supply may limit upside progress.
Notice that none of these observations automatically invalidates the others.
All of them can be true simultaneously.
Markets frequently contain conflicting information because buyers and sellers are continuously expressing different opinions.
The purpose of technical analysis is not to identify certainty.
It is to organize evidence into a structured decision-making process.
The Hidden Opportunity Inside Conflicting Signals
Many traders stop their analysis once they recognize conflicting signals.
They conclude that uncertainty means no opportunity exists.
Yet conflicting evidence often creates another characteristic that deserves attention.
When opposing technical arguments meet within a relatively narrow price range, the market frequently resolves the disagreement sooner rather than later.
In other words, the market may reveal relatively quickly which side has gained control.
This can create an important advantage from a risk management perspective.
Suppose a trader believes the bullish interpretation deserves greater weight.
If the bullish thesis is correct, price should continue respecting the falling wedge while attempting to challenge the overhead resistance.
If the bullish thesis is incorrect, the market may invalidate the pattern relatively quickly by breaking decisively below the wedge.
The chart therefore provides a clearly identifiable point where the original hypothesis would no longer be supported.
Rather than focusing exclusively on whether the market eventually moves higher, the trader can focus on whether the original idea remains valid.
This distinction is important.
Successful trading is often less about predicting direction and more about defining when a trading idea is no longer supported by evidence.
A Hypothetical Case Study
Consider a purely illustrative example.
A trader observes the falling wedge beginning to resolve to the upside while recognizing that meaningful resistance remains overhead.
Rather than assuming the bullish pattern must succeed, the trader constructs a hypothesis.
The hypothesis could be summarized as follows:
The falling wedge suggests buyers may be regaining control.
The bullish CCI divergence supports the possibility of improving momentum.
Overhead UFO resistance represents the first significant obstacle.
The bearish MACD histogram reminds traders that downside momentum has not fully disappeared.
Under this framework, a hypothetical long position might only be considered after sufficient confirmation that buyers are attempting to regain control.
Equally important, the trader defines an invalidation level before entering the position.
On this chart, a decisive move below approximately 1,504 would represent a meaningful breakdown beneath the falling wedge, suggesting the bullish technical structure has failed.
If that occurs, the original thesis would no longer be supported.
Notice that this approach is not built around certainty.
It is built around predefined risk.
Should the bullish interpretation prove incorrect, the trader knows relatively quickly that the hypothesis requires reassessment.
Conversely, if buyers continue gaining control, price may begin challenging the identified resistance area.
Whether the market ultimately succeeds or fails is less important than the process itself.
The lesson is that structured decisions begin with clearly defining both the opportunity and the conditions under which that opportunity no longer exists.
Ether Futures and Micro Ether Futures
This case study uses CME Ether futures and Micro Ether futures to illustrate the concepts discussed above.
The standard Ether futures contract (ticker: ETH) represents 50 ether, providing exposure suitable for larger notional positions. The Micro Ether futures contract (ticker: MET) represents 0.1 ether, allowing traders to adjust exposure in much smaller increments while following the same underlying market. Both contracts are cash settled using the CME CF Ether-Dollar Reference Rate.
From a contract specification perspective:
ETH (Ether Futures): The minimum price fluctuation for ETH is 0.50 index points, equivalent to $25.00 per contract.
MET (Micro Ether Futures): The minimum price fluctuation for MET is 0.50 index points, equivalent to $0.05 per contract.
Because cryptocurrency markets can experience elevated volatility, margin requirements may change over time.
At the time of writing, traders should expect approximately:
ETH Margin: approximately $25,000 per contract.
MET Margin: approximately $50 per contract.
These figures are exchange requirements and remain subject to periodic adjustment as market conditions evolve. Traders should always verify current requirements with their broker before initiating any position.
The availability of both standard and micro-sized contracts gives market participants flexibility to align position size with their individual risk management framework.
Risk Management Comes Before Direction
Perhaps the most valuable lesson from this chart has little to do with Ether itself.
It concerns risk management.
Charts containing conflicting signals remind traders that no indicator deserves absolute trust.
Instead of searching for perfect agreement, traders may benefit from asking three simple questions:
What evidence supports the trade?
What evidence argues against it?
At what price would my original idea no longer be valid?
Answering those questions before entering a position encourages discipline rather than emotion.
Equally important, a relatively small predefined risk does not imply a trade is "safe."
Unexpected news, volatility, and execution differences can always influence outcomes.
Position sizing should therefore remain consistent with an individual's overall trading plan, regardless of how attractive a particular technical setup may appear.
Being proven wrong quickly is not a failure.
Failing to recognize when the original hypothesis has been invalidated is often the greater risk.
Final Thoughts
Conflicting technical signals are often viewed as obstacles.
In practice, they can become valuable teachers.
They encourage traders to organize evidence objectively rather than searching for certainty where none exists.
The falling wedge, bullish CCI divergence, bearish UFO resistance, and bearish MACD histogram each contribute meaningful information.
None should be ignored.
Rather than asking which indicator is "correct," traders may find greater value in asking how all available evidence fits together within a structured decision-making process.
Markets will always contain uncertainty.
Good risk management does not eliminate that uncertainty.
It simply provides a disciplined framework for navigating it.
Data Consideration
When charting futures, the data provided could be delayed. Traders working with the ticker symbols discussed in this idea may prefer to use CME Group real-time data plan on TradingView: www.tradingview.com - This consideration is particularly important for shorter-term traders, whereas it may be less critical for those focused on longer-term trading strategies.
General Disclaimer
The trade ideas presented herein are solely for illustrative purposes forming a part of a case study intended to demonstrate key principles in risk management within the context of the specific market scenarios discussed. These ideas are not to be interpreted as investment recommendations or financial advice. They do not endorse or promote any specific trading strategies, financial products, or services. The information provided is based on data believed to be reliable; however, its accuracy or completeness cannot be guaranteed. Trading in financial markets involves risks, including the potential loss of principal. Each individual should conduct their own research and consult with professional financial advisors before making any investment decisions. The author or publisher of this content bears no responsibility for any actions taken based on the information provided or for any resultant financial or other losses.
ETH Long — $ETH pullback to the breakout retest at 1800 with spoHTF (4h) structure: ETH entered a sustained downtrend from ~2400 (late April) to the ~1550 low on Jun 5, with LH/LL sequence intact throughout. The Jun 5 capitulation candle on high volume (~8000 bar) marked the swing low, and since then price has been constructing a recovery — higher lows from 1550 → 1614 → 1630 → 1720, with the Jun 15 surge through 1800 printing the first meaningful HH on the 4h. This suggests a potential HTF trend change / early recovery phase rather than a clean continuation trend, so the HTF bias is cautiously bullish — the prior downtrend has been interrupted but not definitively reversed. Key HTF level: the 1800–1810 zone (prior resistance from Jun 3–4 congestion, now being tested as support). The Jun 15 rally pushed to ~1851 intraday before pulling back; current price ~1797 is sitting precisely at the retest of the broken 1800 level. LTF (1h): after the Jun 15 spike to ~1851, price has been pulling back in controlled fashion — the 06:00 bar today tagged 1838 then sold to 1792, and the 07:00 bar closed at 1798. The pullback is orderly with diminishing red volume, consistent with a retest of the breakout zone rather than a breakdown. The 1792–1796 area (intraday low of the last two bars) is the trigger zone; entry at 1800 (ask, effectively at the level). Stop below the intraday swing low at 1792 minus ~0.5× ATR (18.6) ≈ 1759, clearing the Jun 15 afternoon low at 1783 and sitting below any plausible retest noise. Target: next HTF supply zone around 1883–1885 (Jun 3 open/close cluster before the breakdown accelerated); placed at 1882. R/R = (1882−1800)/(1800−1759) = 82/41 = 2.0 — exactly at the gate, acceptable in swing mode with strong catalyst tailwind. Research: Spot ETH ETFs launched today (Jun 16) with BlackRock/VanEck/Fidelity participating, $22.5M inflows on Jun 15 vs BTC ETF outflows — structurally bullish near-term catalyst aligned with the LONG thesis (T2, +8 to confidence). Market regime long_lean (+5). Scan hint Pullback/LONG 73, agrees (+4). base 62; hint +4; regime +5; research +8 → 79; capped at 72 reflecting that the R/R is tight at exactly 2.0 and HTF trend is early-stage recovery rather than established uptrend.
📍 Entry: 1800.0
🛑 Stop: 1759.0
🎯 Target: 1882.0
⚖️ R:R: 2.00
ETH Short — Short bias in $ETHM26 while the 1696 rejection holdsHTF remains bearish with price below the major moving-average stack and capped under the 1696 swing high. The 1h chart produced a high-volume failed push into 1693/1696 resistance, then rolled over with lower highs and an expanding-volume sell bar back toward 1651 support. Prefer a short on a retest of the broken intraday shelf near 1662, with invalidation above the 1685/1696 rejection zone and target near the 1604 swing low.
📍 Entry: 1662.0
🛑 Stop: 1686.0
🎯 Target: 1605.0
⚖️ R:R: 2.38
ETH Short — Short setup in $ETHM26 if price retests and rejects ETH is in a clear 4h downtrend, trading well below its major EMAs with expanding relative volume on the latest selloff. The 1h breakdown through the 1960-1950 area was impulsive, and the weak bounce has so far failed under the new supply shelf around 1927-1931. Favor a short only on a retest of that shelf; invalidation is a reclaim above the 1944.5 reaction high, with the prior 1894 swing low as the first downside target.
📍 Entry: 1928.5
🛑 Stop: 1946.0
🎯 Target: 1894.0
⚖️ R:R: 1.97
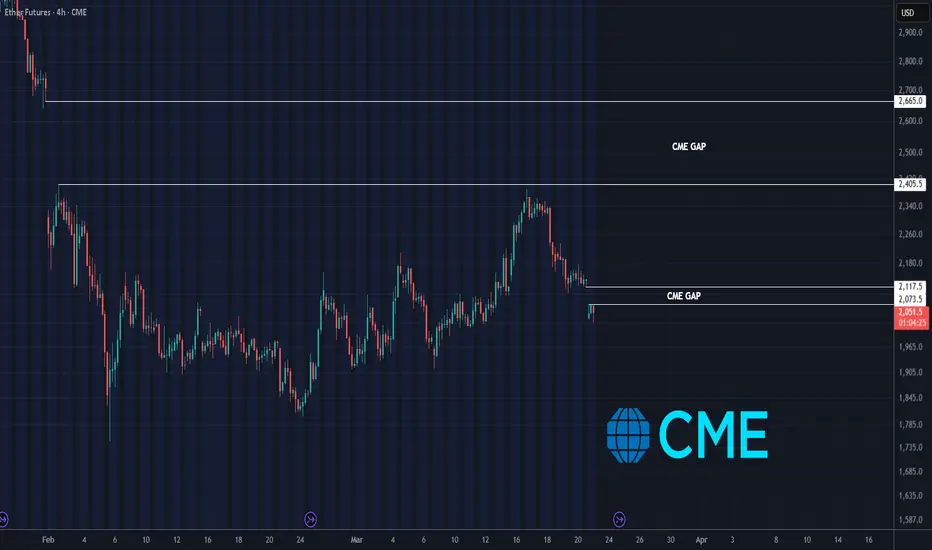
Ethereum CME GAP | Will The Gaps Be Filled?When analyzing Ethereum price gaps, it’s wise to stay cautious and avoid rushing to conclusions.
On the chart, two gaps can typically be identified: one positioned closer to the current price action and another located further away.
Price usually tends to move toward and fill the nearer gap first, as it is more accessible. Once that level is addressed, the focus may shift toward the second gap.
That said, the more distant gap can be challenging to reach and may remain open for an extended period. From a structural standpoint, the market currently shows signs of weakness, and ongoing geopolitical tensions could continue to influence overall price behavior.
Ethereum First Gap: 2073$ - 2117$
Ethereum Second Gap: 2405$ - 2665$
What do you think? Will Ethereum gaps be filled easily?
The Silent Signal: How Open Interest May Shape the Next MoveIntroduction — The Signal Beneath Price
Price is what most traders see. Participation is what most traders miss.
In futures markets, open interest (OI) offers a unique lens into market behavior — not by telling us where price is, but by revealing how committed market participants are to the move. When combined with structural tools and quantitative overlays, OI can act as a “silent signal,” highlighting shifts in conviction that price alone may conceal.
The current environment presents a compelling case. While price has been largely moving sideways in recent months, the underlying participation dynamics suggest that something more subtle — and potentially more meaningful — is unfolding beneath the surface.
Open Interest Regimes — Tracking Market Intent
At its core, open interest measures the number of outstanding contracts in the market. But more importantly, it reflects whether traders are entering or exiting positions.
Increasing OI → New positions entering the market (expanding participation)
Decreasing OI → Positions being closed (contracting participation)
This distinction becomes powerful when observed over time.
Looking at the chart provided, a clear pattern emerges:
Periods of increasing open interest tend to align with upward price movements
Periods of decreasing open interest tend to align with downward price movements
This relationship is not coincidental. It reflects the underlying commitment behind price trends.
More recently, however, the balance has shifted.
Despite price moving sideways — and even slightly upward at times — the dominant regime has increasingly been one of declining open interest. This creates a subtle divergence:
👉 Price appears stable
👉 Participation is quietly weakening
And in futures markets, weakening participation often precedes structural transitions.
Regression Analysis — Quantifying Directional Bias
To better visualize these dynamics, regression lines have been applied across different phases of open interest behavior.
Rather than focusing on every price fluctuation, regression analysis helps to:
Smooth out short-term noise
Highlight the underlying directional bias during each OI phase
The result is striking:
During rising OI phases, regression lines slope upward, confirming constructive participation
During falling OI phases, regression lines slope downward, reinforcing weakening structure
This alignment between participation and directional bias strengthens the interpretation that OI is not just confirming price — it is contextualizing it.
In the current phase, multiple sequences of decreasing OI have appeared, with regression slopes reflecting downward pressure building beneath a relatively flat price structure.
This is how transitions may begin — quietly.
The Role of the Weekly Open Gap — A Structural Ceiling
Beyond participation, structure plays a critical role in shaping market behavior.
One of the most notable features on the chart is the presence of a weekly open gap, formed during a market reopening. In futures markets, such gaps represent temporary imbalances between buyers and sellers, often acting as key reaction zones.
The gap in focus spans approximately:
Upper boundary: 2,641.0
Lower boundary: 2,405.5
When price recently entered this zone, the reaction was immediate and decisive:
👉 Strong rejection from within the gap
👉 Price pushed back downward
👉 Simultaneous decline in open interest
This confluence suggests that the gap is acting as a structural ceiling, where supply re-engages and participation fails to support higher prices.
In other words, the market attempted to move higher — but conviction did not follow.
Market Structure — Is This a Bearish Flag?
When stepping back and observing the broader structure, another layer of context emerges.
The price action since approximately February can be characterized as:
Sideways
Slightly upward-sloping
Occurring after a prior downtrend
From a structural perspective, this configuration resembles what is commonly referred to as a bearish flag — a consolidation phase that occurs within a broader downward move.
Key elements include:
A prior impulsive decline
A consolidation phase with limited upward follow-through
Weakening participation during the consolidation
While no pattern guarantees an outcome, this framework provides a logical narrative:
👉 The market may be consolidating before attempting continuation
The declining open interest during this phase further supports the idea that the consolidation lacks strong conviction.
Forward-Looking Trade Scenario (Illustrative Case Study)
The following scenarios are presented strictly for educational purposes, illustrating how one might structure a trade using the concepts discussed.
Scenario 1 — Gap Rejection Entry (Conservative Approach)
Entry: Within the gap zone upon signs of rejection
Stop: Above the upper boundary of the gap
Target: Lower structural support (~1,663.5)
This approach focuses on fading strength into resistance, aligning with both structural and participation signals.
Scenario 2 — Breakdown Confirmation (Momentum Approach)
Entry: Break below prior low (~2,253.0)
Confirmation: Formation of a lower low in market structure
Stop: Above recent structure or based on risk parameters
Target: ~1,663.5 (identified support linked to prior unfilled orders)
This approach prioritizes confirmation over anticipation, waiting for structure to validate the move.
Risk-to-Reward Framework
In both scenarios, a reward-to-risk ratio of approximately 3:1 may serve as a reference point for structuring the trade.
However, it is essential to emphasize:
These are hypothetical case studies
Execution, timing, and risk management remain critical variables
Understanding the Instruments
Understanding contract specifications is essential for translating analysis into practical risk management.
Ether Futures (Standard Contract)
Tick size: $0.50 per ether = $25.00 per contract
Notional exposure: Substantial, requiring careful capital allocation
Margin requirement: ~$37,500 per contract
Micro Ether Futures
Tick size: $0.50 per ether = $0.05 per contract
Designed for greater flexibility and precision in position sizing
Margin requirement: ~$75 per contract
Margin requirements vary over time based on volatility and clearing conditions, but generally:
Standard contracts require significantly higher initial margin
Micro contracts offer a lower capital threshold, enabling more granular risk control
The choice between contract types depends on:
Account size
Risk tolerance
Position sizing strategy
Risk Management — The Non-Negotiable Layer
No analytical edge can compensate for poor risk management.
Key principles include:
Defining risk before entering a position
Using stop-loss levels aligned with structure
Avoiding overexposure relative to account size
Importantly, open interest should be viewed as:
👉 A contextual tool, not a standalone trigger
Markets can behave unpredictably, and participation signals — while informative — do not eliminate uncertainty.
Key Takeaways — Listening to the Silent Signal
Open interest provides insight into market participation and conviction
Divergences between price and OI can reveal hidden weaknesses or strengths
Structural elements such as gaps and consolidation patterns enhance interpretation
The current environment reflects declining participation within a consolidating structure
Risk management remains the foundation of any trading approach
Data Consideration
When charting futures, the data provided could be delayed. Traders working with the ticker symbols discussed in this idea may prefer to use CME Group real-time data plan on TradingView: www.tradingview.com - This consideration is particularly important for shorter-term traders, whereas it may be less critical for those focused on longer-term trading strategies.
General Disclaimer
The trade ideas presented herein are solely for illustrative purposes forming a part of a case study intended to demonstrate key principles in risk management within the context of the specific market scenarios discussed. These ideas are not to be interpreted as investment recommendations or financial advice. They do not endorse or promote any specific trading strategies, financial products, or services. The information provided is based on data believed to be reliable; however, its accuracy or completeness cannot be guaranteed. Trading in financial markets involves risks, including the potential loss of principal. Each individual should conduct their own research and consult with professional financial advisors before making any investment decisions. The author or publisher of this content bears no responsibility for any actions taken based on the information provided or for any resultant financial or other losses.
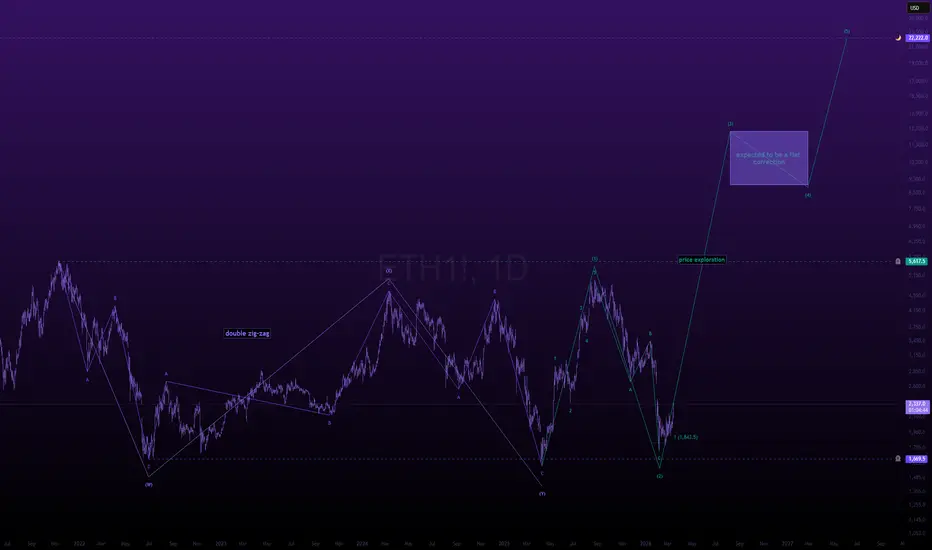
ethereum explosively rallies to 22k.good evening,
ethereum has been in this larger scale correction between 2021 and 2025,
a 4 year accumulation, which stretched well into 2026.
5 year consolidation technically.
this, is beautiful to see.
---
for whatever reason, the spot version of the ethereum chart does not display this correction, only the cme future does. surprisingly enough, cme futures has the highest volume traded on the ethereum pair, so i guess it makes sense to look at this chart, over the spot pairs.
---
double zig-zag (3-3-3) from 2021 -> 2025.
1-2-3-4-5 from april 2025 -> august 2026
a-b-c from august 2026 -> february 2026 (marking a macro low).
a \ c were 1:1 in size
confirming a deep 1-2.
---
if my count is correct here, ethereum is now entering into wave 3,
up to 22k as the final bull market target (if there are no extensions).
> if there is an extension in either the 3rd or 5th, then we can go significantly higher.
---
🎯 = 22k
$22,222gm,
decided to share my bullish take on ethereum (using ethereum futures)
---
from the 2021 bull market peak, ethereum came down in 3 waves via a double zig-zag,
it was clean, uniform, nothing out of the ordinary.
eth futures has the highest volume of all the pairs, so we focus on this pair over the spot pairs on the big centralized exchanges.
---
from the 2025 bear market lows, ethereum ripped up in 5 waves and has since come down in a clean 3 wave move which i've labeled a simple zig-zag.
if the 2025 low holds, ethereum will most likely rally back up to the all time highs and then enter into a price exploration. this is not something that will happen overnight, instead, this is something that can take the rest of the year to pan out, maybe even well into 2027.
---
i view this as a very contrarian case amidst a wave of extreme pessimism and extreme fear in the broader markets. people are horrified and also sidelined, unwilling to participate, which is why my upside target is so high.
once the casual people start flooding back into the market, supply will be low enough to send ethereum spiraling up in a monstrous move.
---
🎯 = $22,222
Ethereum Futures Testing Range Lows as Macro Pressures BuildEthereum Futures at a Crossroads: Diverging from Bitcoin
Ethereum futures track the price of Ether, the native token of the Ethereum blockchain, which remains the dominant infrastructure layer for decentralized finance, NFTs, and tokenized assets. Like most digital assets, Ethereum futures are heavily influenced by global liquidity conditions, institutional flows, regulatory developments, and sentiment across the broader cryptocurrency market.
While Ethereum often trades directionally with Bitcoin, the strength of the correlation varies significantly across cycles. Bitcoin is widely viewed as the reserve asset of the crypto ecosystem and increasingly functions as a macro risk proxy. Ethereum, by contrast, behaves more like a high beta technology platform tied to network activity, decentralized applications, and evolving token economics. This distinction explains why Ethereum has recently struggled to hold price levels as effectively as Bitcoin during periods of market stress.
One structural factor affecting sentiment is the evolution of Ethereum’s token economics. After the Dencun upgrade in 2024, much of the ecosystem activity migrated to Layer 2 networks where transaction costs are significantly lower. While this improves scalability, it also reduces the amount of ETH burned on the mainnet, weakening the deflationary narrative that previously supported price appreciation.
Recent macro developments have also contributed to volatility across the crypto complex. In late January and early February 2026, markets reacted negatively to the nomination of Kevin Warsh as a potential Federal Reserve chair, which raised concerns that monetary policy could remain restrictive for longer. That shift in rate expectations triggered a broad selloff across risk assets including cryptocurrencies.
The crypto market also experienced a wave of forced liquidations in early February, with billions of dollars in leveraged positions unwound across derivatives exchanges. These liquidation cascades tend to amplify downside volatility in assets like Ethereum that are widely traded with leverage.
More recently, geopolitical tensions in the Middle East and broader risk asset volatility have also contributed to short term fluctuations across Bitcoin and Ethereum markets.
Against this backdrop, Ethereum futures are now trading near the lows of a multi year range, with market participants closely watching key technical levels for the next directional move.
What the Market Has Done
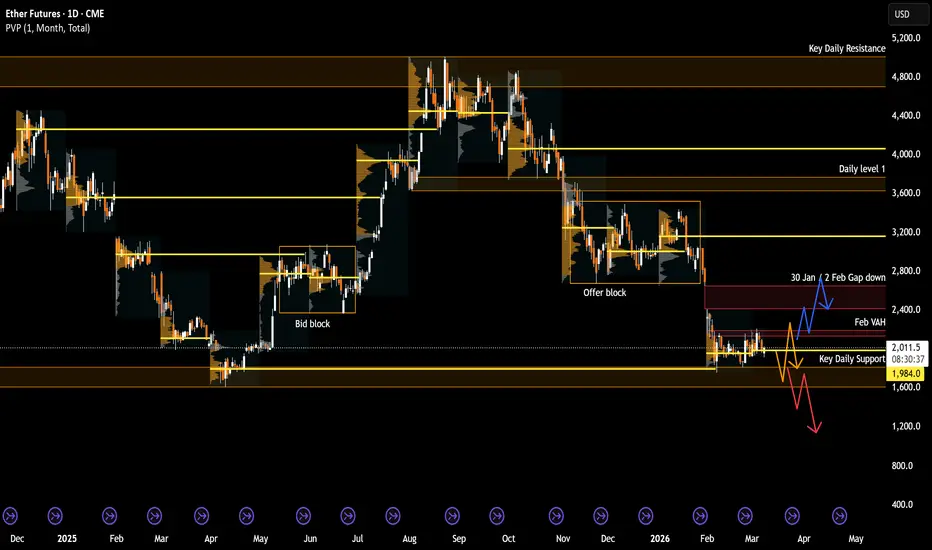
• The market has been in a large multi year range since 2021 between the 5500 area and the 1700 area.
• Since November 2025, the market failed to hold above the 3750 area (daily level 1) and rotated back down to the 2700 area, where buyers defended at bid block. The bearish rotation coincided with tightening financial conditions and renewed macro uncertainty after hawkish Federal Reserve expectations emerged, which pressured crypto markets broadly.
• Subsequently, sellers stepped down offers to the 3500 area, resulting in a two way auction and forming a consolidation block between 3750 and 2700. This range later transitioned into an offer block once the market broke lower.
• More recently, the market gapped down in February to the 1750 area, a key daily support level where buyers defended. The move occurred during a broader crypto selloff triggered by heavy derivatives liquidations and widespread risk reduction across leveraged positions. Liquidation events exceeding several billion dollars in early February accelerated downside momentum across the crypto market.
• The market is currently balanced within the February value area and trading in a tight range.
What to Expect in the Coming Weeks?
The key levels to watch are 2150 (February VAH) and 1750 (key daily support).
Neutral Scenario
• Without further catalyst, expect the market to continue to auction two-way within the February value area with possible overshoots at the edges.
• This behavior would reflect continued balance conditions as the market digests macro uncertainty and waits for new catalysts such as regulatory developments, institutional flows, shifts in global liquidity conditions, or escalation or resolution of geopolitical conflicts in the Middle East.
Bullish Scenario
• If buyers are able to imbalance out of the February value area above 2150, expect a move toward 2411, which marks the January 31 to February 2 gap low.
• A continuation higher could bring prices toward 2646 to fully close the gap.
• If acceptance develops above 2646 after the gap closes, the market may rotate back into the prior offer block, potentially targeting the 3100 to 3150 area near the offer block midpoint and January VPOC.
Bearish Scenario
• If buyers are unable to defend the 1750 area, expect long liquidation and a move down toward 1300.
• If the market is not able to recover back above 1600 quickly after a breakdown, further downside continuation could follow as leveraged positions are forced out of the market.
Conclusion
Ethereum futures remain trapped within a broader multi year range, but recent price action shows the market testing the lower end of that structure. From a technical perspective, the 1750 support and 2150 February VAH will likely determine the next directional move. A breakout above value could trigger a rotation back toward prior value areas, while failure to hold support could accelerate liquidation driven downside.
Fundamentally, Ethereum continues to navigate a complex transition. Changes to its token economics, institutional positioning in crypto funds, and macro drivers such as Federal Reserve policy and geopolitical developments are all influencing sentiment. As global liquidity conditions and risk appetite shift, Ethereum may continue to exhibit higher volatility relative to Bitcoin.
The next directional move will likely be determined by whether buyers can reclaim the 2150 February VAH or if sellers are able to force acceptance below the 1750 support.
Disclaimer: This is not financial advice. Analysis is for educational purposes only; trade your own plan and manage risk.
Acronyms:
C - Composite
w - Weekly
m - Monthly
VAH - Value Area High
VAL - Value Area Low
VPOC - Volume Point of Control
LVN - Low Value Node
HVN - High Value Node
LVA - Low Value Area
SP - Single print
ATH - All time high