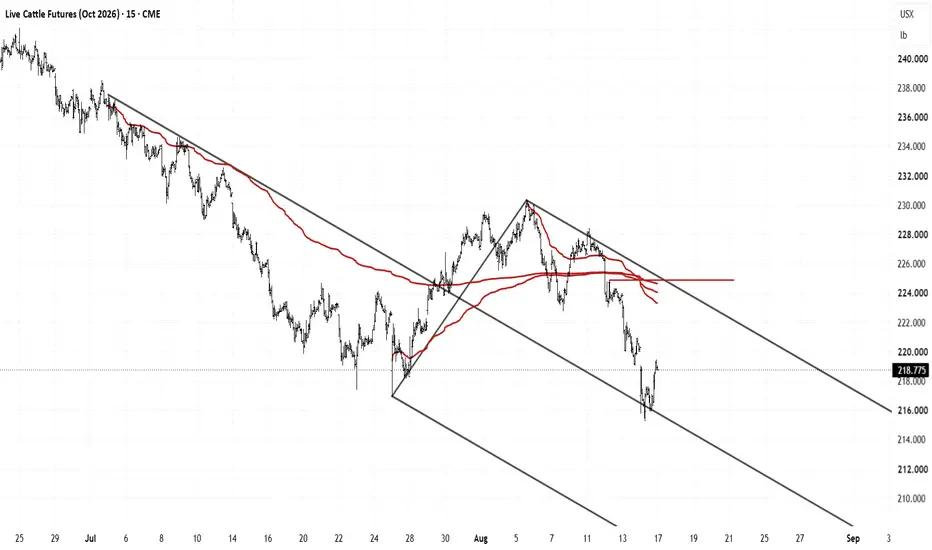
Selling Live Cattle - Asymmetric R/RI have no idea what the weekly or daily chart is doing, the plan here is for there to be a pullback toward the upper parallel to sell the 5m chart, the interval in which the signal was generated:
The stop will be according to the volatility of the moment, ideally within the permitted parameters (
Live Cattle Futures (Apr 2027)
No trades
No trades
Peers for comparison
Contract highlights
LE Short — Live cattle's bounce is just bait for the next leg doLive cattle futures are facing an aggressive selloff, with fundamental reports highlighting multi-month lows and heavy weekly losses. This fundamentally bearish backdrop perfectly complements the hourly failed breakout. Offering a compelling 3.23R to the downside without being extended, this is a hi
LE Short — Fading the bounce on this trainwreck as fresh multi-mThe fundamental 'trainwreck' narrative and recent four-month lows heavily support playing the downside. The 1h failed breakout provides an excellent technical trigger to fade any lingering post-COF bounce, yielding a clean 1.93R path back to structural support.
📍 Entry: 228.100
🛑 Stop: 230.875
🎯 Ta
LE Long — $LE pulling back to reclaimed support at 246.85 after On the 4-hour chart, Live Cattle has established a clear higher-high/higher-low structure off the late-May/early-June lows near 235, with price reclaiming the 246–248 congestion band that acted as resistance through much of April and May. The most recent 4h swing high sits near 250, and the current
Screwworm or Supply Cycle: What's Driving Cattle?The cattle market sits at record highs because of a historic supply squeeze, and the screwworm is amplifying that story rather than creating it. US herd inventory has fallen to a 75-year low, beef cow numbers are down about 285,000 head, feedlot placements dropped roughly 9.7% in May, and weekly sla
LE Long — $LE pulling back into the 246-247 shelf after recoveriOn the 4-hour chart, live cattle futures are in a recovery uptrend off the early-June low near 235, establishing a series of higher lows that now puts price back above the 246–247 zone — a level that was support in late April and early May before the mid-May breakdown. The current pullback from the
Momentum Shift with Nova Flow FreeNova Flow Free highlights clean momentum transitions and structure rotations using a non‑intrusive color logic.
This is the basic version of the tool, designed to provide clarity without noise and to help identify early trend changes.
For traders who need deeper filtering, multi‑mode logic and adva
LE - Live Cattle (4hr chart)I'm learning that few people turn their phone to landscape mode to see the chart replay. Use Desktop mode or an actual desktop computer.
Maybe when pigs fly?
Live Cattle are wandering down to the yearly level for cheaper pastures.
BS/FS levels are support unless solid lines
Inv. BS /inv. FS l
Cattle Prices Soar Amid Record-low Herd Size and Holiday DemandCME: Live Cattle Futures ( CME:LE1! )
CME live cattle futures market rallied last week. February 2026 contract rose $3.15 to settle at $227.15 (per 100 pounds) on Friday, gaining $9.30 or 4.63% on the week.
In the spot market, the National Daily Cattle & Beef Summary shows that the Weekly Average
See all ideas
Summarizing what the indicators are suggesting.
Neutral
Neutral
Neutral
A representation of what an asset is worth today and what the market thinks it will be worth in the future.
Displays a symbol's price movements over previous years to identify recurring trends.
Frequently asked questions
Today, LEJ2027 trades at 219.850 USX / LBR.
For broader market analysis, dive into the technicals on the LEJ2027 futures price chart and read the latest LEJ2027 news:
– Cattle Pull Off Friday Lows into the Weekend
– CME hogs hit contract lows, live cattle set 11-month low
– Livestock Futures Under Pressure From Cash Weakness — Market Talk
For broader market analysis, dive into the technicals on the LEJ2027 futures price chart and read the latest LEJ2027 news:
– Cattle Pull Off Friday Lows into the Weekend
– CME hogs hit contract lows, live cattle set 11-month low
– Livestock Futures Under Pressure From Cash Weakness — Market Talk
LEJ2027 volume is the number of futures contracts traded over a given period. The current volume is 16.75 K.
This metric helps you understand market activity and liquidity:
– Higher volume indicates strong interest and easier trade execution
– Lower volume may signal weaker participation and wider spreads
Traders often use volume to confirm trends and identify potential reversals. Track more movements on the LEJ2027 chart.
This metric helps you understand market activity and liquidity:
– Higher volume indicates strong interest and easier trade execution
– Lower volume may signal weaker participation and wider spreads
Traders often use volume to confirm trends and identify potential reversals. Track more movements on the LEJ2027 chart.
When to sell LEJ2027 futures depends on your strategy, risk tolerance, and market conditions. Traders often consider reducing or closing positions when:
– Profit targets are reached: Locking in gains after a favorable price move
– Technical signals weaken: Trend reversals, resistance levels, or bearish indicators emerge
– Expiration approaches: Some traders close or roll positions ahead of Apr 30, 2027 to maintain exposure in a later contract and avoid settlement
– Market conditions change: Shifts in macro trends, seasonality, or market sentiment may affect the outlook
Selling is often part of a broader trading and risk management plan rather than an attempt to time the market perfectly.
– Profit targets are reached: Locking in gains after a favorable price move
– Technical signals weaken: Trend reversals, resistance levels, or bearish indicators emerge
– Expiration approaches: Some traders close or roll positions ahead of Apr 30, 2027 to maintain exposure in a later contract and avoid settlement
– Market conditions change: Shifts in macro trends, seasonality, or market sentiment may affect the outlook
Selling is often part of a broader trading and risk management plan rather than an attempt to time the market perfectly.
One way to gain exposure to LEJ2027 is through a broker that offers futures. Before trading, make sure you understand how the product works and the risks involved.
You can trade LEJ2027 directly from TradingView:
– Choose a broker: Explore our supported trading partners and pick one that fits your needs
– Compare options: View available brokers side by side to evaluate fees and features
– Connect your account: Open Supercharts, click "Trade", select your broker, and log in
– Start trading: Place orders directly from the chart
Tip: If you're new to trading, try paper trading first — it lets you practice strategies in real market conditions without risking funds.
You can trade LEJ2027 directly from TradingView:
– Choose a broker: Explore our supported trading partners and pick one that fits your needs
– Compare options: View available brokers side by side to evaluate fees and features
– Connect your account: Open Supercharts, click "Trade", select your broker, and log in
– Start trading: Place orders directly from the chart
Tip: If you're new to trading, try paper trading first — it lets you practice strategies in real market conditions without risking funds.
No single indicator can determine whether to buy or sell LEJ2027 futures contracts. The right decision depends on market conditions, risk tolerance, and your trading strategy.
Here are a few factors to consider:
• Technical rating — sell: A summary of signals from multiple technical indicators that can help assess current market conditions.
• Seasonality: Historical price patterns that may recur due to factors such as production cycles, demand trends, or market behavior.
• Forward curve: The relationship between futures prices across different expiration dates, which can provide insight into market expectations and sentiment.
For a broader view, consider these metrics alongside price action, market news, and fundamental data.
Here are a few factors to consider:
• Technical rating — sell: A summary of signals from multiple technical indicators that can help assess current market conditions.
• Seasonality: Historical price patterns that may recur due to factors such as production cycles, demand trends, or market behavior.
• Forward curve: The relationship between futures prices across different expiration dates, which can provide insight into market expectations and sentiment.
For a broader view, consider these metrics alongside price action, market news, and fundamental data.
The nearest expiration date for LEJ2027 is Apr 30, 2027.
Futures contracts expire on predetermined dates. As expiration approaches, many traders roll positions into the next contract to maintain exposure to the market.
Key metrics to watch near expiration:
• Volume and liquidity: Trading activity often shifts to the next contract month
• Open interest: Falling open interest may signal positions being closed or rolled forward
• Forward curve: Differences between contract prices can help identify market structure, including contango and backwardation
Explore the LEJ2027 chart to monitor active contracts and contract-month activity.
Futures contracts expire on predetermined dates. As expiration approaches, many traders roll positions into the next contract to maintain exposure to the market.
Key metrics to watch near expiration:
• Volume and liquidity: Trading activity often shifts to the next contract month
• Open interest: Falling open interest may signal positions being closed or rolled forward
• Forward curve: Differences between contract prices can help identify market structure, including contango and backwardation
Explore the LEJ2027 chart to monitor active contracts and contract-month activity.
Open interest is the total number of active futures contracts that have not been closed or expired. For LEJ2027, the current open interest is 59.41 K.
Traders use open interest to assess trend strength and market participation:
– Rising price + rising open interest: New money is entering the market, trend may be strengthening
– Rising price + falling open interest: Positions are being closed, trend may weaken
– Falling price + rising open interest: Increasing short positions, bearish pressure may build
– Falling price + falling open interest: Positions are closing, trend may be losing momentum
Open interest is most effective when combined with volume and price action — track both on the LEJ2027 chart for deeper insight.
Traders use open interest to assess trend strength and market participation:
– Rising price + rising open interest: New money is entering the market, trend may be strengthening
– Rising price + falling open interest: Positions are being closed, trend may weaken
– Falling price + rising open interest: Increasing short positions, bearish pressure may build
– Falling price + falling open interest: Positions are closing, trend may be losing momentum
Open interest is most effective when combined with volume and price action — track both on the LEJ2027 chart for deeper insight.