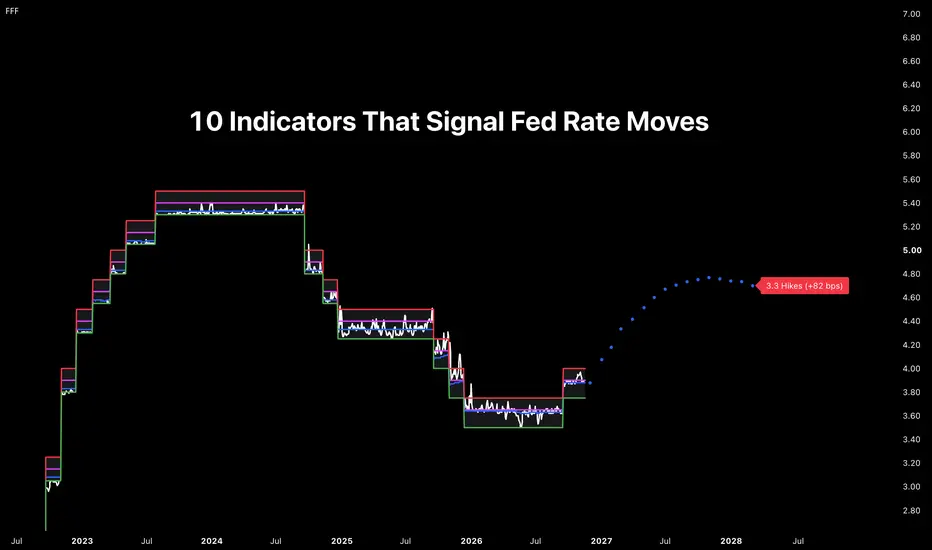
The 10 Indicators That Signal Where Rates Are HeadedIn this publication, we examine the Federal Reserve’s 2022 rate-hiking and 2024 rate-cutting cycles through the lens of 10 indicators. The first nine indicators are compared against their historical interquartile ranges during periods when the Trimmed Mean PCE Inflation Rate ( FRED:PCETRIM12M159SFRB
Peers for comparison
Revenge Trading Explained: Why It Happens and How to Stop ItYou get stopped out of a trade. A few minutes later, the market reverses and moves in the direction you originally expected. Frustrated, you jump back in, determined to make back what you lost. But that trade fails, too. Now you're taking another trade, increasing your position size, and looking for
MES and MNQ Return to Low-Volume Zones as Semis Lead the selloffMES and MNQ Return to Low-Volume Zones as Semiconductors Lead the Selloff
📊 SITCo | Monday Night Market Review
November 16, 2026 — Preparing for Tuesday
Monday’s selloff put both index futures back inside larger low-volume zones. The Nasdaq took the heavier hit as semiconductors broke lower, but s
MESZ Nov 17: Breakdown Below 7396 or Retracement Into 7457–7515?MESZ is trading around 7,426 after overnight consolidation, with price still below a major higher-time-frame imbalance.
For now, my bias is slightly bearish to neutral.
The main downside confirmation level is 7,396. A confirmed 1-hour or 4-hour close below this area could support continuation towa
ES Futures | Watching the 11 June Low at 7,232 for a Long ScalpToday’s level to watch on ES is 7,232.25, the major swing low formed on 11 June.
If price sweeps below that low, we’ll watch for a quick reclaim back above it. That would set up a potential swing failure pattern (SFP), and we’ll look for a long scalp if the reaction supports it.
If price breaks be
ES Futures | Potential Short at 7,517–7,520 Supply ZoneToday’s focus on ES is a potential short setup around 7,517–7,520, where several confluences come together:
- pdEQ at 7,517.
- Unfilled SP at 7,520.
- Previous demand, which could now act as supply on a retest from below.
Should price rally into this zone, we’ll monitor the reaction for signs of r
ES Futures | Potential Short Scalp at 7,680–7,691 ConfluenceToday on ES futures, we’re watching the 7,680–7,691 zone for a potential short scalp, with several factors lining up:
• pmVAL around 7,680.
• An unfilled SP just above at 7,691.
• Previous demand from last Wednesday and Thursday, which could now act as supply on a retest.
Should price trade into t
ES1! 4H | ICT / LIT / SMC | 16.11.20264H BIAS: BULLISH (CHoCH + BOS after the weekly M below Weekly Open)
• Sell-off: two bearish AMD cycles (M · P on Oct 28, M on Nov 4)
• Bottom: sell-side under the Nov 4 lows taken, then PWL
• Last week: A at the open, M below Weekly Open, D higher
• ES printed a higher high, NQ a lower high = SMT at
ES Leads the Rebound as NQ Tests Its Downtrend
📊 SITCo | Sunday Night Market Review
November 15, 2026 · Preparing for Monday
ES recovered more of the recent selloff than NQ, but cumulative volume delta (CVD) recovered only modestly before flattening. Both indices are now testing descending trendlines. Monday’s first question is whether buyers
See all ideas
A representation of what an asset is worth today and what the market thinks it will be worth in the future.
Displays a symbol's price movements over previous years to identify recurring trends.
Frequently asked questions
One way to gain exposure to ESU2018 is through a broker that offers futures. Before trading, make sure you understand how the product works and the risks involved.
You can trade ESU2018 directly from TradingView:
– Choose a broker: Explore our supported trading partners and pick one that fits your needs
– Compare options: View available brokers side by side to evaluate fees and features
– Connect your account: Open Supercharts, click "Trade", select your broker, and log in
– Start trading: Place orders directly from the chart
Tip: If you're new to trading, try paper trading first — it lets you practice strategies in real market conditions without risking funds.
You can trade ESU2018 directly from TradingView:
– Choose a broker: Explore our supported trading partners and pick one that fits your needs
– Compare options: View available brokers side by side to evaluate fees and features
– Connect your account: Open Supercharts, click "Trade", select your broker, and log in
– Start trading: Place orders directly from the chart
Tip: If you're new to trading, try paper trading first — it lets you practice strategies in real market conditions without risking funds.
The nearest expiration date for ESU2018 is Sep 21, 2018.
Futures contracts expire on predetermined dates. As expiration approaches, many traders roll positions into the next contract to maintain exposure to the market.
Key metrics to watch near expiration:
• Volume and liquidity: Trading activity often shifts to the next contract month
• Open interest: Falling open interest may signal positions being closed or rolled forward
• Forward curve: Differences between contract prices can help identify market structure, including contango and backwardation
Explore the ESU2018 chart to monitor active contracts and contract-month activity.
Futures contracts expire on predetermined dates. As expiration approaches, many traders roll positions into the next contract to maintain exposure to the market.
Key metrics to watch near expiration:
• Volume and liquidity: Trading activity often shifts to the next contract month
• Open interest: Falling open interest may signal positions being closed or rolled forward
• Forward curve: Differences between contract prices can help identify market structure, including contango and backwardation
Explore the ESU2018 chart to monitor active contracts and contract-month activity.