HOW-TO: Separate Climate Confirmation From Candle CloseThe word “confirmed” can cause confusion when reading an indicator beside a candlestick chart.
In AutoClimate™, climate confirmation describes a condition identified by the indicator. Candle close describes whether a particular price bar has finished forming.
These are separate questions. Understa
Peers for comparison
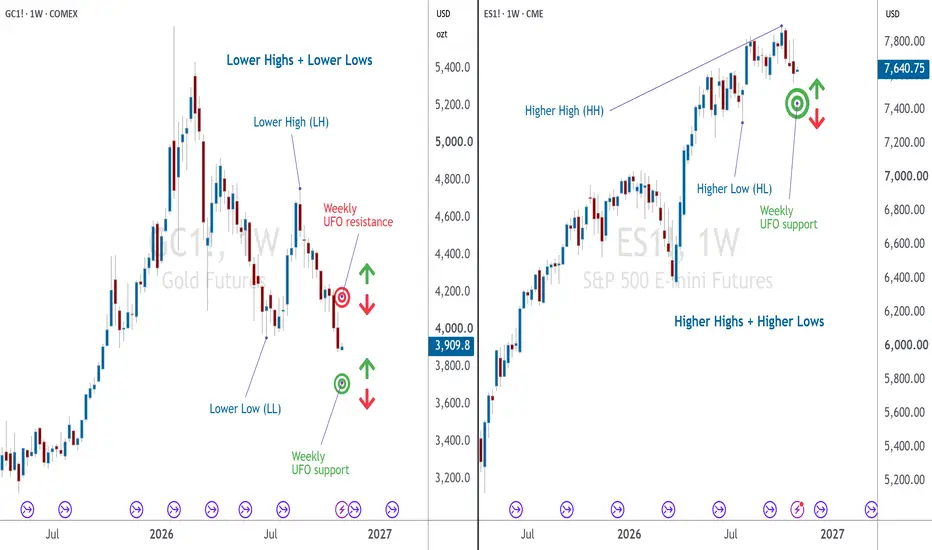
US Midterms: Same Direction, Different Market StructuresThe Same Price Direction Can Tell Two Different Stories
With the US midterm elections scheduled for November 3, 2026, traders are approaching another significant event on the economic and financial calendar. Although the outcome of the elections and the subsequent market reaction remain uncertain,
See The S&P 500’s Journey To All-Time HighsThe S&P 500 recently traded at new all-time highs, which represents a significant milestone in the history of markets. Currently, the S&P 500 is composed of the world’s largest and most influential companies. When it hits all-time highs, everyone pays attention.
To help you navigate this record-bre
AK Order Flow | S&P 500 Daily Map #5 | 7,672 vs 7,636Daily map for Monday 2 Nov. First session on US winter time: cash 14:30–21:00 UTC. ISM Manufacturing at 15:00 UTC, 30 minutes after the open.
📍 Where we are
ES ~7,654 at 11:30 UTC, about +41 points (+0.54%) over Friday's cash close 7,612.75 and right at the overnight high 7,659.25. NQ leads the bou
A Complete Guide to Trading Trends in FuturesTraders often believe that catching a trend is the holy grail of making money in the markets.
The reality is different. Even when prices move clearly in one direction for weeks or months, most retail traders still lose money.
The real question is simple. Why do so many people fail even when condit
$SPX The extreme bearish odds we saw over the past few weeks..📈 SP:SPX
The extreme bearish odds we saw over the past few weeks have now eased.
Short-term odds are roughly 50/50 for a strong bounce.
But even if we rally, I expect it to fail sooner or later, with the bears returning in force.
A bounce could be fueled by retail buying the historical midterm
Max Pain: Does the Magnet Actually Work?Reading time: 6–8 minutes
Data: 9 months (Jan–Oct 2026), 18 CME instruments
Method: Pearson & Spearman correlation between Max Pain and futures price at expiration
Instruments: Metals, Energy, Agriculture, Currencies, Crypto, Equity Indices
The Short Version
Weekly Max Pain works. Average correl
ES Futures: Potential Long Scalp at 7,688–7,689Today’s zone of interest on ES is 7,688–7,689, where two value area levels come together:
• 7,689: pdVAL still untested
• 7,688: pwVAL
Should price trade into this zone today, we’ll be watching for a possible reaction and a long scalp opportunity.
The entry will depend on how price reacts when th
MES Shorts Updates Where we going 7400ish Still Possible?MES is it possible for Sellers continue to gain control in price action. This Morning and Sunday Opening has returned price to the previous Buyers Level Area we broke below on Fri. evening. This Area 7700-7760ish is now a Seller Level. Current Price Action is in a Retest Phase to see if Sellers can
See all ideas
A representation of what an asset is worth today and what the market thinks it will be worth in the future.
Displays a symbol's price movements over previous years to identify recurring trends.
Frequently asked questions
One way to gain exposure to ESZ2022 is through a broker that offers futures. Before trading, make sure you understand how the product works and the risks involved.
You can trade ESZ2022 directly from TradingView:
– Choose a broker: Explore our supported trading partners and pick one that fits your needs
– Compare options: View available brokers side by side to evaluate fees and features
– Connect your account: Open Supercharts, click "Trade", select your broker, and log in
– Start trading: Place orders directly from the chart
Tip: If you're new to trading, try paper trading first — it lets you practice strategies in real market conditions without risking funds.
You can trade ESZ2022 directly from TradingView:
– Choose a broker: Explore our supported trading partners and pick one that fits your needs
– Compare options: View available brokers side by side to evaluate fees and features
– Connect your account: Open Supercharts, click "Trade", select your broker, and log in
– Start trading: Place orders directly from the chart
Tip: If you're new to trading, try paper trading first — it lets you practice strategies in real market conditions without risking funds.
The nearest expiration date for ESZ2022 is Dec 16, 2022.
Futures contracts expire on predetermined dates. As expiration approaches, many traders roll positions into the next contract to maintain exposure to the market.
Key metrics to watch near expiration:
• Volume and liquidity: Trading activity often shifts to the next contract month
• Open interest: Falling open interest may signal positions being closed or rolled forward
• Forward curve: Differences between contract prices can help identify market structure, including contango and backwardation
Explore the ESZ2022 chart to monitor active contracts and contract-month activity.
Futures contracts expire on predetermined dates. As expiration approaches, many traders roll positions into the next contract to maintain exposure to the market.
Key metrics to watch near expiration:
• Volume and liquidity: Trading activity often shifts to the next contract month
• Open interest: Falling open interest may signal positions being closed or rolled forward
• Forward curve: Differences between contract prices can help identify market structure, including contango and backwardation
Explore the ESZ2022 chart to monitor active contracts and contract-month activity.