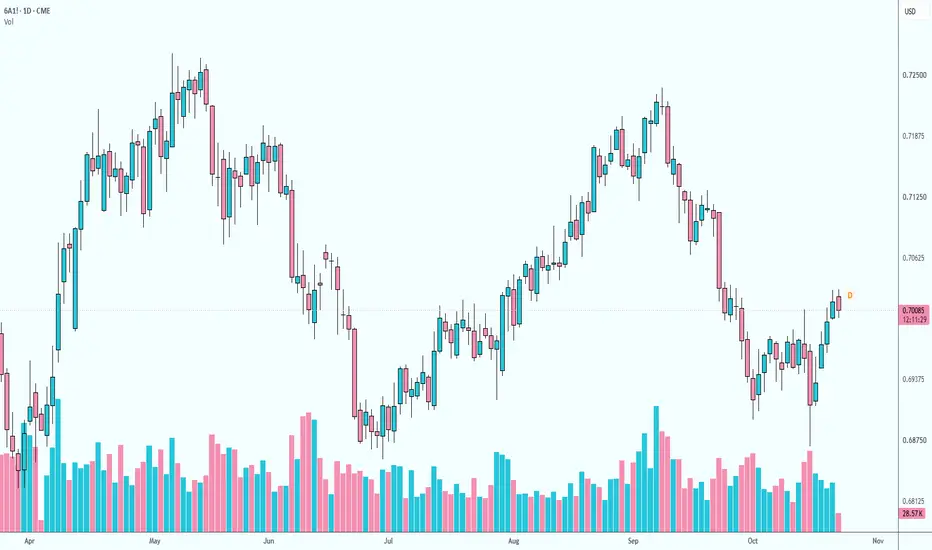
6A: Conditional Pullback From RBA Resistance6A has a conditional short setup if the post-election risk bounce stalls. Spot AUD/USD is holding the 0.70 handle on broad Dollar weakness, gold and equities, but the rebound is running into the same zone where the dovish RBA hike and institutional bearish views should cap momentum unless buyers can
Micro AUD/USD Futures (Dec 2026)
No trades
No trades
Peers for comparison
6A: RBA Repricing Turns Dips Into a Squeeze TestA conditional long 6A setup is still favoured if the next dip holds. Spot AUD/USD has absorbed weaker Asian equities while futures pricing has moved sharply toward a November RBA hike after hawkish inflation remarks, leaving shorts vulnerable rather than confirming a chase at current levels.
Where
Australian Dollar Futures: FOMC Trap Risk Around Aussie Stops6A remains a conditional short rather than a momentum chase.
Where the edge is
Market talk points to AU$1.3bn in spot expiries at 0.6935/40, with stop pockets above 0.6990 and below 0.6938. That structure can suppress conviction before the New York cut (10am ET), then leave the first post-event b
Aussie Dollar Braces for RBA Verdict as Fed Turns HawkishHawkish Crosscurrents: Fed Hike Meets RBA's Looming Test
The Aussie dollar heads into the final week of September caught between two central banks that have both turned more hawkish than markets expected just a month ago. On September 16, 2026, the Federal Reserve raised its benchmark rate by 25 b
𝗪𝗘𝗘𝗞𝗟𝗬 𝗔𝗡𝗔𝗟𝗬𝗦𝗜𝗦 | 𝗔𝗨𝗗 𝗙𝗨𝗧𝗨𝗥𝗘𝗦 |𝗪𝗘𝗘𝗞𝗟𝗬 𝗔𝗡𝗔𝗟𝗬𝗦𝗜𝗦 | 𝗔𝗨𝗗 𝗙𝗨𝗧𝗨𝗥𝗘𝗦 | 𝟯𝟭.𝟬𝟴. – 𝟬𝟰.𝟬𝟵.𝟮𝟬𝟮𝟲
As mentioned in my last post, the 𝗨𝗦𝗗 𝗿𝗲𝗺𝗮𝗶𝗻𝘀 𝗯𝘂𝗹𝗹𝗶𝘀𝗵.
Looking at the 𝗔𝗨𝗗 𝗙𝘂𝘁𝘂𝗿𝗲𝘀, this creates an interesting potential 𝗦𝗛𝗢𝗥𝗧 𝗦𝗖𝗘𝗡𝗔𝗥𝗜𝗢 𝗳𝗼𝗿 𝗔𝗨𝗗/𝗨𝗦𝗗.
But why am I looking for shorts?
First, let’s look at the 𝗙𝗨𝗡𝗗𝗔𝗠𝗘𝗡𝗧𝗔𝗟 𝗣𝗜𝗖𝗧𝗨𝗥𝗘.
𝟭. 𝗦𝗘𝗔𝗦𝗢𝗡𝗔𝗟𝗜𝗧𝗬
𝗪𝗘𝗘𝗞𝗟𝗬 𝗔𝗡𝗔𝗟𝗬𝗦𝗜𝗦 — 𝟲𝗔𝟭! 𝗔𝗨𝗗 𝗙𝗨𝗧𝗨𝗥𝗘𝗦𝗪𝗘𝗘𝗞𝗟𝗬 𝗔𝗡𝗔𝗟𝗬𝗦𝗜𝗦 — 𝟲𝗔𝟭! 𝗔𝗨𝗗 𝗙𝗨𝗧𝗨𝗥𝗘𝗦
📅 𝟮𝟰.𝟬𝟴. – 𝟮𝟴.𝟬𝟴.𝟮𝟬𝟮𝟲
The 𝗔𝗨𝗗 𝗙𝘂𝘁𝘂𝗿𝗲𝘀 has had an impressive run, with 𝟴 𝗰𝗼𝗻𝘀𝗲𝗰𝘂𝘁𝗶𝘃𝗲 𝗯𝘂𝗹𝗹𝗶𝘀𝗵 𝘄𝗲𝗲𝗸𝘀.
Price is now approaching an 𝗼𝗹𝗱 𝗵𝗶𝗴𝗵 from May 29th.
This level is located within a 𝗗𝟭 𝗙𝗩𝗚, with a 𝗪𝟭 𝗢𝗿𝗱𝗲𝗿 𝗕𝗹𝗼𝗰𝗸 just above it.
So what do the 𝗳𝘂𝗻𝗱𝗮𝗺𝗲𝗻𝘁𝗮𝗹 𝗱𝗮𝘁𝗮 te
Long trade
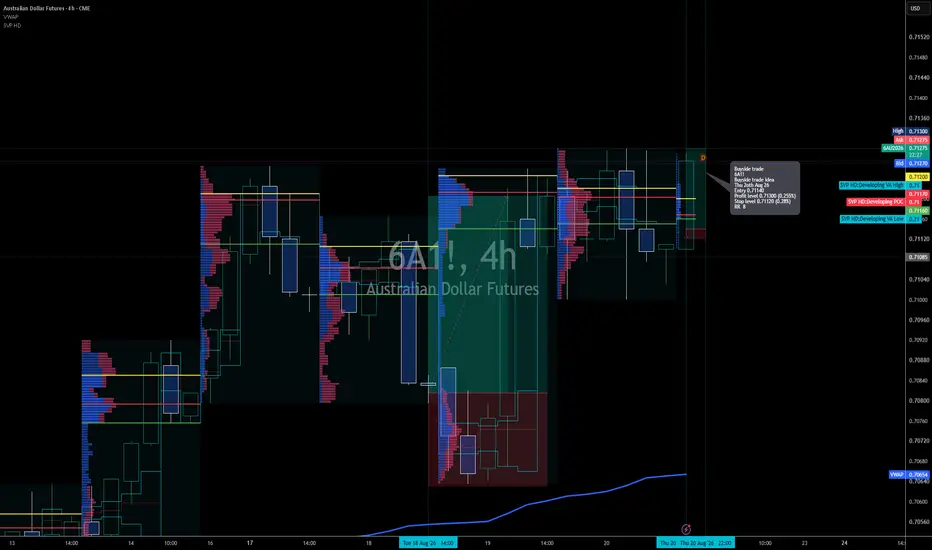
📊 6A1! AUSTRALIAN DOLLAR FUTURES — UPDATED POC READ
Direction: 🟢 Buyside
Entry: 0.71140
Stop: 0.71120
Target: 0.71300
RR: 8R
POC / Value Map
Developing VA High: ~0.7120
Developing POC: ~0.7117
Developing VA Low: ~0.7116
Entry: 0.71140
Current price: ~0.7128
Target: 0.71300
Value Narrative
The se
𝗔𝗨𝗗 𝗙𝘂𝘁𝘂𝗿𝗲𝘀 (𝟲𝗔𝟭!) 𝗪𝗲𝗲𝗸𝗹𝘆 𝗢𝘂𝘁𝗹𝗼𝗼𝗸 𝗔𝗨𝗗 𝗙𝘂𝘁𝘂𝗿𝗲𝘀 (𝟲𝗔𝟭!) 𝗪𝗲𝗲𝗸𝗹𝘆 𝗢𝘂𝘁𝗹𝗼𝗼𝗸 | 𝗔𝘂𝗴𝘂𝘀𝘁 𝟭𝟬–𝟭𝟰, 𝟮𝟬𝟮𝟲
Similar to almost all major currencies against the USD, **AUD Futures have been bullish against the USD over the past two weeks**.
From the recent low, price has moved approximately **200 pips higher**.
Price has now slightly touched a **bear
AUDUSD Short Trade Using Supply and DemandAUD Analysis:
Technicals:
- Price inside daily supply.
Sentiment/Fundamentals:
- COT adding into shorts + closing longs.
- Recent Manufactuing + Services have been good + Unemployment stayed same.
- AUD Inflation data coming out Tuesday.
OVerall:
- Still short from the 1hr supply created mentione
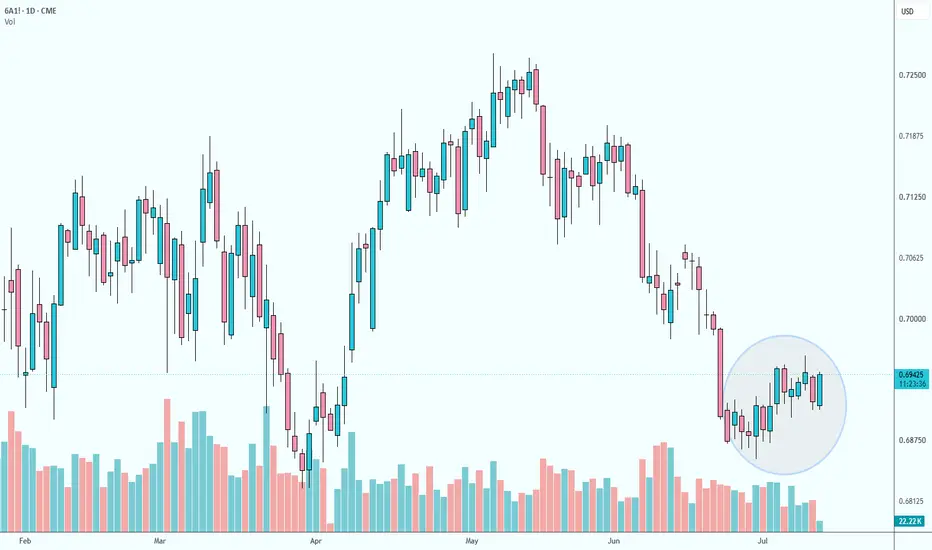
US CPI Can Release Compressed Volatility6A offers an active volatility trade rather than a directional call. Neutral momentum, divided positioning and conflicting macro forces leave the break's direction unresolved, but US CPI provides a credible catalyst for the compressed range to expand.
Where the edge is
Recent range compression ha
See all ideas
Summarizing what the indicators are suggesting.
Neutral
Neutral
Neutral
A representation of what an asset is worth today and what the market thinks it will be worth in the future.
Frequently asked questions
Today, M6AZ2026 trades at 0.6750 USD.
For broader market analysis, dive into the technicals on the M6AZ2026 futures price chart and read the latest M6AZ2026 news:
– Australia, NZ dollars hit new multi-month lows as yield support vanishes
– Yen steady against euro and dollar after soft Japanese GDP data
– Australian dollar plumbs 10-month lows as US yields keep climbing
For broader market analysis, dive into the technicals on the M6AZ2026 futures price chart and read the latest M6AZ2026 news:
– Australia, NZ dollars hit new multi-month lows as yield support vanishes
– Yen steady against euro and dollar after soft Japanese GDP data
– Australian dollar plumbs 10-month lows as US yields keep climbing
M6AZ2026 volume is the number of futures contracts traded over a given period. The current volume is 1.73 K.
This metric helps you understand market activity and liquidity:
– Higher volume indicates strong interest and easier trade execution
– Lower volume may signal weaker participation and wider spreads
Traders often use volume to confirm trends and identify potential reversals. Track more movements on the M6AZ2026 chart.
This metric helps you understand market activity and liquidity:
– Higher volume indicates strong interest and easier trade execution
– Lower volume may signal weaker participation and wider spreads
Traders often use volume to confirm trends and identify potential reversals. Track more movements on the M6AZ2026 chart.
When to sell M6AZ2026 futures depends on your strategy, risk tolerance, and market conditions. Traders often consider reducing or closing positions when:
– Profit targets are reached: Locking in gains after a favorable price move
– Technical signals weaken: Trend reversals, resistance levels, or bearish indicators emerge
– Expiration approaches: Some traders close or roll positions ahead of Dec 14, 2026 to maintain exposure in a later contract and avoid settlement
– Market conditions change: Shifts in macro trends, seasonality, or market sentiment may affect the outlook
Selling is often part of a broader trading and risk management plan rather than an attempt to time the market perfectly.
– Profit targets are reached: Locking in gains after a favorable price move
– Technical signals weaken: Trend reversals, resistance levels, or bearish indicators emerge
– Expiration approaches: Some traders close or roll positions ahead of Dec 14, 2026 to maintain exposure in a later contract and avoid settlement
– Market conditions change: Shifts in macro trends, seasonality, or market sentiment may affect the outlook
Selling is often part of a broader trading and risk management plan rather than an attempt to time the market perfectly.
One way to gain exposure to M6AZ2026 is through a broker that offers futures. Before trading, make sure you understand how the product works and the risks involved.
You can trade M6AZ2026 directly from TradingView:
– Choose a broker: Explore our supported trading partners and pick one that fits your needs
– Compare options: View available brokers side by side to evaluate fees and features
– Connect your account: Open Supercharts, click "Trade", select your broker, and log in
– Start trading: Place orders directly from the chart
Tip: If you're new to trading, try paper trading first — it lets you practice strategies in real market conditions without risking funds.
You can trade M6AZ2026 directly from TradingView:
– Choose a broker: Explore our supported trading partners and pick one that fits your needs
– Compare options: View available brokers side by side to evaluate fees and features
– Connect your account: Open Supercharts, click "Trade", select your broker, and log in
– Start trading: Place orders directly from the chart
Tip: If you're new to trading, try paper trading first — it lets you practice strategies in real market conditions without risking funds.
No single indicator can determine whether to buy or sell M6AZ2026 futures contracts. The right decision depends on market conditions, risk tolerance, and your trading strategy.
Here are a few factors to consider:
• Technical rating — sell: A summary of signals from multiple technical indicators that can help assess current market conditions.
• Forward curve: The relationship between futures prices across different expiration dates, which can provide insight into market expectations and sentiment.
For a broader view, consider these metrics alongside price action, market news, and fundamental data.
Here are a few factors to consider:
• Technical rating — sell: A summary of signals from multiple technical indicators that can help assess current market conditions.
• Forward curve: The relationship between futures prices across different expiration dates, which can provide insight into market expectations and sentiment.
For a broader view, consider these metrics alongside price action, market news, and fundamental data.
The nearest expiration date for M6AZ2026 is Dec 14, 2026.
Futures contracts expire on predetermined dates. As expiration approaches, many traders roll positions into the next contract to maintain exposure to the market.
Key metrics to watch near expiration:
• Volume and liquidity: Trading activity often shifts to the next contract month
• Open interest: Falling open interest may signal positions being closed or rolled forward
• Forward curve: Differences between contract prices can help identify market structure, including contango and backwardation
Explore the M6AZ2026 chart to monitor active contracts and contract-month activity.
Futures contracts expire on predetermined dates. As expiration approaches, many traders roll positions into the next contract to maintain exposure to the market.
Key metrics to watch near expiration:
• Volume and liquidity: Trading activity often shifts to the next contract month
• Open interest: Falling open interest may signal positions being closed or rolled forward
• Forward curve: Differences between contract prices can help identify market structure, including contango and backwardation
Explore the M6AZ2026 chart to monitor active contracts and contract-month activity.
Open interest is the total number of active futures contracts that have not been closed or expired. For M6AZ2026, the current open interest is 3.11 K.
Traders use open interest to assess trend strength and market participation:
– Rising price + rising open interest: New money is entering the market, trend may be strengthening
– Rising price + falling open interest: Positions are being closed, trend may weaken
– Falling price + rising open interest: Increasing short positions, bearish pressure may build
– Falling price + falling open interest: Positions are closing, trend may be losing momentum
Open interest is most effective when combined with volume and price action — track both on the M6AZ2026 chart for deeper insight.
Traders use open interest to assess trend strength and market participation:
– Rising price + rising open interest: New money is entering the market, trend may be strengthening
– Rising price + falling open interest: Positions are being closed, trend may weaken
– Falling price + rising open interest: Increasing short positions, bearish pressure may build
– Falling price + falling open interest: Positions are closing, trend may be losing momentum
Open interest is most effective when combined with volume and price action — track both on the M6AZ2026 chart for deeper insight.