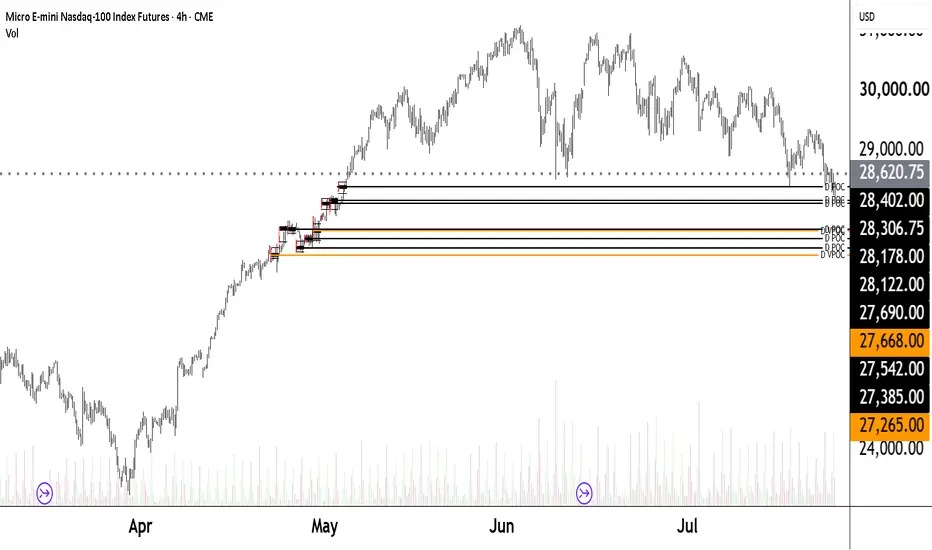
NQ Range (07-20-26)NAZ is in a No Trade Zone (NTZ), wait until breakout of 29,00-28,400. The O/N is playing in the upper half of Friday range. While the current position is a potential U Turn Zone or Buy, the NAZ is trying to get back inside the Churn Zone. Any rejection near KL 632 would be a Short, KL 28,230 to TLX 27,840 would be Long on a hold. The lower yellow arrow is 2026 Open level. Not expecting a hit of yellow arrow, just keep on your radar. Limited updates intraday this week and after Wednesday as I will be out. NDX update, NAZ is in mid range of a potential 14% drop should it try for 200 MA and under Orange TL.
This is basically the 4th or 5th hit near lower CZ, any BO under may head south with some force, Pop here may set up a decent Short set up should it stall out. BTD/FOMO, Go WH Tweets for those that have early access.
In-depth trading ideas
The WalkDownThe WalkDown peice is at a key lev
When price hits a key level of resistance and begins a WalkDown (a structured step-by-step decline characterized by lower highs and lower lows), it signals that supply is firmly taking control over demand.
Here is a breakdown of how to validate, time, and execute a WalkDown setup off resistance.
1. Key Validation Steps
To confirm a true WalkDown rather than a brief pullback or a liquidity trap before a breakout:
Initial Rejection at Resistance: Look for a clear liquidity sweep or sharp rejection tail at the higher-timeframe (HTF) resistance zone or supply block.
Market Structure Shift (MSS / CHoCH): A lower-timeframe break of the key higher-low (the last swing low that drove price into resistance).
Supply Hold: Price must fail to make a new high on subsequent retests, turning previous micro-supports into new resistance (Support/Resistance flip).
2. WalkDown Execution Framework
HTF Resistance / Supply Zone --------------------------
/\
/ \ (Liquidity Sweep / Rejection)
/ \
(Lower High Retest / Entry) -> \ / \
\ / \
(Lower High Retest / Entry) ---> \ / \
\ / \---> Downside Targets
A. Entry Triggers
Micro-FVG / Supply Retest: Enter short on pullbacks into lower-timeframe Fair Value Gaps (FVG) or order blocks created during the leg down.
Breakdown Continuation: Enter on a candle close below the most recent lower swing low with rising sell volume.
B. Risk Management
Stop Loss (SL): Positioned just above the local Lower High (aggressive) or above the main HTF Resistance level (conservative).
Invalidation: A clean candle close above the most recent lower high invalidates the WalkDown structure.
C. Profit Targets (TP)
TP1 (Scaling): The nearest opposing lower-timeframe demand level or micro-swing low.
TP2 (Primary): Key HTF demand zone, daily low, or unvisited sell-side liquidity pool below.
3. Checklist Before Taking the Trade
Has price explicitly touched or swept the key resistance zone?
Has lower-timeframe structure flipped bearish (Lower Low established)?
Is the pullback offering a high R:R entry at a Lower High / Supply block?
Are key downside liquidity targets clearly defined below?el of resistanxe so look for the walkDown
Ascending wedge setup right below the previous day's highThis ascending wedge forming right below the previous day's high could lead to a neat breakout.
The trick is to be patient until the breakout happens and you get the retest before putting on the risk.
There's also some decent distance to the target area to make a profit!
NQ UpdateNQ is almost oversold, we probably see another bounce when that happens. Not sure if it really matters with the Fed meeting coming up on Wed. If the Fed tanks the market then you have no exit plan if you go long on anything.
Now we know chip stocks influence the market (especially tech heavy Nasdaq) more than oil. Not to mention oil might bounce back up....
Too late to short anything today though, wait for the bounce. If you are short, I'd stay short.
Fairness TestGlobex 195-point gap up
no bottom wick = initiative buying
London tightened & compressed overnight structure
NY tagged VWAP & bounced = fairness test
NY confirms the upper area 648 -763 fair and balanced
If Ny goes lower this will not necessarily be bearish
It will be NY establishing a lower balance
Three prior microbalances combine into one 690 - 732.
If PX reclaims & hinges atop 732 = bullish.
Haven't heard of any bombing over the weekend.
Market likes that.
Durable goods reported at 08.30 ET.
Typically doesn't affect MNQ/NQ in a big way unless it is a big miss of expectations.
Usually, if in line with expectations, MNQ/NQ will wiggle & resume with its premarket behavior.
Update NY ETH sweeps on your chart.
Trade the sequence
IF sweep THEN reclaim
IF reclaim THEN hinge
IF hinge THEN Break
IF break THEN trade setup is valid
Pullback entry: Lip, lip shelf and/or apex shelf
15s bars
Bears flip the script.
OHM Scenario-1 BTO Hinge will be posted after the fact.
They happen fast.
I can't possibly post it in real time. Wish I could.
Check back and see if you accurately identified it.
NQ Weekly Outlook: Higher Again? | 27–31 July 2026The Fringe Cycles model read for the coming week suggests a positive-leaning structure, with four positive session biases and only one negative-bias session.
This outlook is based on the NQ Globex session, not only regular cash-session price action.
Monday, 27 July: Positive Bias
Early strength, followed by hesitation, consolidation, or a temporary pullback.
Tuesday, 28 July: Negative Bias
Tuesday is the only negative-bias session of the week. Weakness or consolidation early, followed by the possibility of a developing reversal later in the session.
Wednesday, 29 July: Positive Bias
The model returns to a positive bias on Wednesday. A continuation of Tuesday’s developing reversal and renewed upward price action.
Thursday, 30 July: Positive Bias
A positive broader tendency accompanied by possible intraday reversals or hesitation.
Friday, 31 July: Positive Bias
Continuation of the midweek recovery, with the possibility of a higher finish into the end of the week.
Disclaimer:
This post is for educational, research, and review purposes only. It is not financial advice, investment advice, trading advice, a trade signal, or a recommendation to buy, sell, enter, exit, or hold any financial instrument. Futures trading involves substantial risk. Readers are responsible for their own decisions, risk management, and due diligence. Past performance does not guarantee future results.
Deep Dive: Trade the SequenceThree Layers:
1. Auction logic
2. Scenario validation
3. Entry protocol
Refined version of "Trade the Sequence"
1. Auction Logic
*A. IF sweep THEN reclaim
**a. sweep = information i.e. buyers entered
**b. reclaim = decision bar
**c. no reclaim = no trade
*B. IF reclaim THEN hinge
**a. reclaim proves sellers failed
**b. hinge = compression
**c. no hinge = no structure
*C. IF hinge THEN break
**a. break indicates direction
**b. break validates the scenario
**c. no break = no trade
*D. IF break THEN trade setup is valid
**a. break must close above the lip
**b. break must show displacement
2. Scenario Validation
*A. Validate the scenario before trading the sequence
**a. is it Scenario-1 (S-1)?
**b. is it Scenario-2 (S-2)?
**c. is it Scenario-3 (S-3)?
*B. Break quality
**a. break MUST show displacement
**b. reclaim bar is NOT a break bar
*C. Shelf integrity
**a. shelves must remain intact
**b. if shelves break the sequence resets
3. Entry Protocol (hierarchy)
*A. Primary entry = lip pullback
**a. most reliable
**b. highest R/R
**c. cleanest continuation
*B. Secondary entry = lip shelf
**a. slightly weaker
**b. still valid
**c. works best in Scenario-1 (S-1)
*C. Tertiary entry = apex shelf
**a. only valid when apex shelf is tight
**b. works best in Scenario-3 (S-3)
Scenario-1 (S-1) BTO requirements
1. Sweep Order (the structural requirement)
*A. First there must be a buy-side sweep
**a. during Globex session - 18.00.00 - 19.59.59
**b. during Asian session - 20.00.00 - 02.59.59
**c. during London session - 03.00.00 - 05.59.59
**d. during NY ETH session - 06.00.00 - 09.29.59
**e. at the 09.30.00 Open or shortly thereafter
**f. Can be shallow
**g. does not require a high-top wick
**h. sometimes has no wick at all
2. Second there must be a sell-side sweep
*A. S-1 hard time rule
**a. must happen at 09.30.00
**b. must happen no later than 09.45.00
*B. Can be shallow or no wick at all
3. Hard time rule: 09.30.00 - 09.45.00
*A. 09.30.00 - 09.45.00
**a. volatility is highest
**b. sweeps are shallow
**c. reclaims are fast
**d. apex shelves are tight
**e. lip shelves are tight
**f. breaks are explosive
*B. 09.45.01 = S-2
IF you find this beneficial
THEN please check back.
To this post will be added in the "add note" section:
1. OHM Scenario-2 (S-2) requirements
2. OHM Scenario-3 (S-3) requirements
Deep Dive Focus: In-depth look at one concept
Daily Focus: Overnight sweeps, key PX shelves, OHM scenarios, hinge/break trade setups
Teaching Principle: Correct Mechanics + Correct Structure + Correct Logic = Correct Trade
POSSIBLE FORECAST NQU2026 WEEK 27-31 JULY 2026We had have a lot of very good forecastings lately, the markets show us an bearish scenario and keep it so we are going to keep that prospective in mind, this week we are going to have NFP news so do not trade on Thursday and Firday New York session, Therefore the price leves that we are going to target are 28212 and 27000 yes, that short, Keep in mind that in this week we have a lot of news that can probably change the price path, so avoid news hours and wait
3 trades and im outFirst trade, I shouldve got out at $450-$500, market was up and down today, really hard to figure out which direction it wanted to go because it was retesting the hell out of a KEY LEVEL which was producing dojis all around the board. I secured a trade and profited $450 to end the day. I kept saying "IM GOING TO GET OUT AT $500", but never did it. I eventually listened to myself and then the market crashed as soon as I secured my trade.
Moral of the story, Listen to your gut and what you are saying.... Because most likely you are right. When you get to a point where you stop listening to yourself, you start to lose trades.
Who are you going to listen to if you cant even listen to yourself?
$QQQ something like this would make perfect sense QQQ something like this would make perfect sense based on historical price action.
Think of the purple line as a thread. Once price reaches it, it's like cutting that thread with a razor blade.
NASDAQ:QQQ AMEX:SPY NASDAQ:NVDA NASDAQ:AAPL NASDAQ:MSFT NASDAQ:AVGO #TechnicalAnalysis #PriceAction #SwingTrading #NASDAQ #SP500
Trading the Stock, Not the MarketIndex futures have been the default hedge for an equity portfolio for years. Liquid and traded around the clock, they offer straightforward counter-exposure across a range of equity positions. That approach falls short, though, when an index cannot match a stock’s unique risk profile necessitating more precise instruments.
To fill this gap, CME Group is introducing single stock equity futures onto the same trading infrastructure as its flagship E-Mini and Micro E-Mini US index future. Starting from 27/July, the exchange lists 55 standard equity futures alongside 22 micro futures.
This paper walks through what CME Group’s new Single Stock futures make possible, using two episodes – the launch of DeepSeek R1 (January 2025) and Palantir’s addition to the S&P 500 – to show where index-based hedges fall short and where trading the stock directly works better.
Less Capital, Longer Access
The launch of DeepSeek in January 2025 triggered a market selloff in semiconductor firms as investors feared the disruption to hardware demand from more efficient AI models. Nasdaq-100 futures fell by 4.7% over the weekend. On Monday, when US equity markets opened, Nvidia was almost 17% lower.
The event introduces two limitations – the unhedgeable risk while equity markets were inactive and the significantly higher beta of the stock during a correction.
That same exposure through single stock futures circumvents both risks. Standard Nvidia futures provide exposure equivalent to 100 shares of the stock and the micro Nvidia futures to 10 shares. Both futures contracts trade from 5PM to 4PM CT, Sunday through Friday, with just a one-hour daily break. The advantages extend beyond extended trading though, futures can significantly improve capital efficiency with minimum margin requirement of 15%, allowing traders to achieve the same underlying exposure with less capital outlay.
100 Nvidia shares at 24/Jan/2025 close of $142.61 represents notional of $14,261. 1x standard NVDA futures would provide equivalent exposure with minimum margin of around $2,140.
Hedging the Company Instead of Its Beta
Without a directly listed single-stock future, an investor would hedge Nvidia exposure with Nasdaq-100 futures. We described how in a previous paper . Beta hedging reduces broad index risk to technology stocks, but its effectiveness depends on the stock holding its beta through stress events.
The DeepSeek shock shows how that relationship can break.
The chart shows a payoff for a long 300 share Nvidia position hedged with 2 MNQ contracts (targeting a beta of 2x). Despite the much larger MNQ notional, the hedge is insufficient for the idiosyncratic move.
Shorting three NVDA futures instead would have targeted the same 300 shares. Based on the underlying stock move, the futures hedge would have offset close to the full loss. Traders no longer need to estimate how much index exposure replicated Nvidia’s changing beta. The hedge would simply follow the company being hedged exactly.
This applies even more around earnings. Earnings moves are almost always idiosyncratic – driven by the company’s own performance, with only an indirect effect on the index. For earnings hedges, traders can retain the stock while carrying a temporary short futures position, then remove the hedge after the release without selling and rebuilding the cash holding. The hedge can be adjusted all the way past the end of the extended equity session.
Cleaner Relative-Value Trades
Futures also make another family of trades a lot more accessible to traders – relative value spreads between a company and an index.
For example, a bearish view on Nvidia relative to the Nasdaq could be expressed by shorting three NVDA futures and buying one MNQ future. The two legs, running during the DeepSeek window, with closely matched notionals are illustrated below. By Monday’s close, the position would have gained approximately $6,018 as Nvidia underperformed the broader index.
Without single stock futures, this exposure is relatively complex and requires borrowing costs and access to equity shorting. With futures, obtaining this exposure is straightforward.
Relative-value trades are common around index rebalancing. We covered this in our past paper in detail. For example, S&P Dow Jones Indices announced Palantir’s addition to the S&P 500 after the close on 6/Sept/2024. PLTR rose 14.0% the following session, while ES gained 1.5%. By 20/Sept, just before the inclusion took effect, PLTR was up 22.6% against a 6.6% gain in ES.
A near-notional-matched position of 9 x long PLTR futures against 1 x short MES futures would have gained around $4,402 over that period. The spread isolates much of the inclusion-driven outperformance while reducing the portfolio’s dependence on the direction of the wider market.
Single Stock futures also simplify outright shorts. Selling physical shares can require specialized access and expose traders to variable borrowing costs. A futures seller does not arrange a separate borrow. Expected dividends, financing and implied borrowing costs are instead reflected in the difference between the futures and cash prices.
Single Stock futures do more than replicate equity exposure with less capital. They extend the trading day, replace approximate index hedges with direct company exposure and turn cash-versus-index trades into cleaner futures spreads. In each case, the trader is holding the risk that actually matters - the stock’s - and can act on it the moment it moves.
This content is sponsored.
MARKET DATA
CME Real-time Market Data helps identify trading setups and more effectively express market views. If you have futures in your trading portfolio, you can check out on CME Group data plans available that suit your trading needs at tradingview.com/cme .
DISCLAIMER
This case study is for educational purposes only and does not constitute investment recommendations or advice. Nor are they used to promote any specific products, or services.
Trading or investment ideas cited here are for illustration only, as an integral part of a case study to demonstrate the fundamental concepts in risk management or trading under the market scenarios being discussed.
HOW TO TRADE PROP FIRMS CFDS USING END OF DAY TRADING! PART 2 Hello so today I wanted to make follow up video explaining the drawdown in this Prop Firm Challange. Now in Part 2 we have a live trade on NQ or Nasdaq 100 so I will show you why I took the trade that was suggested.
Also some strategies we can use for trade management like lowering your risk once the trade moves in your favor. Also tyring to find the best realistic profit target to give you the best chance of passing.
In this CFD Challange for 50k the drawdown is $3500 but the profit target is $5k. Always remember that its not the entry that but the exit that counts!
Enjoy!
Good Luck & Always use Risk Management!
(Just in we are wrong in our analysis most experts recommend never to risk more than 2% of your account equity on any given trade.)
Hope This Helps Your Trading
Clifford
RISK DISCLOSURE
TRADING IN THE FUTURES AND FOREX MARKET INVOLVES SIGNIFICANT RISK. ALWAYS CONSULT A FINANCIAL ADVISOR AS HIGH RISK ASSET CLASSES MAY NOT BE SUITABLE FOR ALL INVESTORS. THIS IS NOT A RECOMMENDATION TO BUY OR SELL ANY ASSETS. ALL IDEAS ARE MADE FOR EDUCATIONAL PURPOSES. PAST PERFORMANCE DOES NOT GUARANTEE FUTURE RESULTS.
CFTC RULE 4.41 – HYPOTHETICAL OR SIMULATED PERFORMANCE RESULTS HAVE CERTAIN LIMITATIONS. UNLIKE AN ACTUAL PERFORMANCE RECORD, SIMULATED RESULTS DO NOT REPRESENT ACTUAL TRADING.
( NQ ) BUY SETUP The market is approaching a strong demand zone after an extended bearish move price is showing signs of exhaustion , and buyers may step in for a potential reversal . A confirmed bounce from the current support area could trigger a bullish continuation towards the next resisrtance .
Entry : 28.350
Target : 28.700
Stop loss :28.100
Follow Your trading plan and about emotional dissicions .Not Be patience , Be save .
Weekly Analysis and Reaction Locations [2026-07-20]NQ violated the swing low, which is an early confirmation that price might continue lower mid-term. A break — a close below the violation — is still needed to confirm the continuation, but the analysis already gives me a valid pullback target.
Right at that pullback target sits an algorithmic reaction zone, which adds weight to the location. The current downtrend's volume profile also has its POC around the same pullback target. Volume, the value-based reaction zone, and the algorithmic reaction zone all lining up at one location gives me a high-probability spot for a swing trade.
PD reference points add more weight to the directional read. A break higher puts the high volume node in as the main reference, with the new swing high as invalidation for continuation lower. A break lower confirms the continuation and marks the upper PD reference as sub-structure high.
Monday's high is the reference I'm using to monitor the pullback.
Grab the chart or zoom out on the preview to see all zones.
Trade Idea
Short on the overlapping price where the value-based reaction zone and the algorithmic reaction zone meet. Risk reference is the upper PD reference. Final target is the swing low.
Shared for educational and analytical purposes only — not financial advice or a trade recommendation. Entries, stops, and targets are shown for study, not signals to copy.
NQ UpdateES is almost oversold but the market isn't gaining any traction. Aside from oil exploding up, NQ hasn't hit oversold yet and this has mostly been a tech rally so far.
I was assuming that they were going to pump the market up with INTC earnings, but not so sure now. Maybe INTC drops, NQ goes oversold tomorrow then we get a bounce.
NQ one hour Bouncing off support. +1,119 ticks to targetThe NQ one hour time frame is in a down channel. The market
hit the bottom of the channel and created an up trend with an
up Fibonacci with a bullish Fibonacci extension price point 29447.00
about +1,119 ticks above the market. As long as the market does not
take our the Fibonacci one boundary price point 28408.25. It is
expected the market to push bullish toward the Fibonacci extension.
Entry: Counter trend line break bullish (ideally at 28898.75 or below,
That is when the reward is larger than the risk).
STOP: 28376.25
LIMIT: 29447.00
Another entry idea: If the risk off the one hour time frame is too large.
It will be a good idea to turn to the smaller time frame and look for
long ideas with less risk.
Memory VaultMicrobalance(mb) that behaves like a fortress.
Its shelves act as S/R even before the mb forms.
The auction doesn't care that the mb was drawn 7/21.
It's a new structure with an old memory.
It's part of numerous past hinges.
All MBs are Memory Holes.
Only the strongest are vaults.
MB must have:
clear upper shelf
clear lower shelf
multiple rotations inside
clean acceptance inside
clean rejection outside
For the most part use 5m bars to identify these.
If PX returns, rotates, launches
You have a Memory Hole.
Every Memory Hole is a hole the auction must play through.
To the left is its fairway.
It even has its own tee box.
PX is stored securely inside a Memory Vault a la Fort Knox.
Update overnight session sweeps.
Globex: 18.00 - 19.59.59
Asia: 20.00 - 02.59.59
London: 03.00 - 05.59.59
NY: 06.00 - 09.29.59
Trade the Sequence:
IF sweep THEN reclaim
IF reclaim THEN hinge
IF hinge THEN break
IF break THEN trade setup is valid
Entry(ies):
lip
lip shelf
apex shelf
Correct Mechanics + Correct Structure + Correct Logic = Correct Trade
Practice + Patience = Payoff
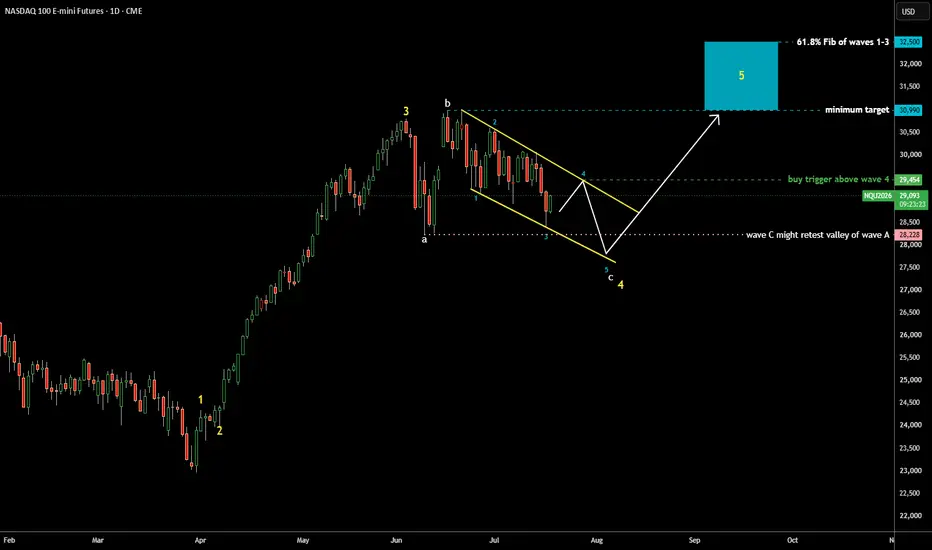
Nasdaq 100 Futures Update: Flat CorrectionTriangular consolidation posted earlier was invalidated
The structure transformed into a flat correction ABC
Waves A and B are done
Wave C looks like an Ending Diagonal with waves 1-3 out of 5 completed
Wave 4 of C is expected to move up to hit the upside of the downtrend
Wave 5 of C shall follow to retest the valley of wave A at $28,228
Minimum target for large yellow wave 5 is unchanged at the peak of wave 3 at $
is preliminary set at $30,990
Next target is preliminarily set at $32,500 but should be recalculated once large yellow wave 4 is over
Bullish trigger shall be set at the top of upcoming blue wave 4 of C
London Inside AsiaCompression
Value Defense
Buyer-seller equilibrium
NY will decide:
1. up
2. down
3. more compression
Massive compression from ~12 hinges on 7/23
5/04 VPOC, 28402.25 is holding
S-2 Deep-Tier Hinge floor 28483, lip 505.75
S-2 Deeper-Tier Hinge floor 28432.5 lip 28471
The overnight compression is not new compression.
It is a continuation of yesterday's massive compression.
Everything is inside yesterday's hinge ladder.
VWAP shows compression.
Trade the Sequence
IF sweep THEN reclaim
IF reclaim THEN hinge
IF hinge THEN break
IF break THEN trade setup is valid
Be sure to add NY ETH sweeps. (06.00.00 - 09.29.59)
Ignore the 28615 Asian sweep.It isn't supposed to be there. But it may act as S/R.
Pivots 28520 & 28557 are also holding value.
Swing Trade MNQ/NQShort version IF-THEN Atomic Logic Chain
IF a sharp pullback sweeps a structural level
THEN wait for a reclaim
IF a reclaim occurs
THEN wait for descending-value acceptance (1 - 3 descending hinges)
IF descending-value acceptance forms
THEN enter in descending value inside the hinge(s)
Scale out into the impulse leg.
Example:
7/17 was a sharp pullback and reclaim.
7/20 had five laddered descending hinges
7/21 had five laddered descending hinges all higher than the 7/20 hinges
These ten descending hinges represented buyers defending value not sellers in control.
It was a controlled compression above the sweep low of 7/17.
After each individual hinge was fully formed, meaning the break bar formed, then you would buy in descending value. I usually buy the lip and buy in descending value of 10 points, or 20 points or whatever.
IF a 2nd lower hinge fully forms and breaks I do likewise and so on.
Had you done so you would have had a number of contracts. The ideal time to exit all would have been when PX reached the microbalance 29280 - 29340.
Hopefully this is clear. Come back and look again. Most likely more will be added to this post in order to make it crystal clear.
The main principles are this:
1. Sharp pullback
2. Reclaim
3. Buyers defend a new lower value
It occurred to me that I almost exclusively focus on day trading MNQ/NQ.
I have touched upon swing trading but not in much detail.
The last several days have presented an ideal example to illustrate this swing trading plan.
IF it seems unclear THEN I have failed to explain it clearly.
That's on me not you.
Therefore, I shall try harder to make this crystal clear.