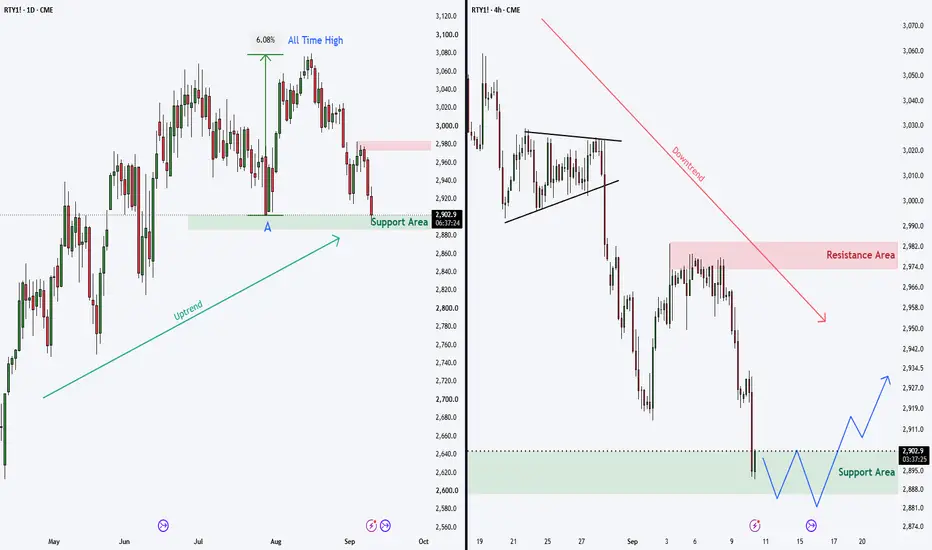
When the Target Is Too Close, Change the TimeframeA chart pattern can identify a possible direction. It cannot tell us whether the trade built around that direction offers enough room to justify the risk.
That distinction becomes especially important when a pattern appears technically valid, yet an important support or resistance area sits much cl
Compare with E-mini Russell 2000 Index Futures (Jun 2023)
RTY1! - Why complicate things?Went short Sept 10 (Dec contract pricing shown), there's the stop as of now... sizing is KEY, but not for thee..... not here anyway :-)
When you start trading a proven system, you stop worry about the utter nonsense that prevents most traders from winning....
When stops need to be moved, I'll updat
RTY1! / RUSSELL 2000 Multiple Timeframes
RTY1! Multiple Timeframe Analysis:
On the Daily chart (LEFT), we can see that this price zone (A) previously acted as support and led to a strong +6% move to a new all-time high. The Daily chart is still in an uptrend.
However, the 4H chart (RIGHT) is trending steadily lower, and at the moment
Elliott Wave View: Russell 2000 (RTY) Impulse Set to Extend HighThe short‑term Elliott Wave view in Russell 2000 (RTY) shows that the rally from the June 9, 2026 low is unfolding as a five‑wave impulsive structure. From that low, wave ((i)) concluded at 3068.4, followed by a corrective pullback in wave ((ii)) which ended at 2903.26. The one‑hour chart highlights
Russell 2000 : The Market’s Risk Thermometer The Russell 2000 remains one of the clearest gauges of genuine risk appetite across the market.
Following a strong recovery and a retest of the all-time high area, a healthy correction is now expected before the broader bullish move can continue. This setup aims to take advantage of that potential
Beyond the Mega-Caps: The 2026 Small-Cap SurgeStandard market benchmarks are not evenly weighted. In the S&P 500, the 10 largest companies account for roughly 37% of the index's value, while in the Nasdaq they represent closer to 45%. When these indices lead a rally, benchmark performance is disproportionately influenced by sentiment toward the
See all ideas
A representation of what an asset is worth today and what the market thinks it will be worth in the future.
Displays a symbol's price movements over previous years to identify recurring trends.
Frequently asked questions
The nearest expiration date for E-mini Russell 2000 Index Futures (Jun 2023) is Jun 16, 2023.
Traders prefer to sell futures contracts when they've already made money on the investment, but still have plenty of time left before the expiration date. Thus, many consider it a good option to sell E-mini Russell 2000 Index Futures (Jun 2023) before Jun 16, 2023.