Stay Short Dont AbortThe market and stocks always do what they’re supposed to do, but never when they’re supposed to do it.”Stocks are bouncing this morning as “Tourist Traders” believe what the financial-TV JJ’s are telling them: Thursday’s and Friday’s sell-off was overdone, and a powerful new tech rally has begun. N
Peers for comparison
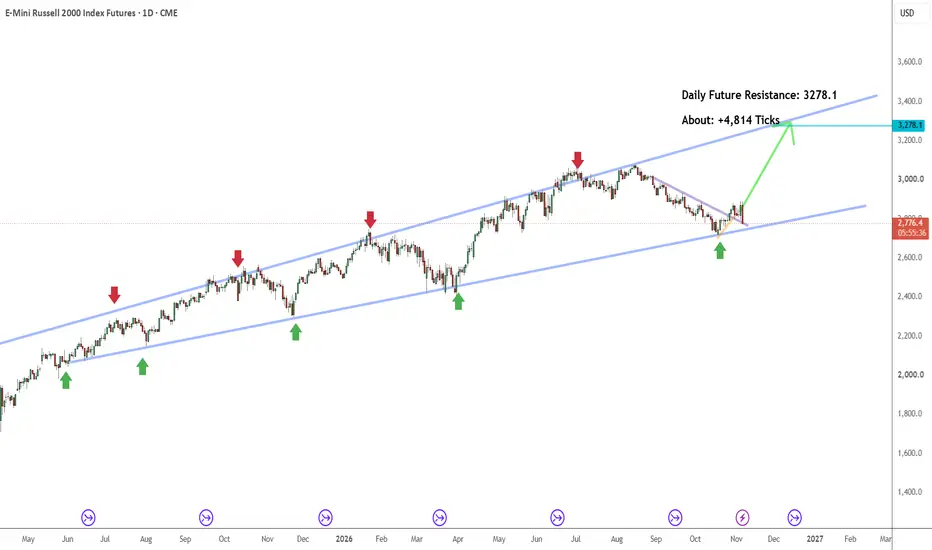
Requested M2K Chart BrakdownHey @buttkickerroll, here is your requested M2K chart!
We are currently tracking the exact same structural setup across MNQ and all major indices. Price has pulled up into the premium 61.8% to 78.6% Fibonacci retracement zone, where it is now actively compressing into a clear symmetrical triangle.
RTY1! - Why complicate things?Went short Sept 10 (Dec contract pricing shown), there's the stop as of now... sizing is KEY, but not for thee..... not here anyway :-)
When you start trading a proven system, you stop worry about the utter nonsense that prevents most traders from winning....
When stops need to be moved, I'll updat
When Fibonacci Levels Cluster Inside Price ZonesFibonacci retracements are widely used to identify potential support and resistance levels. But what happens when several Fibonacci measurements, calculated from different price swings, converge within the same price zone?
This phenomenon, often called Fibonacci confluence or Fibonacci nesting, can
When the Target Is Too Close, Change the TimeframeA chart pattern can identify a possible direction. It cannot tell us whether the trade built around that direction offers enough room to justify the risk.
That distinction becomes especially important when a pattern appears technically valid, yet an important support or resistance area sits much cl
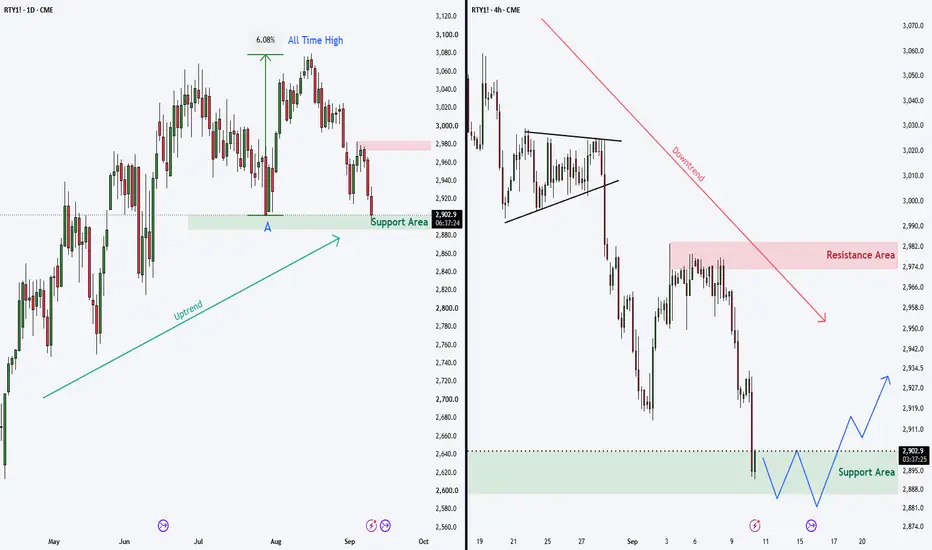
RTY1! / RUSSELL 2000 Multiple Timeframes
RTY1! Multiple Timeframe Analysis:
On the Daily chart (LEFT), we can see that this price zone (A) previously acted as support and led to a strong +6% move to a new all-time high. The Daily chart is still in an uptrend.
However, the 4H chart (RIGHT) is trending steadily lower, and at the moment
See all ideas
A representation of what an asset is worth today and what the market thinks it will be worth in the future.
Displays a symbol's price movements over previous years to identify recurring trends.
Frequently asked questions
One way to gain exposure to RTYU2024 is through a broker that offers futures. Before trading, make sure you understand how the product works and the risks involved.
You can trade RTYU2024 directly from TradingView:
– Choose a broker: Explore our supported trading partners and pick one that fits your needs
– Compare options: View available brokers side by side to evaluate fees and features
– Connect your account: Open Supercharts, click "Trade", select your broker, and log in
– Start trading: Place orders directly from the chart
Tip: If you're new to trading, try paper trading first — it lets you practice strategies in real market conditions without risking funds.
You can trade RTYU2024 directly from TradingView:
– Choose a broker: Explore our supported trading partners and pick one that fits your needs
– Compare options: View available brokers side by side to evaluate fees and features
– Connect your account: Open Supercharts, click "Trade", select your broker, and log in
– Start trading: Place orders directly from the chart
Tip: If you're new to trading, try paper trading first — it lets you practice strategies in real market conditions without risking funds.
The nearest expiration date for RTYU2024 is Sep 20, 2024.
Futures contracts expire on predetermined dates. As expiration approaches, many traders roll positions into the next contract to maintain exposure to the market.
Key metrics to watch near expiration:
• Volume and liquidity: Trading activity often shifts to the next contract month
• Open interest: Falling open interest may signal positions being closed or rolled forward
• Forward curve: Differences between contract prices can help identify market structure, including contango and backwardation
Explore the RTYU2024 chart to monitor active contracts and contract-month activity.
Futures contracts expire on predetermined dates. As expiration approaches, many traders roll positions into the next contract to maintain exposure to the market.
Key metrics to watch near expiration:
• Volume and liquidity: Trading activity often shifts to the next contract month
• Open interest: Falling open interest may signal positions being closed or rolled forward
• Forward curve: Differences between contract prices can help identify market structure, including contango and backwardation
Explore the RTYU2024 chart to monitor active contracts and contract-month activity.