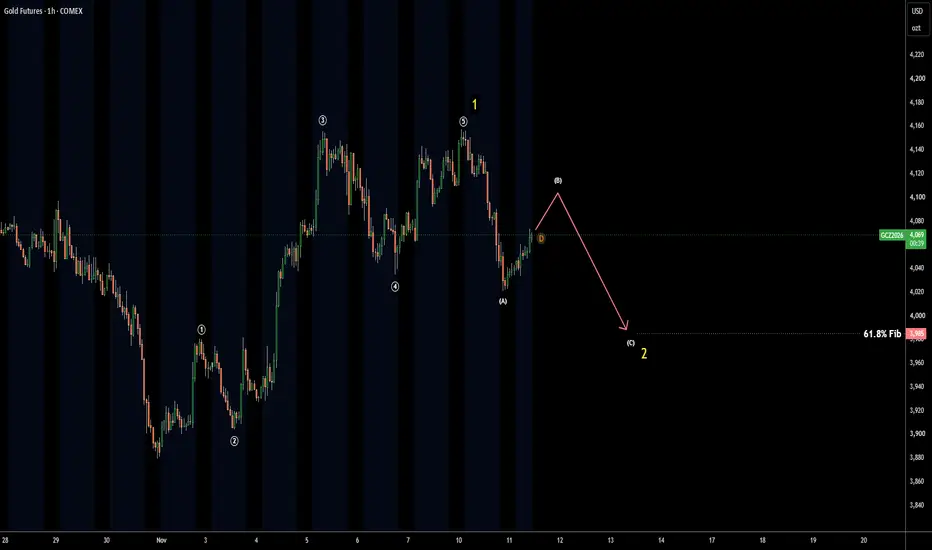
Gold Hourly Chart: First Correction gold has same structure as silver on hourly
it only looks more smooth as large players are there
compared to more volatile silver
wave has been retraced within the first correction of wave
the latter has wave A done and wave B in progress
wave C might follow to hit the classic 61.8% Fibonacci retracement level at $3,985
In-depth trading ideas
MGC (Gold) | Bullish SFP + BISI | Liquidity Target 4116MGC (Micro Gold Futures) – 1H Bullish Setup
My current bias on Gold is bullish, based on liquidity, price action, and ICT concepts.
Technical Confluences:
1. Sell-Side Liquidity Sweep (SFP): Price swept the previous swing low around 4047 and reclaimed the level, suggesting a potential bullish reversal.
2. Bullish BISI: A bullish imbalance around 4058–4064 provides a potential support zone for continuation higher.
3. Liquidity Draw: My upside objective is the buy-side liquidity resting above r
Will Gold Futures Redefine Global Wealth in 2026?Geopolitics and Geostrategy
Global fragmentation has transformed gold futures into indispensable instruments of sovereign statecraft. Central banks keep accumulating physical bullion at a strong pace to counter sanctions risks. Developing nations actively establish alternative payment architectures using gold to bypass currency embargoes. Ongoing tensions across Eurasia and the Middle East keep geopolitical risk premiums high. Sovereign wealth funds turn to liquid futures contracts to hedge geo
Gold (GC) Analysis, Key-Zones, Setup for Fri (Nov 06)Bias: The December gold contract settled at 4,113.5 on Thursday, up 40.5 or 0.99 percent, after trading between 4,155.8 and 4,067.0, a higher high and a higher low against Wednesday and the second consecutive higher settle. The 4,113.5 settle is the highest since 10/21/26, and it is the first settle above the 20-day settlement average since 09/03/26. The high came early, in the 10:30 PM ET bar on Wednesday evening, and the contract traded between 4,085.6 and 4,145.3 across the cash hours, with
**GOLD FUTURES – WEEKLY ANALYSIS | NOVEMBER 9–13, 2026****GOLD FUTURES – WEEKLY ANALYSIS | NOVEMBER 9–13, 2026**
Gold swept the sellside liquidity below the market and subsequently reacted with strong bullish displacement.
During this upward move, price left behind an **H4 Fair Value Gap (FVG)**, which is also located within the **OTE (Optimal Trade Entry) zone**.
This creates an interesting scenario for the upcoming week.
A retracement into the H4 FVG could offer a potential buying opportunity. The key will be to observe whether price delivers a
Gold Is Bearish-Neutral, Waiting For CPI & PPI NewsIn this Weekly Market Forecast, we will analyze Gold for the week of Nov 9 - 13th.
Gold (XAU/USD) enters the coming week with a mixed-to-cautious outlook, leaning slightly bearish-to-neutral as traders await key US inflation data (Consumer Price Index and Producer Price Index).
Personally, I am waiting for a bullish BOS before I consider buys. Until then, I'll be patiently waiting for a valid sell setup.
Enjoy!
May profits be upon you.
Leave any questions or comments in the comment section.
Gold Rebound Meets Hot CPI, Fed RepricingUSD bulls gained traction on Tuesday following hawkish Fed comments and a firm CPI report bolstered hike bets, weighing on gold. While seasonality may be on gold bulls side the nearer we get to mid December, its facing pressure for now - with bears eyeing a fresh break of 4000 over the near term.
MS
Gold 1H: Rally into 4148-4156 swing highs, a break confirmsGold opened the week with a 69-point push from 4074.3 to 4143.3 and is holding near 4129, just under the 4147.7-4155.8 swing highs. A clean break there makes a higher high off the 3879 low; a rejection puts the 4082-4108 gap back in play.
Market structure
Daily is below the 50D (4219.8) and 200D (4497.9) but back above the 20D (4079).
1H: 3879.3 low, 4155.8 high, 4035.1 higher low on Friday, now pressing back up.
Sunday's open left a bullish FVG at 4082.2-4107.8.
Key levels
Resist
Does Volume Confirm a Breakout? 2,807 Breakouts Tested"Wait for volume to confirm the breakout." Almost every trading book says it. But how much volume is enough, and does it actually change anything? I tested it on 12 futures markets.
THE TEST
- Markets: S&P 500, Nasdaq, Dow, Russell 2000, gold, silver, copper, crude oil, natural gas, 10-year Treasury notes, euro and corn futures. All with real exchange volume, daily bars, 2010 to today.
- Breakout: a daily close above the 20-day high or below the 20-day low. At least 5 days since the previous br
Gold (GC) 1H: Break Above 4,097 Runs Into 4,160–4,175 SupplyMarket structure
Daily: downtrend from the 4,755 August high to the 3,879.30 low on Oct 30.
1H: higher lows at 3,904.10, 3,928.20 and 4,067, with higher highs through 3,981.70 and 4,081.20.
Tonight's rally is trading above the 4,097.20 Oct 28 high. A daily close above it would confirm the shift.
Key levels
Resistance: 4,160–4,175, 4,208–4,220, 4,242.30
Support: 4,076–4,097, 4,067, 4,038, 3,969–4,007
Major lows: 3,928.20, 3,879.30
Bull case
Price holds 4,076–4,097.
Targets:
Gold 1H Premarket: Overnight Breakdown, 4076 Is the LineGold gave back all of Monday's afternoon rally overnight and is sitting just above the 4076.2 overnight low, under a fresh 1H bearish FVG. How it reacts at 4076 and 4096.7 into the 8:20 pit open is what I'm watching.
Market structure
Daily is still below the 50-day (4212) and 200-day (4493), though it is making higher lows off 3879.3.
On the 1H, overnight broke the 4109.1 pit low and 4117.2 swing low, so short-term structure is bearish.
The higher-timeframe higher low at 4035.1 is still
Gold (GC) Analysis, Key-Zones, Setup for Thu (Nov 05)Bias: The December gold contract settled at 4,073.0 on Wednesday, up 132.6 or 3.37 percent, after trading between 4,081.2 and 3,928.2; it was the largest one-session point gain since 08/05/26 and the highest settle since 10/27/26, and the contract settled at 94.6 percent of its range. The advance came in two legs, an overnight rise above 4,000 led by a 40.8 point gain in the 12:30 AM ET bar and a late-morning leg that made the high in the 1:00 PM ET bar. Wednesday printed a higher high and a hi
Deep Dive into Order Flow & Options OI : 3 NOV 2026📌 Deep Dive into Order Flow & Options OI: The Liquidity Map Tracking Smart Money in Gold (MGC1!)
In trading Gold Futures (GC1! / MGC1!) using Smart Money Concepts (SMC), the primary objective is not merely identifying standard candlestick patterns or traditional support and resistance levels. Instead, it lies in "reading institutional order accumulation footprints via Options Order Flow (OI & Volume)" to precisely map out BSL (Buy Side Liquidity) and SSL (Sell Side Liquidity) zones.
The overal
GOLD: The Sell Program Continues. Trade Accordingly!In this Weekly Market Forecast, we will analyze Gold for the week of Nov 2 - 6th.
Gold (XAU/USD) is heavily bearish heading into this week. Following a sharp algorithmic breakdown that took the metal below $3,900 at the end of October, higher timeframe order flow remains firmly under institutional sell program conditions.
Enjoy!
May profits be upon you.
Leave any questions or comments in the comment section.
I appreciate any feedback from my viewers!
Like and/or subscribe if you want more ac
Gold futures broke a big support level around $3970Gold futures broke a big support level around $3970
We might back test the $3588 area of next support
Important economic events coming up:
Nov 3 - US Midterm elections
Nov 4 - ADP Non-farm employment and EI oil inventories
Nov 5 - Jobless claims
Nov 10 - CPI data
December FOMC - There could be enough job losses from tech sector and the
FOMC could start to be dovish, which would turn gold around.
Seasonality favours gold in December and January
Gold futuresOver the past four weeks, gold futures extended their decline and hit a new 52-week low. Gold is also testing the $3,900 support level; a successful break below this mark would set a target toward the $3,000–$3,200 support zone—levels last seen in May of last year.
Long-term trend: Down
Resistance level: $4900
Support level: $3900-$4000
How to Pair Trade with Futures (S&P 500, Oil, Gold & More)Pair trading is one of the cleanest ways to express a view without relying on outright market direction. Instead of asking “will the market go up or down?”, you’re asking: which asset will outperform the other?
In futures, that edge becomes even sharper.
📌 What Is Pair Trading?
You go long on one futures contract and short another at the same time.
Example: long crude oil, short S&P 500. You’re betting oil will outperform equities, not just rise.
📌 Why Use Futures for Pair Trades?
T
Gold Bears Eye $3,880 as $4,000 Resistance LoomsGold prices broke decisively below 4,000 last week – killing off my assumption that bulls were quietly accumulating above that level. While prices recouped some of those losses on Monday, they remain below 4,000 – making it a pivotal level for traders over the near term.
The 1-hour chart shows prices holding above the weekly pivot point for now, but with the monthly pivot and weekly R1 sitting just above 4,000, bears may be seeking to fade rallies towards these levels. The near-term target is j
GOLD: $4,000 Lost — Could $3,400 Be Next?My weekly bias on gold remains bearish following the break below the previous weekly swing low and the $3,950 support zone. I’m now watching whether this area turns into resistance, potentially opening the way toward the demand zone around $3,350–3,450.
Since the early-year peak, gold has developed a sequence of lower highs. The summer recovery failed to reverse that structure, and the subsequent decline pushed through the $4,180–4,360 area before breaking the previous weekly low near $3,950.
P
Gold (GC) Analysis, Key-Zones, Setup for Wed (Nov 04)Bias: Updated at 10:15 PM ET Tuesday for the overnight session. The December gold contract settled at 3,940.4 on Tuesday, down 29.2 or 0.74 percent, after trading between 3,981.7 and 3,904.1. Tuesday printed a higher high and a higher low against Monday, but the settle gave back 29.2 of Monday's 70.7 gain, and over five sessions the contract is down 134.2. The session low came in the 4:00 AM ET bar and the high in the 8:30 AM ET bar, after which the contract eased into the 1:30 PM ET settle. Th
Gold Update 03NOV2026: Watch If $3,800 Holdsthis is an updated map
double three W-X-Y is still in progress
however, triangle in wave was invalidated
last impulse down within wave C of unfolds
it can hit $3,800 mark where wave C would be equal to wave A of
RSI shows no signs of divergence so we could see more downside
If $3,800 fails to hold the drop the price could retest the valley of lower
degree wave 4 at $3,300
GOLD WEEKLY OUTLOOKGold has completed a head and shoulders top on the daily chart, with four breaks of structure since the September high near $4,750. Sellers are firmly in control.
📍 POI : $4,120–4,220, where gold and silver have stopped moving together
🎯 Target : $3,955, the July lows and resting liquidity
⏳ Timeframe : 2–3 weeks
❌ View changes on a daily close above $4,220
The macro backdrop agrees. Oil near $100 is keeping rate-hike expectations alive, yields are near 5%, and speculators have cut their
Back to GTL track
COMEX_MINI:MGC1!
$3,990 – $4,000 (Psychological handle)
$3,920 – $3,950 (Prior breakout base)
current price below 200-day MA 4520
MACD for W chart : below zero level with red histrogram
RSI 5 < RSI 21 showing weakness in W chart
Are you buying for accumulation or pure trade ?
If the earlier , would you rather buy at this 'half-way' dip ? or wait for the sell-off ease ?
News are channeling and feeding messages around inflation data, Dec interest rate hike.
With risk-free tr