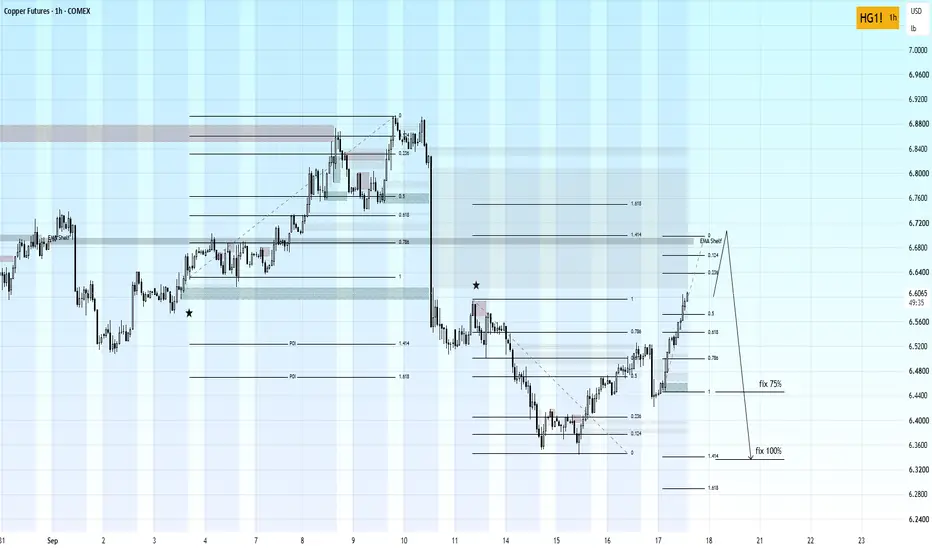
COPPER (HG) — REVERSAL SCENARIOCopper continues its bullish expansion toward the key Fibonacci POI between 1.414 and 1.618.
I expect price to first reach the 6.69–6.74 area, where I will be looking for confirmation of a bearish reaction and a potential reversal.
🎯 Targets after confirmation:
• Take 75% of the position near 6.45
• Close the remaining position near 6.34
I am not looking to enter short prematurely — the reaction inside the upper POI is essential. A confident consolidation above 1.618 would invalidate this bearish scenario.
Copper Financial Futures
No trades
No trades
In-depth trading ideas
Will Record Copper Futures Trigger a Global Energy Crisis?Macroeconomics and Economic Realities
Copper futures recently hit historic highs across major global exchanges. COMEX contracts touched a record $6.894 per pound on September 10. London Metal Exchange three-month contracts reached a record $14,858.50 per metric ton the same morning. LME copper has climbed about 19% in 2026 and roughly 48% over twelve months. Hours after that peak, futures fell more than 4% on reports that Washington had not decided on refined copper tariffs. That reversal reveals two forces at work: a genuine structural deficit and a fragile tariff premium. Global mine output fell 1.1% during the first half of 2026. High interest rates and inflation complicate capital expenditure for major mining operators. Meanwhile, non-discretionary industrial demand continues to outpace physical extraction capacity.
Geopolitics and Geostrategy
Resource nationalism increasingly dominates international copper trade and supply chain dynamics. Major producing nations like Chile and the Democratic Republic of Congo tighten domestic regulations. Goldman Sachs estimates disruption could put 200,000 tonnes of Chilean and 125,000 tonnes of DRC output at risk this year; together, that equals roughly 1.4% of global mined supply. Furthermore, trade policy friction creates significant volatility in global inventory distribution. Washington imposed 50% tariffs on semi-finished copper products in July 2025, excluding refined cathode and concentrate. Commerce is reviewing whether a 15% refined copper tariff should begin in 2027, rising to 30% in 2028. Consequently, traders moved massive copper stockpiles into domestic American COMEX warehouses. LME stockpiles fell for 42 consecutive days, the longest run of declines since 2014. Sovereign nations now treat refined copper as a critical national security asset.
High-Tech Industry Trends
Electrification and artificial intelligence drive unprecedented demand for physical red metal. Artificial intelligence data centers require massive power distribution infrastructure and dedicated transformers. Engineering teams utilize thick copper busbars to deliver megawatts of electrical power. Thermal constraints prevent operators from substituting lower-cost aluminum in high-density facilities. Simultaneously, utility companies modernize electrical grids to connect utility-scale renewable energy assets. Wind and solar installations consume four to six times more copper per megawatt than legacy power plants. These converging high-tech trends guarantee sustained long-term consumption growth.
Technology, Science, and Pharmaceuticals
Copper plays a pivotal role across modern material science and medical technology. Advanced semiconductor manufacturing leverages high-purity copper interconnects to accelerate processing speeds. In pharmaceutical settings, copper's innate antimicrobial properties provide continuous biological surface protection. Medical facilities install specialized copper alloy surfaces to eliminate healthcare-associated pathogen transmission. Furthermore, high-performance computing clusters utilize copper cold plates to dissipate massive thermal heat load. Thus, copper remains an essential physical element bridging physical computing hardware and biological sciences.
Business Models and Leadership
Major mining corporations face a dramatic shift in commercial pricing power. Spot treatment and refining charges plummeted into negative territory for Asian metallurgical smelters. Miners now dictate terms to intermediate processors desperate to secure scarce raw concentrate. Freeport-McMoRan declared force majeure at its Grasberg operation and cut 2026 output guidance. Executive leadership across the sector prioritizes operational efficiency over aggressive output expansion. Mining executives cut non-essential capital spending while optimizing existing Tier-1 assets. Rising energy costs compound the pressure, since a 10% oil price increase lifts mining costs by 3.5%. Constrained shipping through the Strait of Hormuz keeps diesel and process inputs expensive. Custom smelters absorb the squeeze while low-cost extractors expand margins.
Company Culture and Cybersecurity
Modern mining operations embrace digital transformation and automated extraction technology. Autonomous haulage fleets and remote control rooms define modern company culture at Tier-1 mine sites. Engineers collaborate across international offices to monitor real-time pit operations and processing run rates. However, heavy reliance on connected internet-of-things sensors elevates severe industrial cybersecurity risks. Cybercriminals increasingly target critical infrastructure, automated conveyor systems, and remote refining controls. Mining leaders prioritize hardware-level cybersecurity encryption to safeguard physical operations and international supply chains.
Patent Analysis and Future Outlook
A detailed patent analysis highlights extensive corporate innovation in hydrometallurgy and solvent extraction. Leading miners hold valuable patents in heap leaching technologies and low-grade ore processing. Advanced processing patents enable extractors to recover valuable metal from previously unusable tailings. These proprietary chemical processes protect operating margins as natural ore grades decline globally. Will current copper futures records push industrial consumers past their financial breaking point? While the tariff premium may unwind, fundamental supply constraints ensure high long-term price floors. Copper remains the irreplaceable backbone of global electrification.
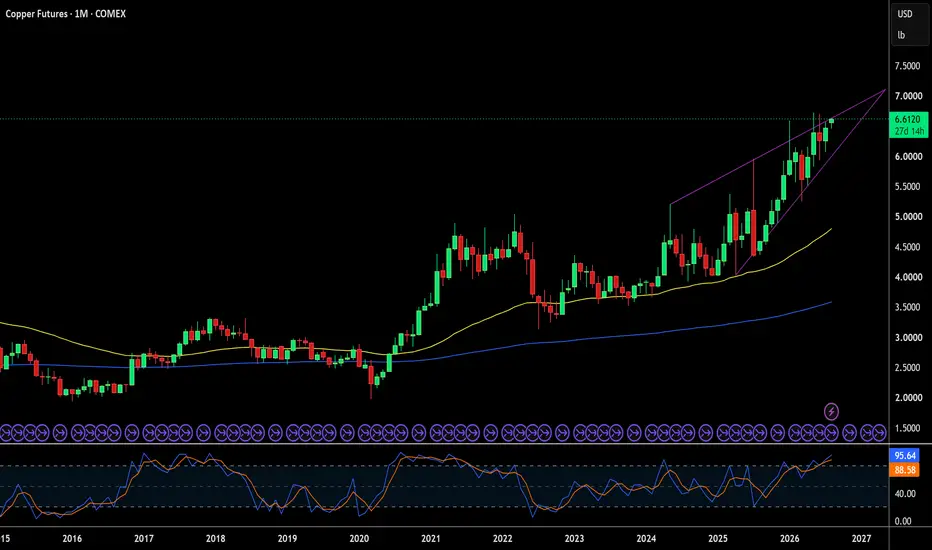
COPPER 10-year Channel flashing major Sell Signal.Copper (HG1!) has been trading within a 10-year Channel Up since the January 2016 market bottom and is currently on the latest and strongest Bullish Leg of this pattern. This has already entered the 0 - 0.236 Fibonacci range, which has been the Zone that formed both previous Higher Highs (Tops).
Those Tops formed after +71.09% and +102.14% Bullish Legs and initiated Bearish Leg corrections. If the current Bullish Leg is also +31% stronger than the previous one, then we can see Copper rise up to +133% in total before it tops.
Regardless of that, every correction since 2018 (with the exception of the early 2020 COVID flash crash, which was a non-technical black swan event), hit the 1M MA50 (blue trend-line), before bottoming marginally below it (blue circles).
As a result, our Target is the 1M MA50 and we expect the price to hit it around $5.250 before bottoming. On a 12-month horizon, that would also fall at the top of the 0.786 - 1.0 Fibonacci range of the Channel Up, which has historically been its most efficient Buy Zone.
---
** Please LIKE 👍, FOLLOW ✅, SHARE 🙌 and COMMENT ✍ if you enjoy this idea! Also share your ideas and charts in the comments section below! This is best way to keep it relevant, support us, keep the content here free and allow the idea to reach as many people as possible. **
---
💸💸💸💸💸💸
👇 👇 👇 👇 👇 👇
Copper: reading a chart where the zone layer has nothing to sayThe last time this chart had a built area underneath it, copper traded near 3.70.
It trades near 6.72 today. Between those two prices sit 661 daily bars in which our structure layer stamped nothing at all. Both facts are visible on the chart: a cluster of marks along the base through the second half of 2023, and then two and a half years of tape with no zone on it.
That silence is the reading. It is not a gap in the reading.
A structural tool that finds something every few weeks is telling you about its own sensitivity, not about the market. A zone exists only where price stopped travelling long enough for one to be built — where the tape spent real time in a single area and left a reference behind. On copper that happened at the base, and then it stopped happening. The layer has been honest about it ever since.
What the 2023 marks were, and what became of them.
Each stamp opened an area. Price spent time under the reference, the area held, and then the market left it going up. Once price is this far above a zone, the zone is history rather than context: not a level waiting below, but a record of something built two and a half years and three dollars ago. The layer's own reference sits at 4.52 today. Price is at 6.72. That distance is the point.
The practical consequence, and it is not a directional one.
Our acceptance and rejection protocol runs against a zone. Price enters an area, and you watch whether the tape works through it and stays, or touches it and leaves. Acceptance says the area is behind price now. Rejection says it held and the extreme was real. Both outcomes are information. Neither is available here, because there is no area anywhere near price. Copper on the daily is not a structure trade at the moment — it is a trend running above ground that carries no recent record.
What the other layers say, in words.
The weekly and the daily read the same state, with strong momentum and the strongest trend reading anywhere on our board this morning. The four-hour is the only frame reading as repairing, and it is also the only frame where money flow sits clearly negative. Money flow trails price by construction, so its level is not the point — the gap between it and momentum is. On copper that gap is almost nothing on the slow frames and negative on the fast one. Relative volume reads low, which makes every flow reading on this chart a lighter statement than usual today.
The survivorship warning this series keeps making.
The zone examples that circulate are the ones that worked. A stamp that marked a base gets a screenshot; 661 bars of a tool saying nothing never gets posted, by anyone. If you only ever see the hits, you will badly overestimate how much of a market's history is legible. On most charts, most of the time, the honest answer is that there is no reference here.
Two ways this resolves, and both are information.
If copper stops travelling and builds an area, the layer will stamp one — late, necessarily, because it cannot exist before the time has been spent. From that point there is something to accept or reject. If copper keeps moving without building, the reading stays exactly as it is, and the work moves to another timeframe rather than to another opinion about this one.
A zone you drew because the chart looked empty is not a zone.
That is the lesson of this chart. The tool is not quiet because copper is hard to read. It is quiet because nothing has been built under this price in 661 bars, and it will not pretend otherwise.
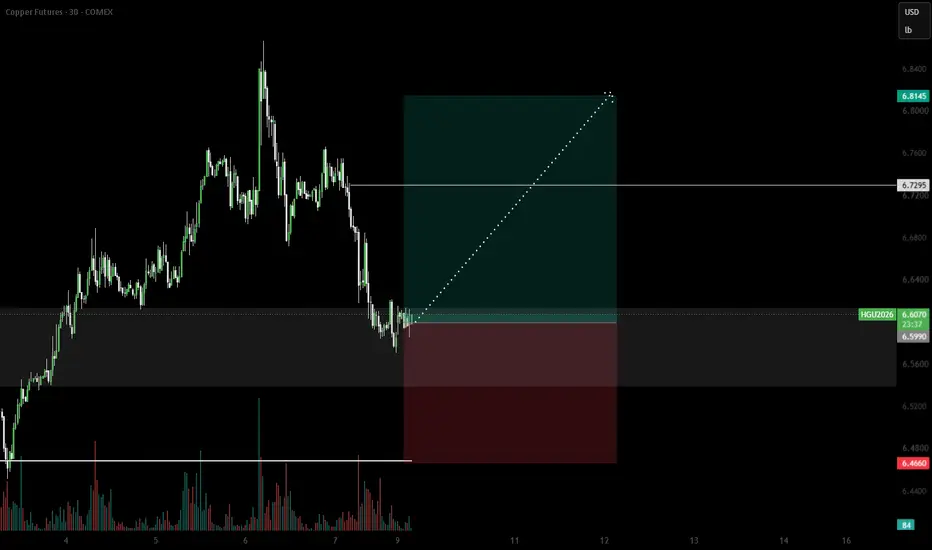
COPPER Long
COPPER BUY MARKET ORDER : 6.5990
Stop Loss: 6.4660
Partials/Remove risk: 6.7295
Take profit: 6.8145
Risk-Reward target: 1:1.62
Trade Plan: Long
Bias: BULLISH short term.
Entry reason: Price tested key POI area.
Fundamentally: The short-term valuation tool also shows temporarily undervalued against the competing index
Stop Loss: Below nearest low.
First target: 6.7295
HG Long — Copper's rally has real fuel behind it, and this pullbCopper is enjoying a fierce rally supported by strong commodity bids across the board, providing a clear fundamental tailwind for higher prices. With a massive 4R target and the structure showing no over-extension, buying this pullback offers excellent asymmetric upside.
📍 Entry: 6.6085
🛑 Stop: 6.5455
🎯 Target: 6.8665
⚖️ R:R: 4.10
HG Long — Copper's pullback looks like a gift, not a warning, asCopper presents a well-structured pullback long with a healthy 3.13R to target. The technical reset aligns perfectly with fundamentally tightening supply and strategic demand narratives, providing high conviction to buy the dip before the next leg higher.
📍 Entry: 6.6380
🛑 Stop: 6.5650
🎯 Target: 6.8665
⚖️ R:R: 3.13
Copper will outperform GoldThe Copper-to-Gold ratio chart (HG1! / GC1!). Instead of looking at Copper’s price in dollars, this chart answers one simple question: Who is winning right now: industrial growth (Copper) or pure global fear (Gold)?
For the last few years, Gold has been hogging the spotlight. Central banks hoarded it, people bought it because of war and inflation fears, and Copper got left in the dust because everyone was worried about a recession. That pushed this ratio down to levels we usually only see during total economic meltdowns (really evident back in 2008 or 2020).
Why I think the tides are turning
The liquidity sweep (2025/2026)
Look at that green circle at the bottom. The ratio briefly broke below multi-decade support levels, but it immediately snapped right back up. That's a classic bear trap / Wyckoff Spring: weak hands got shaken out, and big money absorbed the selloff.
Breaking the 5-Year Downside Trend
Right now, price is banging on the front door of that solid red diagonal resistance line running all the way down from 2021. A clean weekly close above this line confirms the multi-year downtrend is officially over.
Geopolitics & Macro
For this trade to really run, we don't need the world to become a peaceful paradise again. We just need the chaos to become... more... predictable.
- Gold slows down: Once central banks finish filling their vaults with Gold and foreign tension settles into a predictable "Cold War 2.0," the panic-buying in Gold cools off. Holding Gold yields 0%, so capital naturally starts looking for growth again.
- Copper ramps up: Meanwhile, the US, China, and Europe are in an absolute arms race for AI infrastructure and power grids. Data centers and high-voltage power lines swallow unreal amounts of copper, and you can't just flip a switch to build new mines (it takes ages just to open one). The physical supply simply isn't there for what the tech dogs want to do.
So, the Game Plan
- The Trigger: Wait for a solid weekly candle close above that red diagonal trendline.
- The Confirmation: If it breaks out, comes back to kiss the ~0.0015 level, and holds it as support, that’s your green light to add to the position.
- The Invalidation: If the ratio closes back down below 0.00125, the thesis is dead (for the time being at least). Cut the losses, move on, and wait for new clarity.
- The Target: We’re riding this back up to the top band (~0.0025 - 0.0027). Target will be revised further down the line depending on how the macro story evolves.
Want in? Here are a few ways to structure it:
- Futures Pair: Long Copper / Short Gold to directly bet on the ratio outperforming without taking USD currency risk (just keep an eye on financing/carry costs).
- Miners Strategy: Buy high-quality copper mining stocks while shorting or avoiding Gold mining ETFs.
- Options (LEAPS): Long call options on Copper ETFs or miners 1–2 years out to capture a potential supply squeeze with fixed downside.
For those of you that want more meat on the bone:
The copper market is undergoing a fundamental shift from surplus to structural deficit.
The ICSG now projects a 150,000-ton deficit by 2026, driven not by demand volatility but by the mining industry's inability to deliver new supply. Global ore grades have plummeted from 1-2% to below 0.7%, while capital intensity has doubled to $15,000-20,000 per tonne of production capacity. Permitting delays averaging 3-5 years compound the challenge. Meanwhile, electrification, renewable energy, and AI infrastructure are creating unprecedented demand layers. For investors, this marks a repricing era where capital-efficient projects, high-grade discoveries in stable jurisdictions, and disciplined developers will outperform. The investment thesis has shifted from cyclical exposure to structural positioning in a scarcity-driven asset class.
AI Infrastructure squeeze
Bloomberg estimates AI data center expansion will consume an average of 400k tonnes of copper per annum, contributing to an estimated long-term deficit of 6 Mio tonnes by mid 2030s.
Spot copper concentrate treatment and refining charges fell to -$126.80 per tonne at the end of June 2026 from the annual benchmark of $0 per tonne set in January 2026, the lowest annual benchmark on record. Smelters are paying miners to secure concentrate, shifting pricing power and processing margins toward concentrate producers.
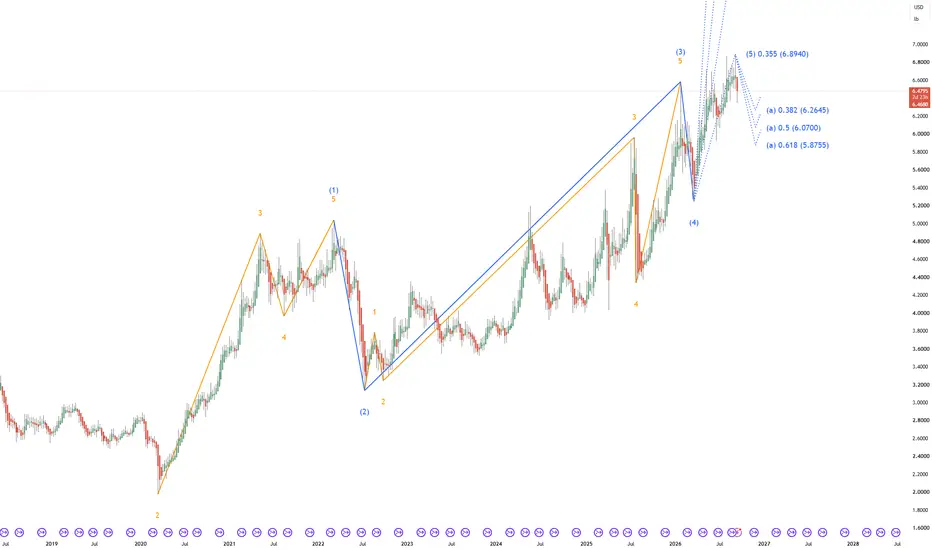
HG (Copper) Continues to Favor More Upside Near TermCopper futures (HG #F) continue to trade within a bullish Elliott Wave structure, with price maintaining an incomplete three-swing sequence from the 6.2820 low. The current rally remains constructive, suggesting buyers are still in control. As long as Copper holds above the 6.2820 invalidation level, the path of least resistance remains to the upside. The broader Elliott Wave structure continues to favor higher prices before a larger corrective pullback develops.
The 60-minute Elliott Wave chart shows Copper advancing within black wave ((iii)). A push toward 6.858 should complete the current five-wave impulsive sequence in wave ((iii)). Once this move finishes, we expect a corrective pullback in at least three swings as part of wave ((iv)). This pullback should present another buying opportunity, provided it remains above the 6.479 swing low and, more importantly, above the 6.2820 invalidation level.
Looking beyond the near-term correction, the higher-timeframe Elliott Wave count continues to point higher. We expect the current advance to extend toward 6.981, which represents the equal legs target for red wave 1 within wave 3. Reaching this level would complete another important phase of the larger bullish structure before any meaningful correction takes place.
Overall, our Copper Elliott Wave forecast remains bullish. Any pullback in the coming hours is expected to find support in 3, 7, or 11 swings, keeping the broader trend intact. Until key support levels break, traders should continue to favor buying pullbacks, with 6.981 remaining the next major upside objective.
Will Copper Futures Dictate the Future of AI?Macroeconomic Signals and Market Drivers
Copper futures recently surged to fresh records, with the London Metal Exchange benchmark hitting an all-time high of $13,842 per metric ton. US COMEX pricing has pushed even higher in dollar-per-pound terms, reflecting the tariff-driven premium between the two markets. The U.S. ISM Manufacturing PMI hit 55.6 percent, its highest reading since May 2022 and a four-year high. Traders often view copper as an accurate barometer for global economic health. Rising demand drives robust market momentum across global derivatives exchanges. Investors flock to copper futures to capitalize on expanding industrial activity. The Federal Reserve, meanwhile, holds rates at an elevated 3.50 to 3.75 percent with a hawkish bias, so liquidity conditions remain tight rather than easing. Consequently, copper prices reflect strong real-world manufacturing demand worldwide despite that tighter backdrop.
Geopolitics and Critical Resource Security
Geopolitical tension heavily influences global metal markets and trade flows. The United States and China compete fiercely for critical physical metal reserves. Accelerated U.S. stockpiling tightens copper supplies in international warehouses. Simultaneously, mine disruptions in Chile and Peru restrict global output. Peru issued emergency decrees to manage severe domestic energy shortages. Nations now classify red metal supplies as critical national security assets. Tariff uncertainties further incentivize buyers to secure futures contracts early.
High-Tech Demands and Industry Trends
Hyperscalers plan over $1.1 trillion in capital expenditures for artificial intelligence. Large AI data centers require thousands of tons of high-conductivity copper. A single gigawatt AI facility consumes tens of thousands of metric tons of copper. Power distribution, cooling systems, and electrical transformers demand vast copper supplies. Electric vehicle expansion and power grid upgrades amplify this structural deficit. This massive structural shift creates highly inelastic demand across global tech industries.
Science, Cybersecurity, and Patent Innovations
Materials science drives modern innovations in copper extraction and refining processes. Recent patent filings focus on bio-leaching and advanced eco-friendly smelting techniques. These patents allow producers to extract metal efficiently from lower-grade ores. High-tech power grids depend on secure hardware connections to prevent cyber attacks. Cybersecurity architecture incorporates hardware-level protections within smart grid equipment. Conductive copper pathways power these physical defensive security modules.
Medical Applications and Biopharma Synergy
Copper plays a crucial role in modern pharmaceutical and healthcare infrastructure. The medical industry relies heavily on copper's proven natural antimicrobial properties. Hospitals install copper alloy surfaces to eliminate harmful pathogens on contact. Biopharmaceutical manufacturing facilities utilize massive copper cooling systems for precise temperature control. Precise temperature management protects delicate biological compounds during mass production. Healthcare expansion continuously drives steady baseline demand for refined copper products.
Leadership and Modern Business Models
Major mining firms like Freeport-McMoRan adapt corporate culture toward sustainability. Executives prioritize long-term capital allocation over short-term production spikes. Producers adopt new business models, securing direct supply agreements with tech giants. Leadership teams navigate complex environmental regulations while expanding operational capacity. Exploration companies like Alma Metals report consistent mineral discoveries to boost supply. Strategic management ensures copper producers remain profitable throughout volatile commodity cycles.
copper mcx updatecopper mcx--eyes on 1350 if sustain abvove than mkt up side possible 1365--1380--1400+++ all will dpend on breakout lvl dontmiss it.. than sl will be 1335.
where support find 1330 if stya blw will create again panic side 1318--1303+++ than sl will be 1342. over all eyes on 1350 sustain or not or rejection here ?????? than will decide path.
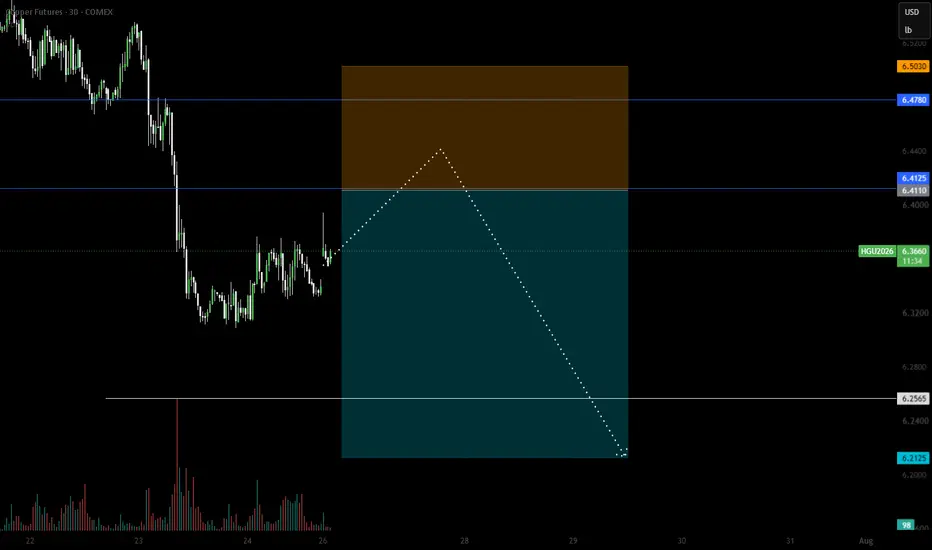
COPPER Short
COPPER SELL LIMIT ORDER : 6.4110
Stop Loss: 6.5030
Remove risk/Partials @ : 6.2565
Take profit: 6.2125
Trade Plan: Short
Bias: BEARISH short term.
Entry reason: Price will most likely retest key TPO area.
Fundamentally: The short-term valuation tool also shows temporarily overvalued against the competing index
Stop Loss: Above nearest high.
First target: 6.2565
Please refer to Copper for CFDs symbols
Copper Futures: Kicking off HigherCopper futures are starting the new trading week with moderate gains. We primarily expect further increases up to just below our resistance line at $6.71 in the near term. After that, copper futures should see a clearer move to the downside, but remain above our support line at $5.25. The long-term uptrend is then expected to continue. Alternatively, copper futures could drop directly below support at $5.25, which would signal that the larger (corrective) upward move has already ended (probability: 33%).
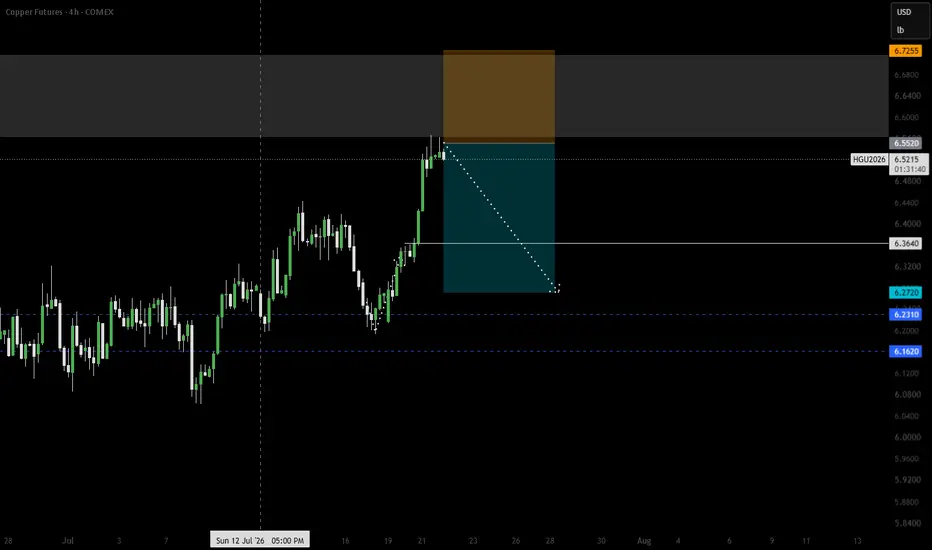
COPPER Short
COPPER SELL MARKET ORDER : 6.5520
Stop Loss: 6.7255
Remove risk/Partials @ : 6.3640
Take profit: 6.2720
Trade Plan: Short
Bias: BEARISH short term.
Entry reason: Price has tested key TPO area.
Fundamentally: The short-term valuation tool also shows temporarily overvalued against the competing index
Stop Loss: Above nearest high.
First target: 6.3640
Please refer to Copper for CFDs symbols
Copper — a six-week high, now pausing at the bundleCopper hit a six-week high this week on a mix of supply shocks — a storm disrupting Chilean mines (Codelco, Antofagasta), tightening Comex inventories on US tariff positioning, and a Chinese import premium at its highest since last May. The rally has been real, not speculative: production is genuinely down.
The bundle read here: the MA convergence has acted as support through the pullback stages of this month's rally, and price is now pausing right at it after Tuesday's peak. Whether this is a healthy pause before the next leg or the start of a real reversal is exactly the open question the structure poses.
Not financial advice — for analysis and education only. Method: Insen / OpenTraders.
Copper PennantCopper has a huge pennant formation, if it breaks upward we're gonna see it go parabolic like silver did.
I guess all these data centers are driving a shortage in metals, it should take gold and silver with it.
Bought a few CPER Aug calls for kicks and giggles, just to check it out. Besides the calls were way cheaper than silver.
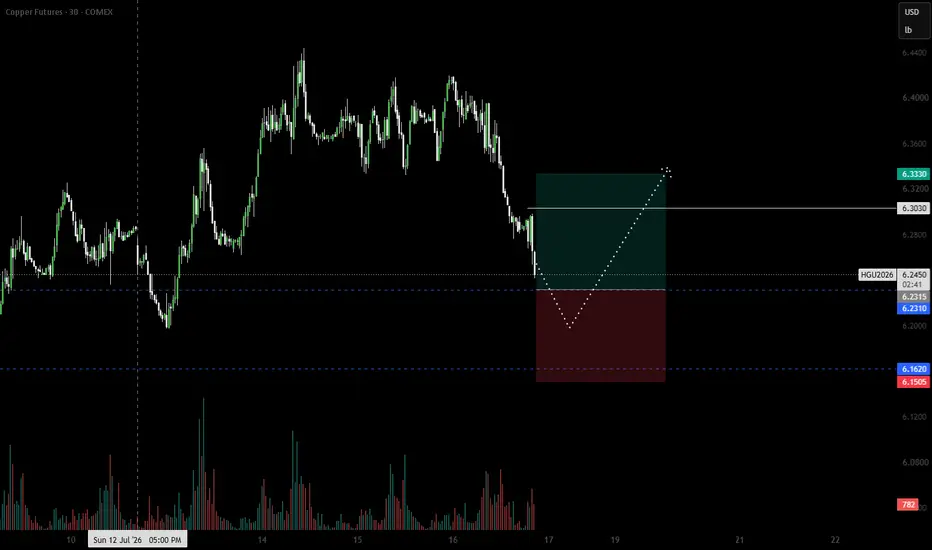
COPPER Long
COPPER BUY LIMIT ORDER : 6.2315
Stop Loss: 6.1505
Remove risk/Partials @ : 6.3030
Take profit: 6.3330
Trade Plan: Long
Bias: BULLISH short term.
Entry reason: Price has tested key TPO area. The short-term valuation tool also shows temporarily undervalued against the index
Stop Loss: Below nearest low.
First target: 6.3030
Why Can't Copper Supply Keep Up With AI?Copper spent 2026 doing something it had not done in a quarter century: setting fresh records every few weeks. The COMEX contract hit an intraday all-time high of $6.71 per pound on May 13. The reason is not mysterious. Three forces- AI infrastructure, a supply shock in Indonesia, and new US tariffs- collided at once. This is the real copper story: a structural race between demand that scales in months and supply that takes decades.
The Widening Gap: Macroeconomics and Economics
Copper earns its "Dr. Copper" nickname because it tracks global growth better than almost any other commodity. Right now it is diagnosing a genuine shortage. The International Copper Study Group forecasts a 150,000-tonne deficit for 2026. That follows years of warnings largely ignored by the market.
The Federal Reserve backdrop adds another layer. The Fed holds its policy rate at 3.50% to 3.75% under Chair Kevin Warsh, and markets still expect at least one more hike this year. Higher rates typically cool industrial demand. Copper has shrugged this off, because the demand driving this cycle is structural, not cyclical.
Goldman Sachs raised its year-end 2026 LME forecast from $12,465 to $13,735 per tonne. That is still below the metal's actual highs, a sign that even bullish banks are playing catch-up with the physical market.
| Metric | Level |
| COMEX copper (May 2026 high) | $6.71/lb |
| LME copper (2026 high) | $13,387/mt |
| ICSG 2026 deficit forecast | 150,000 tonnes |
| Goldman 2026 year-end forecast | $13,735/mt |
Geopolitics, Tariffs, and a Stockpiling Standoff
Washington reshaped the copper trade in 2025. A Section 232 proclamation imposed a 50% tariff on semi-finished and derivative copper products effective August 1, 2025. Refined copper, cathodes, and scrap stayed exempt, for now. A Commerce Department review due June 30, 2026 could trigger a phased duty on refined copper starting at 15% in January 2027, rising to 30% in 2028.
That uncertainty created a strange side effect. Traders raced to pull copper into US warehouses ahead of a tariff that has not yet arrived. COMEX inventories swelled past 650,000 tons, pulling in more than half of the world's visible copper stock. The US holds roughly 65% of visible global inventory despite consuming less than 10% of global demand.
Geography compounds the risk. The US imports about 45% of its copper, led by Mexico, China, and Canada, according to the Council on Foreign Relations. Chile alone supplies roughly half of global copper exports and contributes more than 10% of its own GDP from the metal. Renewed Middle East tensions have added a second front, disrupting sulfuric acid supply chains that feed copper cathode production, which accounts for about 20% of global refined output.
| Section 232 Copper Tariff Timeline | Rate |
| Semi-finished/derivative products (Aug 2025) | 50% |
| Refined copper, phase one (if triggered, Jan 2027) | 15% |
| Refined copper, phase two (2028) | 30% |
Industry Trends and Business Models
Miners are rewriting how they sell copper. Long-dated offtake agreements, once rare outside gold streaming, now anchor project financing for new mines. Producers increasingly lock in buyers years before first output, a direct response to a deficit that has become the default expectation rather than a temporary shock.
The tariff-driven stockpiling trade is itself a business model shift. Traders now treat the COMEX-LME price spread as a tradable arbitrage, not a rounding error. If Washington ultimately declines to tariff refined copper, UBS analysts warn that reversal could dump a large share of that 700,000-ton US inventory back onto global markets, pressuring prices lower.
Leadership Under Pressure: Freeport's Grasberg Test
No company illustrates the industry's fragility better than Freeport-McMoRan. On September 8, 2025, roughly 800,000 tonnes of wet material rushed into its Grasberg Block Cave in Indonesia. Freeport declared force majeure weeks later, an incident that cost the market about 525,000 tonnes of supply across 2025 and 2026 alone.
CEO Kathleen Quirk, a 35-year Freeport veteran who took the top role in 2024, has guided the company's response, targeting 60% of Grasberg's capacity by year-end with full production pushed back to 2028. That single mine's disruption turned a projected global surplus into a deficit almost overnight, a reminder that copper supply concentrates dangerously in a handful of assets.
Technology and Science: The AI Demand Shock
Artificial intelligence is copper's newest and most concentrated demand driver. Bloomberg Intelligence estimates AI-ready data centers consume 27 to 33 tonnes of copper per megawatt of applied power. A single hyperscale AI facility can require up to 50,000 tonnes on its own.
The mismatch in timing is copper's defining structural problem. A data center can be built in 18 to 23 months. A new copper mine takes an average of 17.9 years from discovery to production. North American AI buildout alone could add 1.1 to 2.4 million tonnes of copper demand by 2030, a volume the mine pipeline simply cannot match on that timeline.
Renewable energy compounds the squeeze. Solar and wind installations require 8 to 12 times more copper than equivalent fossil fuel generation, and electric vehicles use 3 to 4 times more copper than an internal combustion engine.
Patent Analysis and Innovation
Faced with grade decline and permitting delays, miners are patenting their way to more copper rather than waiting for new deposits. Recent filings cluster around bioleaching, using engineered bacteria to extract copper from low-grade ore, and advanced flotation techniques that recover metal from tailings once considered waste.
Recycling technology is drawing equally aggressive patent activity. Copper never degrades chemically, making it one of the few metals recoverable at near-100% purity. Companies are patenting sorting and smelting processes that cut the energy cost of recycled copper well below virgin ore production, a genuine competitive moat as ore grades keep falling worldwide.
Cybersecurity in an Automated Mining Sector
Modern mines run on the same industrial control systems that make manufacturing plants attractive ransomware targets. Autonomous haul trucks, remote block-cave sensors, and smelter automation all depend on operational technology networks that were never designed with cybersecurity as a priority.
A successful attack on a mine's control systems can halt production as effectively as a geological disaster. Major producers now run dedicated OT security programs, treating cyber resilience as core to supply continuity, not an IT afterthought layered on top of it.
Company Culture and the Decarbonization Push
Mining culture is shifting from extraction-at-any-cost toward engineered efficiency. Freeport and its peers now tie executive compensation to emissions targets alongside production volumes, a genuine change from a decade ago. Water recycling and lower-carbon smelting are becoming competitive differentiators, not just compliance checkboxes.
This cultural shift matters commercially. Copper is marketed increasingly as the enabling metal of the energy transition, and buyers, particularly automakers and utilities, now scrutinize the carbon footprint of the copper they purchase.
The Pharmaceutical Connection
Copper's industrial story overshadows a genuine medical one. Copper alloys carry EPA registration as antimicrobial surfaces, proven to continuously kill bacteria that cause healthcare-associated infections. Hospitals increasingly install copper touch surfaces on bed rails and door handles for exactly this reason.
Copper also plays a direct pharmaceutical role through copper intrauterine devices and copper supplementation for deficiency-related conditions. None of this moves copper futures meaningfully. It does mean rising extraction and recycling capacity built for industrial demand quietly benefits a completely separate, health-focused market.
Closing Thoughts
Copper's 2026 rally rests on a genuine structural mismatch, not speculative froth. AI data centers, EVs, and grid buildout are scaling in months. New mine supply takes decades, and a single disaster at Grasberg proved how little slack exists in between. Tariff policy adds a second, more volatile layer: a still-undecided Commerce Department ruling on refined copper could either validate the current US stockpiling trade or unwind it violently. Watch three signals going forward: whether Washington actually extends Section 232 tariffs to refined copper, how quickly Grasberg returns to full capacity, and whether ICSG deficit forecasts widen or narrow as AI capex plans firm up.