Gold 4H: Lower Highs Since 4,755 - Bears in Control Below 3,985Gold has been in a clean 4H downtrend since the August top at 4,755.
STRUCTURE
- Top: 4,755 (Aug 24)
- Lower highs: 4,558 (Sep 3) > 4,440 (Sep 18) > 4,259 (Oct 2) > 4,158 (Nov 9)
- Lower lows: 4,329 > 4,273 > 4,143 > 3,989 > 3,879 > 3,857 (Nov 12)
The early-November rally printed a bullish CHoCH a
Peers for comparison
Gold oversold, about to bounceThanks for viewing.
All I am saying is that Elliot Wave theory points to this downward correction being pretty much complete. I'm not sure if we will resume uptrend, trade sideways for months... but;
Wave C in a correction always has five waves (and each of the three impulse waves in the direction
Gold 4H: 3,857 Swept to 3,835 - Liquidity Grab or Next Leg Down?Follow-up to my Nov 14 idea. In today's Asian session gold swept the Nov 12 low (3,857), printed a new low at 3,835 and bounced back above 3,870.
STRUCTURE
- Lower highs: 4,755 > 4,558 > 4,440 > 4,259 > 4,158
- Lower lows: ... > 3,879 > 3,857 > 3,835
The trend is still down - a sweep alone is not a
Bull Div Delight -GCGC has dropped roughly 400 pts lower without printing a HH on sell pressure on 30m.
For November, GC has dropped over 300 pts from monthly high yet has not printed higher high on sell pressure for intra day tfs since Nov 10, and before that Sep 27.
It's a heavy fix to the downside, but a discount
Staring into the Volume VoidBetween 3900 and 3500 the volume profile shows a void where relatively few trades have taken place. When price enters this void, it can traverse across it in the downward direction just as easily as it did on the way up when it created it. Price has closed below 3900 for 2 days and therefore has e
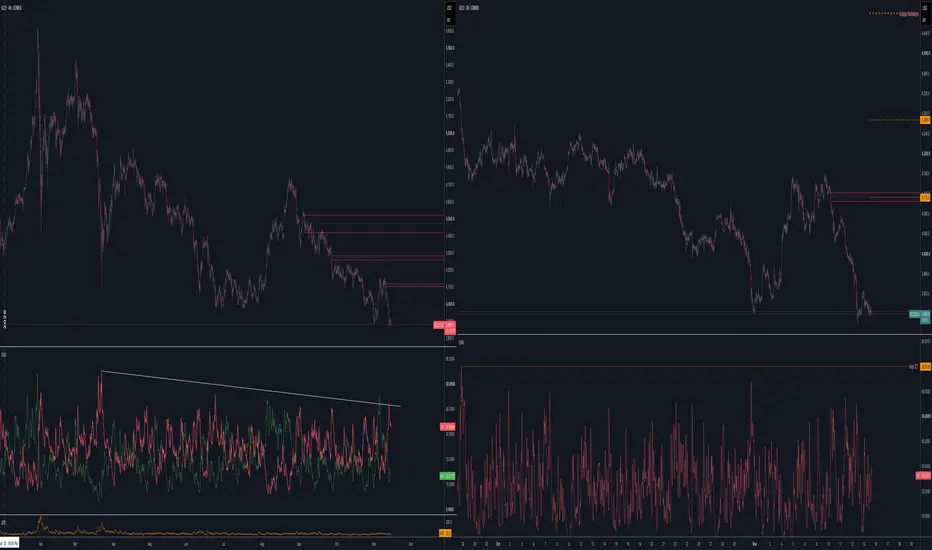
Gold: Below 3,871, Watching 3,835 | COT & Key LevelsGC1! | 15-minute chart | November 17, 2026
Based on the 6:27 a.m. CT snapshot, with gold near 3,863.7.
My short-term lean stays bearish below 3,871, but support still needs to break. Price has slipped beneath that pivot after forming a lower high.
COT CONTEXT
The November 10 futures-only report sh
Gold (GC) Analysis, Key-Zones, Setup for Tue (Nov 17)Bias: The December gold contract settled at 3,853.0 on Monday, down 33.3 or 0.86 percent, after trading between 3,904.3 and 3,835.2, a 69.1 point range. Monday printed the fifth consecutive lower high and a lower low against Friday, and the settle is the lowest of the 259 completed sessions in the
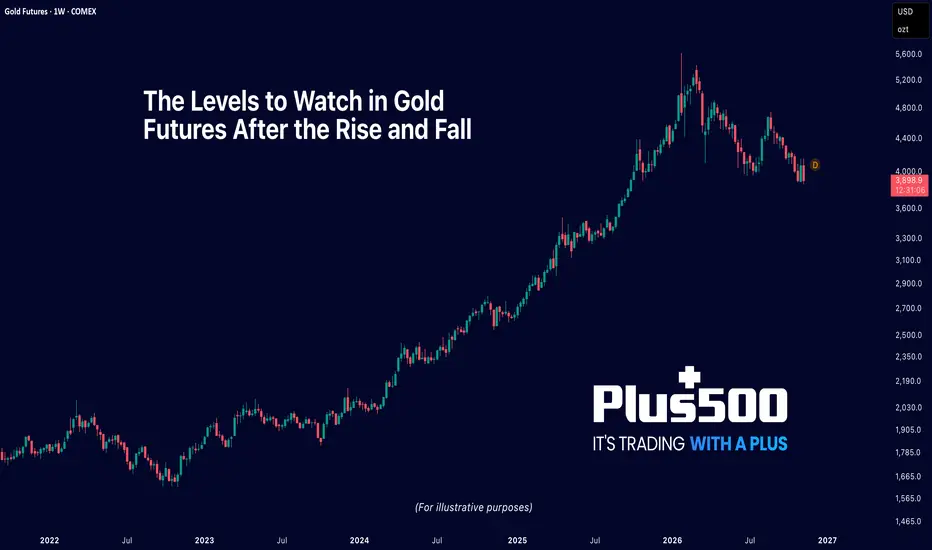
The Levels to Watch in Gold Futures After Its Rise & FallEarly this year, Gold staged a powerful move higher, driven by persistent inflation narratives, central bank demand, and a steady bid for safety. After a run like this, price becomes less about the story, and more about the levels.
Here’s how to frame it.
📌 1. The Breakout Zone (Now Support)
One last chance to BUY DIPFollowing my last update, we are now standing on one of the key suppport levels. Now we have two cases. Case 1 : Trump cannot accept strong bond yield and US dollar, and he starts to intervene in the market earlier than market expectation. Iran war ends ahead of next FOMC in June. Case 2 : Nothing
See all ideas
A representation of what an asset is worth today and what the market thinks it will be worth in the future.
Displays a symbol's price movements over previous years to identify recurring trends.
Frequently asked questions
One way to gain exposure to MGCM2026 is through a broker that offers futures. Before trading, make sure you understand how the product works and the risks involved.
You can trade MGCM2026 directly from TradingView:
– Choose a broker: Explore our supported trading partners and pick one that fits your needs
– Compare options: View available brokers side by side to evaluate fees and features
– Connect your account: Open Supercharts, click "Trade", select your broker, and log in
– Start trading: Place orders directly from the chart
Tip: If you're new to trading, try paper trading first — it lets you practice strategies in real market conditions without risking funds.
You can trade MGCM2026 directly from TradingView:
– Choose a broker: Explore our supported trading partners and pick one that fits your needs
– Compare options: View available brokers side by side to evaluate fees and features
– Connect your account: Open Supercharts, click "Trade", select your broker, and log in
– Start trading: Place orders directly from the chart
Tip: If you're new to trading, try paper trading first — it lets you practice strategies in real market conditions without risking funds.
The nearest expiration date for MGCM2026 is Jun 26, 2026.
Futures contracts expire on predetermined dates. As expiration approaches, many traders roll positions into the next contract to maintain exposure to the market.
Key metrics to watch near expiration:
• Volume and liquidity: Trading activity often shifts to the next contract month
• Open interest: Falling open interest may signal positions being closed or rolled forward
• Forward curve: Differences between contract prices can help identify market structure, including contango and backwardation
Explore the MGCM2026 chart to monitor active contracts and contract-month activity.
Futures contracts expire on predetermined dates. As expiration approaches, many traders roll positions into the next contract to maintain exposure to the market.
Key metrics to watch near expiration:
• Volume and liquidity: Trading activity often shifts to the next contract month
• Open interest: Falling open interest may signal positions being closed or rolled forward
• Forward curve: Differences between contract prices can help identify market structure, including contango and backwardation
Explore the MGCM2026 chart to monitor active contracts and contract-month activity.