Peers for comparison
Does copper fall when the S&P 500 drops 2%? 87% of the timeWhen the S&P 500 drops more than 2% in a day, does copper fall with it? From 2010 to 2025 it did on 90 of 104 such days, or 87%.
What we measured
We took TradingView's daily closes for copper futures (COMEX HG1!, the front month) and the S&P 500, on the days both traded. Copper closes about an h
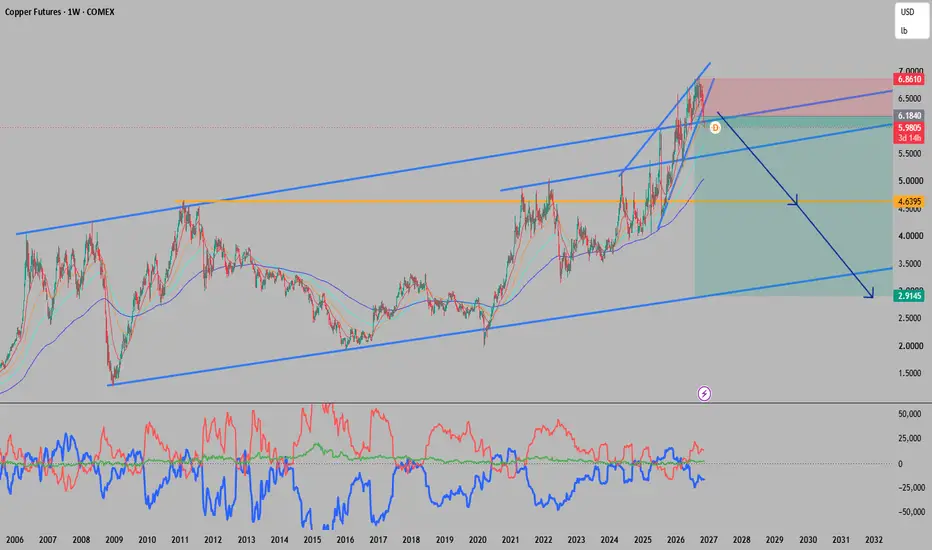
Dr. Copper is giving a recession signal: COT report Positioning in the COT report has shown an extreme signal. It is seeming very obvious that copper had become a crowded trade and thus, a reversal to the downside has begun. That being said, I don't think this is just another correction, it could be the start of the crash seen in recessions.
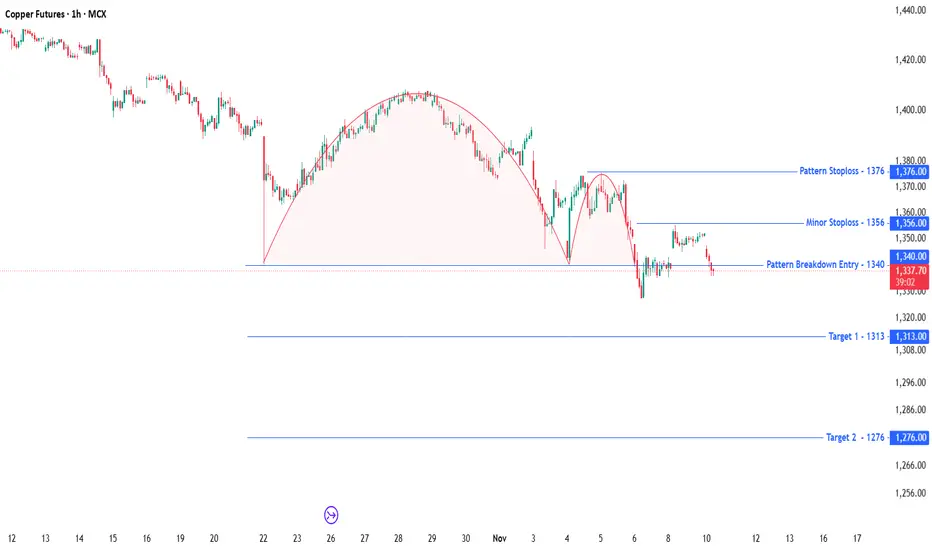
MCX Copper - H&S Pattern Spotted. MCX Copper Futures (1H) – Structural Breakdown & Short Trade Setup
MCX:COPPER1!
Market Context & Pattern Recognition
On the 1-hour timeframe, Copper has completed a classic Head and Shoulders distribution structure. The baseline neckline support around 1340 has broken down decisively, shiftin
Can the Historic Copper Bull Market Defy Gravity?Geopolitics and Geostrategy
Critical minerals dictate modern foreign policy. Copper sits at the center of global power struggles. Developing nations across South America and Africa increasingly enforce resource nationalism. Chile and Peru face operational disruptions, higher royalty taxes, and poli
Gold vs Copper | The Battle for the Next Economic SupercycleEveryone Is Watching Gold, Smart Money Is Looking at Copper
For the past few years, investors have been busy chasing technology stocks, AI companies and the next big thing in financial markets. But while most of the attention has been on GPUs and semiconductor companies, two commodities have been t
COPPER 1D: 6th Touch of a Flat Support Line Since Aug 2026A flat support line on the daily chart of COPPER, found by an automated trendline scan from the swing highs and lows.
The picture so far
6 confirmed touches on a flat support line between 13 Aug 26 and 30 Oct 26.
No daily close through the line since the first touch; a close within a hair of
Copper holds near its highs while hedge funds cut their long 42%Copper has stayed above 6.40 dollars a pound on every CFTC report Tuesday since mid-August. On October 20 it was 6.48, only 3.3 percent below September 22. The COT report shows the hedge fund money behind the rally is leaving.
The exit. On September 22, Managed Money (hedge funds and CTAs) was net
Why I think Copper prices will dropHere’s why:
Despite price gains, COT report shows continued outflows from non-commercial traders, widening the divergence between positioning and price action.
Meanwhile Copper is still in equilibrium, oscillating within its range, while Aluminum has dropped nearly 15% from its September peak alre
See all ideas
A representation of what an asset is worth today and what the market thinks it will be worth in the future.
Displays a symbol's price movements over previous years to identify recurring trends.
Frequently asked questions
One way to gain exposure to QCZ2018 is through a broker that offers futures. Before trading, make sure you understand how the product works and the risks involved.
You can trade QCZ2018 directly from TradingView:
– Choose a broker: Explore our supported trading partners and pick one that fits your needs
– Compare options: View available brokers side by side to evaluate fees and features
– Connect your account: Open Supercharts, click "Trade", select your broker, and log in
– Start trading: Place orders directly from the chart
Tip: If you're new to trading, try paper trading first — it lets you practice strategies in real market conditions without risking funds.
You can trade QCZ2018 directly from TradingView:
– Choose a broker: Explore our supported trading partners and pick one that fits your needs
– Compare options: View available brokers side by side to evaluate fees and features
– Connect your account: Open Supercharts, click "Trade", select your broker, and log in
– Start trading: Place orders directly from the chart
Tip: If you're new to trading, try paper trading first — it lets you practice strategies in real market conditions without risking funds.
The nearest expiration date for QCZ2018 is Nov 28, 2018.
Futures contracts expire on predetermined dates. As expiration approaches, many traders roll positions into the next contract to maintain exposure to the market.
Key metrics to watch near expiration:
• Volume and liquidity: Trading activity often shifts to the next contract month
• Open interest: Falling open interest may signal positions being closed or rolled forward
• Forward curve: Differences between contract prices can help identify market structure, including contango and backwardation
Explore the QCZ2018 chart to monitor active contracts and contract-month activity.
Futures contracts expire on predetermined dates. As expiration approaches, many traders roll positions into the next contract to maintain exposure to the market.
Key metrics to watch near expiration:
• Volume and liquidity: Trading activity often shifts to the next contract month
• Open interest: Falling open interest may signal positions being closed or rolled forward
• Forward curve: Differences between contract prices can help identify market structure, including contango and backwardation
Explore the QCZ2018 chart to monitor active contracts and contract-month activity.