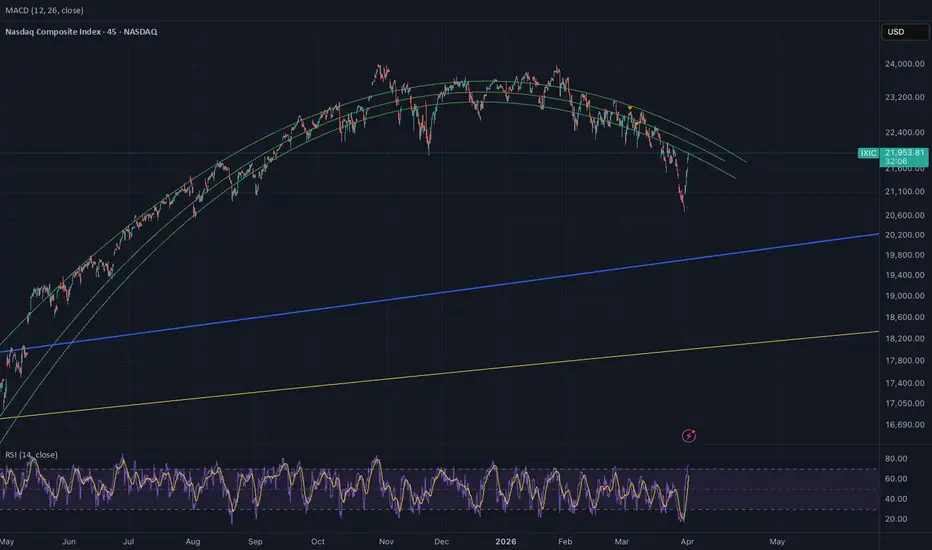
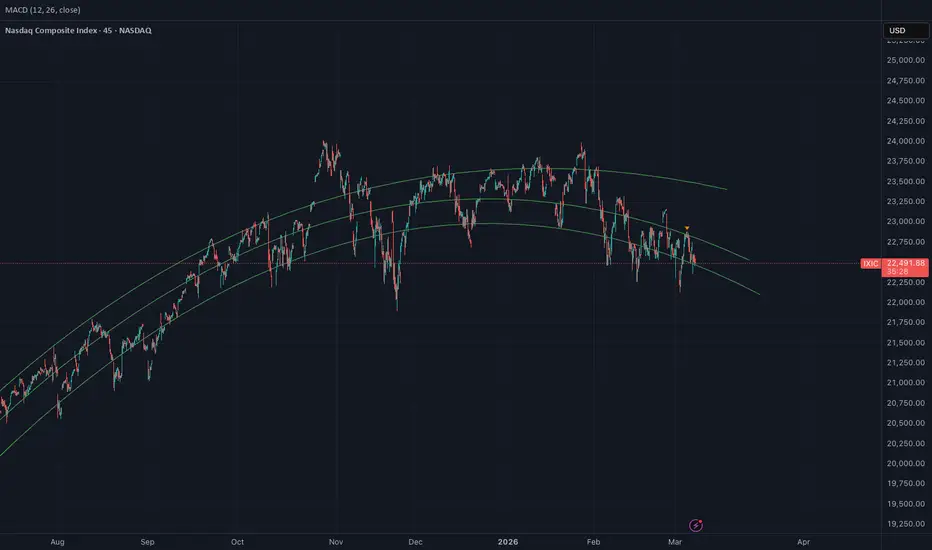
When Markets Hit Records, Should You Still Be Buying?The Nasdaq NASDAQ:IXIC is back at record highs . The S&P 500 SPCFD:SPX and Dow TVC:DJI have recently been there too. AI stocks are running again, AMD NASDAQ:AMD has crossed the $1 trillion mark while traders stare at their screens and ask:
Should I buy at the top?
It's one of the most natural instincts in markets. We happily buy a TV after its price falls 20%, yet become suspicious when stocks do the opposite. Surely waiting for a pullback is smarter than buying at the highest price
In-depth trading ideas
Nasdaq: Is a Correction Coming? Distribution at the Highs?# Nasdaq at the Highs: Price Is Strong, but the Internals Are Sending a Warning
The Nasdaq remains near its highs, but the current structure is beginning to show signs that deserve attention.
This is not a prediction of an immediate market crash, nor is it an attempt to call the exact top.
The question is much simpler:
**Is the risk/reward of remaining aggressively long beginning to deteriorate?**
I believe the answer may be yes.
## The Divergence
The first warning comes from momentum.
W
What the Market Is Trading Now: AI Selectivity, Not AI EuphoriaMarkets barely moved at the index level this week — but that calm is misleading. The tape is telling a sharper story: capital is no longer paying for the AI theme as a bloc. It is paying for proof. Execution, demand visibility, and monetization timeline are the only things being rewarded, and everything else is being sold.
Our market-temperature model captures the split cleanly. The Nasdaq (IXIC) printed a TEMP10 of 69.35 — into defensive territory — while the S&P 500 (SPX, 80.06) and Dow (DJI,
Nasdaq composite breakout is clearNasdaq composite corrected 10% and then quickly broke out of its channel that began from its previous high. It is a clear strong volume breakout. Expect a little retest and then as long as it bounces off the channel, it is a clear breakout run to new highs. QQQ long, NQ long.
Will we put in new ATHs before the year is out?I was asked in my community if we would put in new ATHs before the year is out.
My standard answer is always:
I don't know. It's really above my pay grade. I only react to the shifts. (which this is true)
But I also provided some context and I wanted to share it here with you too:
Looking at this historically, I can see it. We can put 3 legs in before a deeper correction or bear market. Take a look.
The market is cyclical, the market has a natural upward drift, the market has patterns. R
The Nasdaq feels the Fed hardest. Which way today?Not every chart feels the Fed the same. Watch a rate decision drop across a few charts at once and you notice it. They all move, but the Nasdaq moves like it heard the news louder. I keep it (TVC:IXIC) front and center on Fed days for that reason: when the Fed talks, this is the ticker that flinches first and hardest.
This week it counts. The FOMC, the Federal Reserve committee that sets US interest rates, meaning the cost of borrowing dollars, meets Wednesday, and the decision lands at 2pm. Th
NASDAQ: SUPER BULLISHThe Nasdaq is currently advancing through Wave 3 of a larger supercycle. Although the market has recently gone through a correction, I expect another powerful liquidity-driven rally to begin in August.
From an Elliott Wave perspective, the Nasdaq has developed a nested 1-2, 1-2 setup. If this structure remains valid, the next major advance should unfold as Wave 3 of 3, typically the strongest and most explosive phase of an impulsive cycle.
Analyzing Market Trends Using the Kalman Filter-Optimized RSI
"The Kalman Filter-Optimized RSI used in this analysis was developed by myself and has been published to the TradingView public community. Interested readers can visit my profile and head to the 'Scripts' tab to find it and add it to your favorites for free."
The application of the Kalman Filter-Optimized RSI is not limited to Daytrading; it is equally effective in helping us analyze overall market trends. Because the Kalman Filter-Optimized RSI utilizes a Kalman Filter to eliminate mar
Why Traders Sell Winners Too Early and Hold Losers Too LongHere's an academic read to pull you away from the AI trade noise for five minutes.
At some point, almost every trader notices a pattern in their own history that makes for uncomfortable reading.
The winning trades are small. Closed too soon, before the move played out, because the profit felt good and locking it in felt safer than watching it evaporate. The “bird in the hand,” right?
The losing trades are large. Held too long, well past the point where the original thesis broke down, because
Path of least resistance remains to the upsideDown nearly 8% from record highs of 27,190, the Nasdaq Composite recently shook hands with the 50-day SMA at 25,045, a dynamic value that is closely bolstered by a 38.2% Fibonacci retracement at 24,729.
The nearby decision point area is seen overhead at 26,268-26,078, with a break above this area paving the way for a run to resistance at 26,719. To the downside, beyond current support, opens the door to another layer of support at 23,828 and 23,972.
Ultimately, with the trend still very much
The vertical AI rise versus the value King - IXIC/BerkshireStop waiting for the world to end.
The conclusion of the AI tech meltup isn't a crash—it’s the start of the greatest Value Rotation of the decade.
Know where the capital is flowing next.
The Strategy: > Ride the high-velocity tech and proxy trends for the remaining ~7-month structural window.
But as we reach the vertical exhaustion channel, prepare to shift out of the satellites and sit comfortably in the Value King's court.
Play the rotation, don't fear the reaper.
Hashtags:
#Nasdaq #Ber
Looking like a nice bull trap NASDAQ:IXIC
Everyone fomo'd at the top... nothing go up a month straight...
it's at the top if the channel going on for year's.
careful if you buy here long term!!! Go shopping when market extreme fear like in late March, not in May when in Greed almost touched extreme greed....
Nasdaq Soars 20% in Three Weeks. Boom Just in Time for Earnings?The tech-heavy Nasdaq Composite NASDAQ:IXIC has climbed nearly 20% from its March 30 low, delivering the fastest rebound traders have seen this year. Moves of that size usually arrive alongside strong catalysts, shifting expectations, or a sudden improvement in global mood.
This time the spark came partly from easing tensions around the US–Iran conflict, which helped calm energy markets and send risk assets to record highs . A relief rally quickly became a momentum rally, and momentum attrac
Nasdaq:Continuation or Correction?NASDAQ:IXIC
1. Monthly Timeframe: The Strategic Pivot
The Nasdaq is currently retesting key support at the T2 structural level. As a critical confirmation point for the macro trend, stability here is paramount. We are at a "crossroads" where market sentiment is shifting: the next few candles will determine if this is a bullish mid-point continuation or the beginning of a deeper mid-term correction. A confirmed bottom reversal pattern at this T2 level is the prerequisite for any long-term long
NASDAQ SHORTThe chart already shows a rollover with price sitting beneath a downward sloping trend structure and consistently making lower highs, which means it does not need much macro pressure to continue lower and that pressure is building. Geopolitically, persistent instability keeps energy elevated and feeds directly into inflation expectations, which constrains the Fed’s ability to ease. The Nasdaq is highly sensitive to rates staying higher for longer because its valuations are tied to future cash fl
NASDAQ :Battle for the Critical Support ZoneNASDAQ:IXIC
Executive Summary
The index has yielded the swing-level support and is currently testing critical internal range support. This level serves as a definitive pivot for the next medium-term move:
· Bullish Case: Hold internal support ——> Technical rebound to test overhead resistance.
· Bearish Case: Break internal support——> Deep correction toward structural support, risking a macro trend reversal.
Multi-Timeframe Technical Analysis
Monthly Perspective: Bearish Momentum Build
IXIC – 1% Drop as US-Iran 48-Hour Ultimatum Fuels Risk-OffNasdaq futures down ~1%, S&P 500 futures -0.8%, Dow futures -0.6% ahead of Monday open. Fourth straight week of losses: Dow & Nasdaq ~2% each last week, S&P 500 -1.5%. Dow’s first 4-week losing streak since 2023.
Key drivers:
- Trump ultimatum: Obliterate Iranian power plants if Strait of Hormuz not reopened in 48 hours
- Iran threatens US Gulf energy & desalination infrastructure in retaliation
- Asia already hit hard: Nikkei -5%, Kospi >-5%, Topix -4.4%
Oil: WTI +0.5% to ~$98.80, Brent +0.
SHORT NASDAQ?Technical analysis of the Nasdaq focuses on extracting structure from price, volatility, and liquidity rather than attempting to value companies directly. Because the Nasdaq is heavily weighted toward high-growth technology firms, its price behavior often exhibits strong momentum regimes, volatility clustering, and sharp liquidity-driven reversals. Analysts typically examine trend persistence through moving averages, market breadth indicators such as advance–decline lines, and momentum oscillato
5 day chartA Nasdaq Composite chart typically displays the aggregate price movement of thousands of technology-heavy equities listed on the NASDAQ Composite Index. Because the index is market-capitalization weighted, a small group of large firms—such as Apple Inc., Microsoft, NVIDIA, Amazon, and Alphabet Inc.—exerts a disproportionate influence on its trajectory.
NASDAQ 1H - Recovering From 22,300 Lows, Bear OB at 23K Is Test🔍 NASDAQ COMPOSITE — 1H SMC Analysis | Feb 23, 2026
Monday Market Outlook | US Market Opens Today
Price is at 22,886 — bouncing strongly from the
22,300 lows. But before bulls get excited, there
is a major Bear OB sitting just 114 points above.
This week's direction gets decided right here.
━━━━━━━━━━━━━━━━━━━━━━━━━━━
📊 WHAT HAPPENED — THE FULL STORY
━━━━━━━━━━━━━━━━━━━━━━━━━━━
From the 23,900 Strong High, NASDAQ printed a
textbook Smart Money distribution:
→ CHoCH confirmed bearish at the t