What Amazon's Chart Tells Us Ahead of Next Week's EarningsIt's been a rough go of it in 2026 for shareholders of Amazon NASDAQ:AMZN , which will report quarterly results next week. The struggling "Magnificent Seven" stock remains some 15% below its $278.56 May all-time high -- and is even roughly 10% below its $258.60 peak for 2025. Let's check out the e-
Amazon.com, Inc.
No trades
No trades
Compare with Amazon.com, Inc.
Key facts today
Amazon (AMZN) reports Q2 this week. Traders focus on AWS revenue near $40B and management commentary on AI investments, amid peers' cloud gains used as context. 1
AMZN: AWS launched HealthOmics in Asia Pacific (Tokyo), giving Japanese users local genome analytics and processing access; expands AWS healthcare cloud footprint in the region. 1
Warner Bros. Discovery sued Amazon over hiring Pia Barlow, alleging Amazon induced breach of her contract through Oct 2027 and may target other WBD staff; suit seeks damages and injunctions. 1
7.35 EUR
66.13 B EUR
610.40 B EUR
9.79 B
Next report date
—
Report period
—
EPS estimate
—
Revenue estimate
—
Details
Sector
Industry
CEO
Andrew R. Jassy
Website
Headquarters
Seattle
Founded
1994
IPO date
May 15, 1997
ISIN
US0231351067
CUSIP
023135106
FIGI
BBG00FZMF707
Identifiers
ISIN US0231351067
Amazon.com, Inc. is a multinational technology company, which engages in the provision of online retail shopping services. It operates through the following segments: North America, International, and Amazon Web Services (AWS). The North America segment offers retail sale of consumer products, including from sellers, advertising, and subscriptions services through North America-focused online and physical stores. The International segment focuses on retail sale of consumer products, including sellers, advertising, and subscription services through internationally focused online stores. The AWS segment is composed of global sales of computers, storage, databases, and other services for start-ups, enterprises, government agencies, and academic institutions. The company was founded by Jeffrey P. Bezos in July 1994 and is headquartered in Seattle, WA.
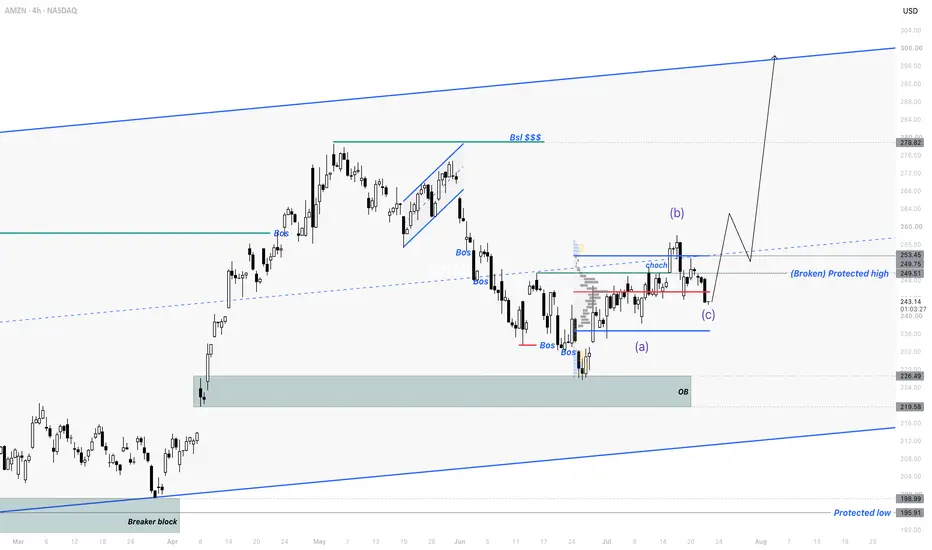
AMZN | ABC Correction Done — Break The HVA And Run!
By analyzing the #AMZN (Amazon) chart on the 4H timeframe, we can see that the broader trend remains bullish, and the internal corrective phase looks to be wrapping up. Price is now compressing at a decisive volume level — and a clean break of it is the trigger for the next leg toward the liquidi
Amazon (AMZN) – Buy Signal AlertAMZN is pulling back into a key support zone, and I'm looking for one more move lower before buyers step in.
Entry: $205.43
Stop Loss: $192.95
🎯 Targets
• Take Half: $231.88
• Final Target: $275.68
Once price reaches $231.88, move your stop loss to breakeven and let the rest of the position run t
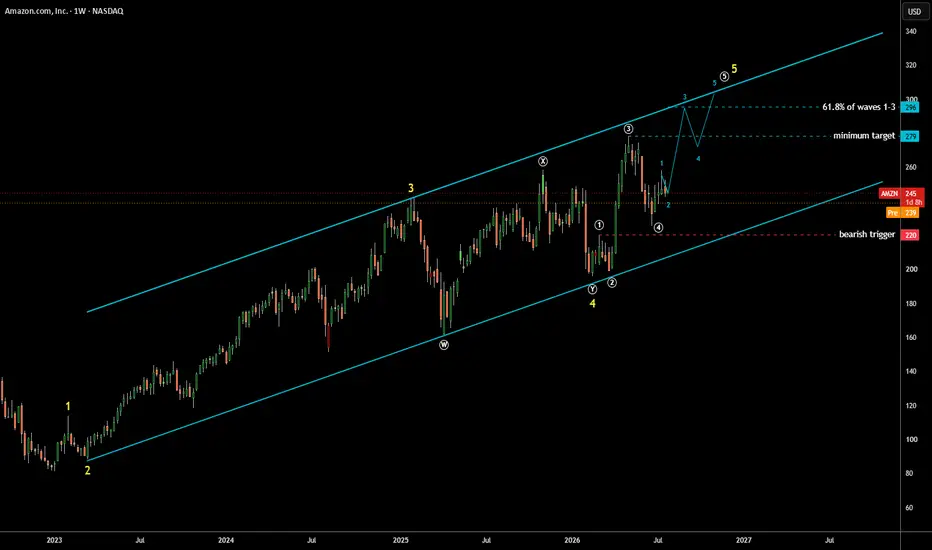
Amazon (AMZN) Has Another Spike Pending Despite Selling PressureThe stock price has built very clear bullish impulse
4 out of 5 large yellow waves are accomplished
Final wave 5 is in progress
4 out of 5 white subwaves are done
Last white wave 5 of large final yellow wave 5 kicked off last month
We've got only the first blue wave 1 completed
Blue wave 2 is abou
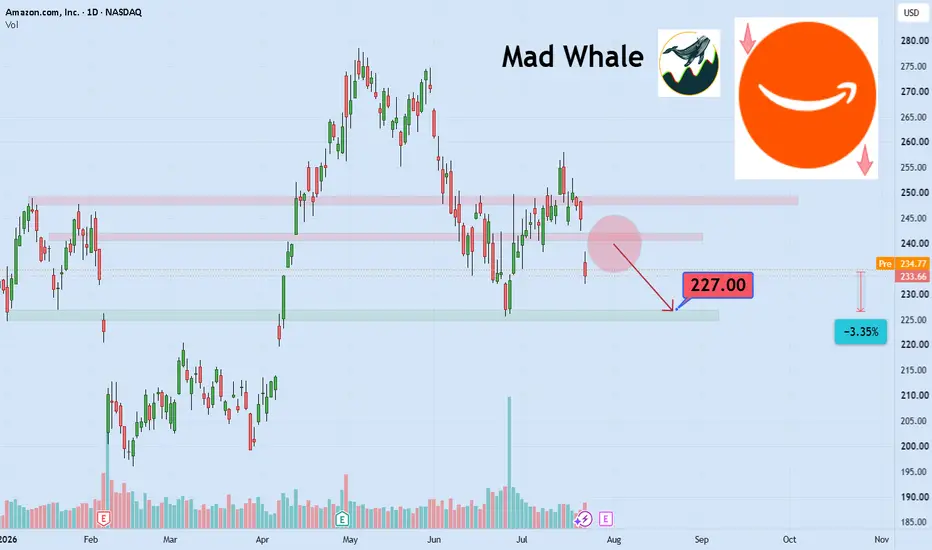
AMAZON: Last Chance!Primary Scenario
We continue to see AMZN in a broader downtrend. In this context, the stock is likely to move below support at $220.47 in the near term.
Alternative Scenario
At this time, we are not tracking a short-term alternative scenario.
Long-Term Outlook
The ongoing broad correction i
AMZN Below $235: Bounce or Another Flush?
WAIT
1 Hour
The 1 hour chart is clearly bearish. AMZN has been making lower highs and lower lows since losing the $248 area, and price remains below the descending trendline.
The recent selloff found temporary support around $231, but the bounce has been weak. AMZN needs to reclaim $235 to $236
Amazon Com, Inc.(AMZN): Price Approaching Trend SupportAmazon (NASDAQ: AMZN) shares are currently hovering around $246.74. Investor attention is focused on AWS's massive AI infrastructure rollout, fueled by recent $25 billion bond issuance and massive compute commitments with heavyweights like OpenAI, Anthropic, and Meta.
Technical Insight:
AMZN is mak
See all ideas
Summarizing what the indicators are suggesting.
Neutral
SellBuy
Strong sellStrong buy
Strong sellSellNeutralBuyStrong buy
Neutral
SellBuy
Strong sellStrong buy
Strong sellSellNeutralBuyStrong buy
Neutral
SellBuy
Strong sellStrong buy
Strong sellSellNeutralBuyStrong buy
An aggregate view of professional's ratings.
Neutral
SellBuy
Strong sellStrong buy
Strong sellSellNeutralBuyStrong buy
Neutral
SellBuy
Strong sellStrong buy
Strong sellSellNeutralBuyStrong buy
Neutral
SellBuy
Strong sellStrong buy
Strong sellSellNeutralBuyStrong buy
Displays a symbol's price movements over previous years to identify recurring trends.
6.580% YTM
Maturity dateMar 13, 2076
Coupon6.05% (Fixed)
6.500% YTM
Maturity dateNov 20, 2065
Coupon5.55% (Fixed)
6.484% YTM
Maturity dateMar 13, 2066
Coupon5.95% (Fixed)
6.420% YTM
Maturity dateJul 9, 2056
Coupon6.10% (Fixed)
6.412% YTM
Maturity dateMar 13, 2056
Coupon5.80% (Fixed)
6.374% YTM
Maturity dateJul 9, 2066
Coupon6.25% (Fixed)
6.335% YTM
Maturity dateNov 20, 2055
Coupon5.45% (Fixed)
6.316% YTM
Maturity dateMay 12, 2061
Coupon3.25% (Fixed)
6.305% YTM
Maturity dateAug 22, 2057
Coupon4.25% (Fixed)
6.262% YTM
Maturity dateJun 3, 2050
Coupon2.50% (Fixed)
6.260% YTM
Maturity dateMay 12, 2051
Coupon3.10% (Fixed)
See all AMZ bonds
Weight3.17%
Market value73.27 B
Weight3.61%
Market value60.61 B
Weight3.56%
Market value30.83 B
Weight3.56%
Market value27.92 B
Weight4.16%
Market value18.81 B
Weight4.46%
Market value16.94 B
Weight3.56%
Market value5.68 B
Weight3.56%
Market value5.43 B
Weight3.56%
Market value5.43 B
Weight3.56%
Market value5.43 B
Weight23.20%
Market value4.90 B
Explore more ETFs
Frequently asked questions
The current price of AMZ is 203.75 EUR — it has increased by 1.30% in the past 24 hours. Watch Amazon.com, Inc. stock price performance more closely on the chart.
Depending on the exchange, the stock ticker may vary. For instance, on GETTEX exchange Amazon.com, Inc. stocks are traded under the ticker AMZ.
AMZ stock has fallen by −4.28% compared to the previous week, the month change is a 3.88% rise, over the last year Amazon.com, Inc. has showed a 2.86% increase.
We've gathered analysts' opinions on Amazon.com, Inc. future price: according to them, AMZ price has a max estimate of 324.25 EUR and a min estimate of 201.56 EUR. Watch AMZ chart and read a more detailed Amazon.com, Inc. stock forecast: see what analysts think of Amazon.com, Inc. and suggest that you do with its stocks.
AMZ stock is 2.04% volatile and has beta coefficient of 0.71. Track Amazon.com, Inc. stock price on the chart and check out the list of the most volatile stocks — is Amazon.com, Inc. there?
Today Amazon.com, Inc. has the market capitalization of 2.20 T, it has decreased by −0.56% over the last week.
Yes, you can track Amazon.com, Inc. financials in yearly and quarterly reports right on TradingView.
Amazon.com, Inc. is going to release the next earnings report on Jul 30, 2026. Keep track of upcoming events with our Earnings Calendar.
AMZ earnings for the last quarter are 2.41 EUR per share, whereas the estimation was 1.41 EUR resulting in a 70.22% surprise. The estimated earnings for the next quarter are 1.59 EUR per share. See more details about Amazon.com, Inc. earnings.
Amazon.com, Inc. revenue for the last quarter amounts to 157.11 B EUR, despite the estimated figure of 153.44 B EUR. In the next quarter, revenue is expected to reach 172.30 B EUR.
AMZ net income for the last quarter is 26.19 B EUR, while the quarter before that showed 18.04 B EUR of net income which accounts for 0.00% change. Track more Amazon.com, Inc. financial stats to get the full picture.
No, AMZ doesn't pay any dividends to its shareholders. But don't worry, we've prepared a list of high-dividend stocks for you.
As of Jul 27, 2026, the company has 1.58 M employees. See our rating of the largest employees — is Amazon.com, Inc. on this list?
EBITDA measures a company's operating performance, its growth signifies an improvement in the efficiency of a company. Amazon.com, Inc. EBITDA is 139.04 B EUR, and current EBITDA margin is 20.97%. See more stats in Amazon.com, Inc. financial statements.
Like other stocks, AMZ shares are traded on stock exchanges, e.g. Nasdaq, Nyse, Euronext, and the easiest way to buy them is through an online stock broker. To do this, you need to open an account and follow a broker's procedures, then start trading. You can trade Amazon.com, Inc. stock right from TradingView charts — choose your broker and connect to your account.
Investing in stocks requires a comprehensive research: you should carefully study all the available data, e.g. company's financials, related news, and its technical analysis. So Amazon.com, Inc. technincal analysis shows the sell today, and its 1 week rating is neutral. Since market conditions are prone to changes, it's worth looking a bit further into the future — according to the 1 month rating Amazon.com, Inc. stock shows the buy signal. See more of Amazon.com, Inc. technicals for a more comprehensive analysis.
If you're still not sure, try looking for inspiration in our curated watchlists.