BTC vs DXY: The Correlation TrapIt’s easy to treat the US Dollar Index TVC:DXY and Bitcoin as a strict 1:1 inverse relationship, but zooming out on the weekly chart shows it’s far less definitive on a real time basis.
Lead/Lag Mismatches & Decoupling
2025 Rollover: TVC:DXY broke down hard out of its range in early 2025, but Bitcoin didn’t immediately moon, sure it went higher but it lagged, topped out, and then followed TVC:DXY downward into a sharp multi month distribution.
2026 Bottoming: TVC:DXY carved out a structural floor zone in early 2026 and began grinding upward. Yet, Bitcoin hasn't shown the inverse elasticity traders expect; its recovery attempt stalled near $67k, leaving price structure looking heavy. There is more though.
Why BTC Remains Weak Right Now
When TVC:DXY puts in a macro bottom, it acts as a silent drain on risk assets, but the current weakness in BTC stems from a compounding liquidity squeeze:
Real Yield Pressure: With TVC:TNX (US10Y) pushing, capital is being lured toward risk free yield rather than speculative duration or crypto beta.
Loss of Independent Catalysts: During the 23 - 24 push, heavy ETF inflows and halving narratives overrode standard macro headwinds. With those flows neutralizing, BTC is exposed to broader macro tightening.
Conclusion:
The US Dollar and Yields are keeping a heavy lid on the CRYPTOCAP:BTC run. Legislature on the Crypto bill is not helping. With Bitcoin struggling hard the light at the end of the tunnel we mentioned is quickly dimming.
In-depth trading ideas
Failed auction into vwap longhi like you guys can see, we are above value, my idea is simple: start the week with a retest and then start trending upwards if the data is good.
you have the weekly val the vwap and poc close to each other on the same levels so thats my confluence right there.
if we fail to hold this 64k then we may have to rotate into the 60k box again.
lets see together what tradfi will do
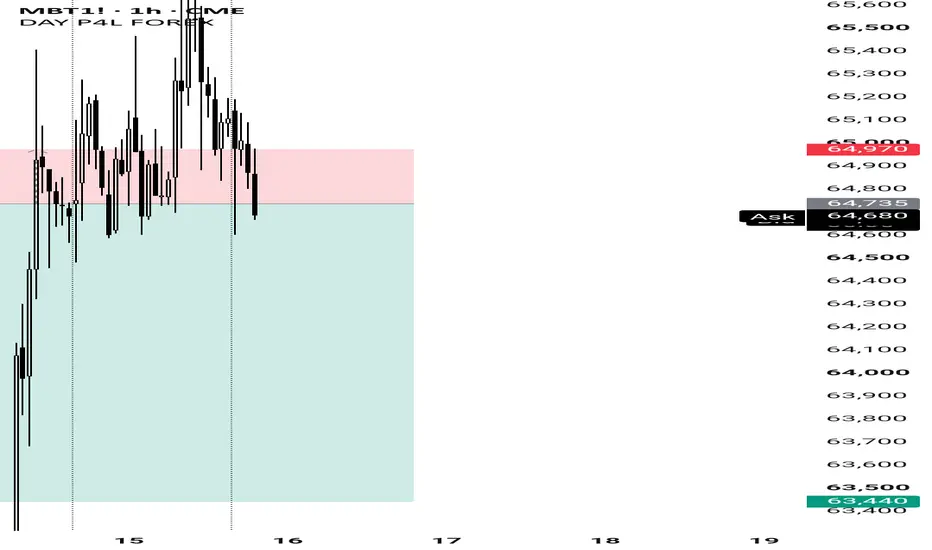
BITCOIN Long
BITCOIN BUY LIMIT ORDER : 65405
Stop Loss: 64860
Remove risk/Partials @: 65975
Take profit: 66085
Trade Plan: Long
Bias: BULLISH short term.
Entry reason: Price will most likely test key TPO area.
Fundamentally: The short-term valuation tool also shows temporarily undervalued against the competing index
Stop Loss: Below nearest low.
First target: 65975
Please refer to BTCUSD for CFDs symbols
Bitcoin Short
Bitcoin SELL MARKET ORDER : 66265
Stop Loss: 65965
Take profit: 6.2720
Trade Plan: Short
Bias: BEARISH short term.
Entry reason: Price has tested key TPO area.
Fundamentally: The short-term valuation tool also shows temporarily overvalued against the competing index
Stop Loss: Above nearest high.
Please refer to BTCUSD for CFDs symbols
End of day trap but beginningThe reason why I took the cell is because the double top formation from the previous days New York session close,
It is led to believe that once market has gone One direction strongly it is expected for market controllers to distribute a double top formation of some sort to reverse the market.
It is further evident that this structure on The daily time frame poses a good sell momentum within the consolidated range
X-Perps: A More Powerful Way to Trade, Now Live in Europe⚠️ Eligible EEA residents only — 18+, advanced verification required.
📣 Announcement + explainer — not a trade idea.
This chart is the BTC X-Perp — a MiFID-regulated Bitcoin futures contract, now tradable directly on OKX<>TradingView in the EEA. It's new here, so here's the 2-minute version.
What's an X-Perp?
"Expiry Perp" — a leveraged contract that tracks Bitcoin's price. You trade the move; you don't own the coin.
Long or short — profit either direction, or hedge spot without selling it
Up to 10x leverage — more exposure per euro of margin (amplifies losses too)
Multi-asset margin — BTC, ETH, SOL, stablecoins, even EUR or USD
The contract in numbers:
0.01 BTC size — USD-margined, cash-settled
Tracks a multi-exchange BTC index — no single-venue anomalies
Funding every 8h keeps price anchored to spot (paid between longs and shorts, not to the platform)
24/7 trading , one expiry: 28 Mar 2031
Negative balance protection — you can't lose more than your collateral
Vs. what you already trade:
Spot : adds shorting + leverage; you give up ownership, funding costs apply
Classic futures : no quarterly rollovers — one contract, five years out
Standard perps : same trading feel, but MiFID-regulated in the EEA, not offshore
CFDs : exchange-traded pricing and deep liquidity, not dealer spreads
If you can trade perps, you can trade this. The 2031 expiry is structural — most positions run days or weeks, not years.
Also new on TradingView in Europe via OKX: SPCX (SpaceX) + the Magnificent 7, SPY & QQQ, Gold, Silver, WTI & Brent — plus BTC, ETH, SOL, XRP and more. Low-latency engine, deep liquidity, 1:1 Proof of Reserves, 120M+ traders worldwide.
Connect once, trade from the chart:
Open the Trading Panel on this chart
Select OKX as broker → Log in
Connect → Authorize
👉 New to X-Perps on TradingView (EEA)? Here's a simple guide for European traders HERE
👉 No OKX account? Create one (EEA — KYC + appropriateness test). New to leverage? Try demo trading first.
👉 Trading Gold, Oil or Silver as an X-Perp? Here's everything you need to know HERE
⚠️ Available to eligible EEA residents only. Expiry Perps are leveraged derivatives; leverage amplifies gains and losses, which can occur quickly — these products may not be suitable for all investors. Funding costs and liquidation risk apply; monitor your margin and consider stop-losses. OKX Europe Markets Limited is authorised and regulated by the Malta Financial Services Authority under the Investment Services Act. OKX Europe Limited is authorised as a Crypto-Asset Services Provider under MiCA (Chapter 647, Laws of Malta). This is an announcement, not investment advice.
Bitcoin Reaches Its First Weekly SupportCOINBASE:BTCUSD BINANCE:BTCUSDT CME:BTC1! Hello traders,
I hope you're having a great week.
After several weeks of heavy selling pressure, driven by institutional distribution, concerns over MicroStrategy's potential selling activity, and other bearish factors, Bitcoin has finally reached its first major support zone on the weekly timeframe.
If this support holds, we could see a recovery toward the liquidity zones around 65K and 67K. A successful breakout above these levels would open the way for the next bullish targets at 75K and 80K.
For now, the overall structure remains intact, and all eyes are on how price reacts at this key weekly support.
What do you think? Will this support hold, or is there more downside ahead? 📈
BITCOIN Short
BTC SELL MARKET ORDER : 63635
Stop Loss: 65230
Remove risk/Partials @ : 62030
Take profit: 61640
Trade Plan: Short
Bias: BEARISH short term.
Entry reason: Price has tested key TPO area. The short-term valuation tool also shows temporarily overvalued against the index
Stop Loss: Above nearest high.
First target: 62030
Please refer to BTCUSD for CFDs symbol
BTMM - BTC - sell iseaThe reason I'm taking this trace because there's a clear to find consolidation peak formation in other words this could be a rounded top for distribution..
Structures more agitations because there's so much consolidation that if there is a price correction towards the downside it should be of those fast pops.
Easy money.
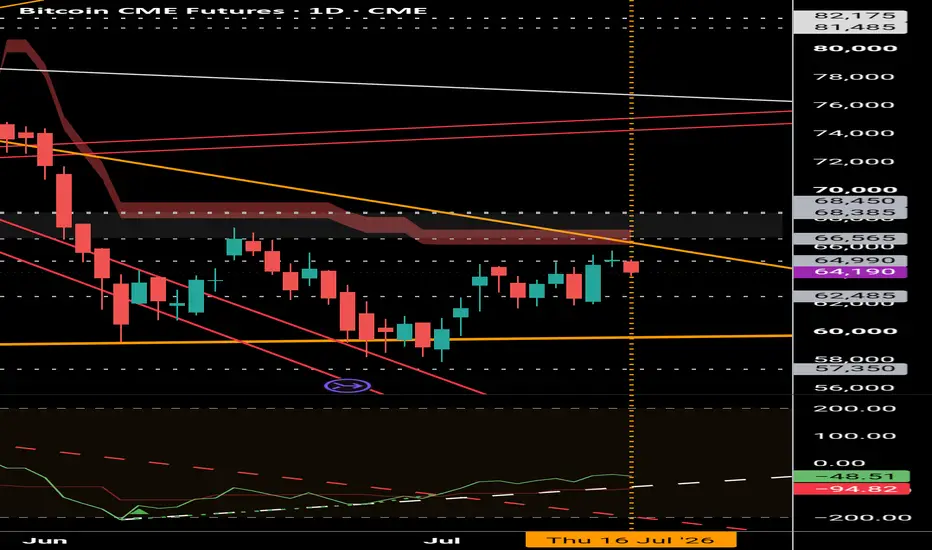
The Larger Pattern Unfolding on Bitcoin and Ethereum!A lot of traders are focused on short term noise, but zooming out shows a clear story taking shape on Bitcoin!
On the 4Hr chart, we see a small inverse head and shoulders pattern formed. Need confirm for the breakout, we believe it will happen. However, the true story is the much larger inverse head and shoulders structure taking shape on the daily view!
In another post, we discussed how CRYPTOCAP:BTC often needs to print a quick lower low to sweep liquidity before a real bottom can form. That exact scenario is playing out. The recent dip flushed out weak hands, satisfied that lower low requirement, and trapped aggressive sellers at the bottom.
Now, we watch if the right shoulder develops.
As price pushes higher to form this right shoulder, the target projection points directly toward the previous gap region around 82k. That area previously acted as resistance, but once price reclaims it, it transforms into the neckline support for the macro pattern.
We are not forcing trades or guessing. In our opinion, longs are not late, still time. We are also letting the right shoulder build strength while watching price respect key support levels. We will sell some at the supposed neckline/resistance level & wait for some sort of retracement to see if it pans out as we believe.
If Bitcoin builds out this larger right shoulder and Ethereum holds its new momentum, the entire market structure aligns for a major expansion phase.
To touch on CRYPTOCAP:ETH , not shown, the setup there looks equally constructive. Ethereum defended its macro floor around 1600 and carved out a sharp rebound. Its daily strength has climbed nicely, and price is actively challenging its key moving averages. This behavior suggests solid accumulation is taking place right into resistance, look at the recent volume.
Bitcoin at 58,000 Support Buy the Dip or Trapdoor Lower?Bitcoin's Rollercoaster July Fed Whiplash, ETF Outflows and War Drums in the Gulf
Bitcoin has spent the past month whipsawing between fresh macro pressure and short lived relief rallies, and the headlines behind the move matter as much as the chart itself. US listed Bitcoin ETFs suffered their worst month on record in June, with roughly 4.5 billion dollars in net outflows, and most of that selling came from BlackRock's IBIT fund while retail buyers largely stayed on the sidelines and a handful of corporate holders kept accumulating. That outflow pressure coincided with a full weekly close below 60,000 dollars in late June, which also marked Bitcoin's first weekly close below its 200 week moving average since 2023. The macro backdrop turned more decisive when new Federal Reserve Chair Kevin Warsh held rates steady at his first meeting in June and stripped out the rate cuts markets had priced in for the rest of the year, a repricing that dragged Bitcoin down from the low 70,000s toward 60,000.
Sentiment then found brief relief in early July as a softer June jobs report, only 57,000 jobs added against expectations above 100,000, combined with a friendlier tone from Warsh to lift Bitcoin back above 63,000. That relief has since been complicated by a sharp escalation between the United States and Iran, with Iran striking dozens of US linked sites in Bahrain and Kuwait and the US carrying out large-scale retaliatory strikes across Iranian territory, raising fresh concern over the Strait of Hormuz and pulling risk appetite lower across global markets.The July 28 and 29 Federal Reserve meeting remains a key date on the radar, with markets currently pricing roughly 70% odds of another hold, while the ongoing Gulf conflict warrants continued monitoring given its capacity to move oil prices and broader risk sentiment in either direction on short notice.
What the Market Has Done
Market was in a consolidation range between 84,000 (Daily level 1) and 66,000 (Daily level 2) from February to May.
In mid April, buyers were able to bid prices above yearly VWAP and attempted to accept and continue higher.
Sellers defended the 84,000 area (Daily level 1), which resulted in longs giving up and liquidating, causing prices to sell off down to the 66,000 area (Daily level 2).
Market subsequently broke below 66,000 and moved down to the 58,000 area (Daily level 3).
Since then, the market has established value lower and has been in a two-way rotation within June's value area.
What to Expect in the Coming Weeks
The key levels to watch are 63,000 (Daily level 2) and 58,000 (Daily level 3).
Neutral Scenario
Expect continued two-way auction between 63,000 and 58,000 before further directional resolution.
A period without fresh, market moving headlines out of the Gulf conflict or from Federal Reserve officials would likely keep participants balanced on both sides of the range, supporting continued two way rotation between 58,000 and 63,000 until a new catalyst emerges.
Bullish Scenario
If the market is able to reclaim back above 63,000, expect a move up to the 74,300 area, which lines up with the midpoint of the consolidation range and the projected yearly VWAP.
Expect sellers to respond at that level, and if they fail to hold it, expect continuation back up to the 84,000 area (Daily level 1).
A cooler than expected mid July inflation report, renewed ETF inflows, or a de-escalation in the Gulf conflict that eases oil driven inflation fears could act as the trigger for this scenario.
Bearish Scenario
If buyers are not able to defend 58,000 and price breaks down below it, expect a move down to the 51,000 area (Daily level 4).
Expect responsive buyers at that level, and if they fail to hold it, expect further downside toward the 44,000 area (Daily level 5).
A hawkish hold or surprise rate hike from the Federal Reserve on July 28 and 29, continued heavy ETF outflows, or a sharp escalation in the US Iran conflict that closes or threatens the Strait of Hormuz could act as the trigger for this scenario.
Conclusion
Technically, Bitcoin remains locked in a two-way rotation between 58,000 and 63,000, and the reaction at either boundary should set the tone for the next leg, with a reclaim of 63,000 opening the door toward 74,300 and a breakdown of 58,000 exposing 51,000. Fundamentally, the path from here likely hinges on the Federal Reserve's July 28 and 29 decision, the direction of ETF flows after June's record outflows, and whether the US Iran conflict in the Gulf continues to escalate or finds a path toward de-escalation. The technical levels and the macro catalysts should be viewed as connected rather than separate, since a single headline out of the Fed meeting or the Gulf could easily accelerate either scenario. Which scenario do you think plays out first, a reclaim of 63,000 or a breakdown below 58,000?
Disclaimer: Past performance is not necessarily indicative of future results. Trading futures involves substantial risk of loss and is not appropriate for all investors. This content is intended for informational and educational purposes only and does not constitute trading advice or a solicitation to buy or sell any futures contract. Trade your own plan and manage risk.
Acronyms:
C - Composite
w - Weekly
m - Monthly
VA - Value Area
VAH - Value Area High
VAL - Value Area Low
VPOC - Volume Point of Control
LVN - Low Value Node
LVA - Low Value Area
HVN - High Value Node
HVA - High Value Area
SP - Single print
ATH - All time high
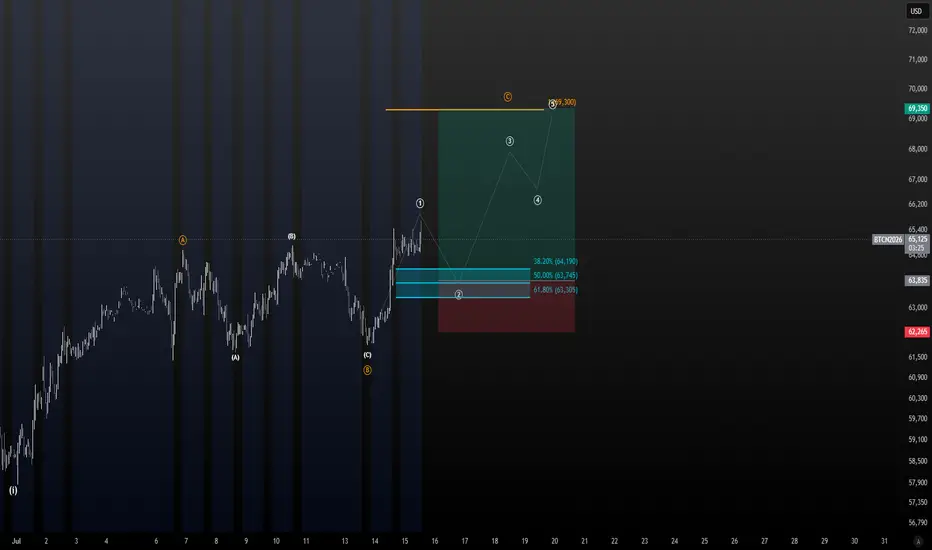
Wave (IV) May Be Preparing the Next Bullish CycleBitcoin Futures (BTC1!) – Daily Chart
Aggressive Scenario: Wave (IV) May Be Preparing the Next Bullish Cycle
Based on the current market structure, the preferred wave count is derived from the rules and guidelines of the Elliott Wave Principle.
The preferred interpretation suggests that the decline from the recent high is developing as Wave (IV) of a larger degree. At this stage, the correction is most likely unfolding as a Bigger Zigzag, with the market progressing through its internal a-b-c structure before Wave (IV) reaches completion.
As long as this wave count remains structurally consistent, the completion of Wave (IV) could provide the foundation for the next impulsive advance in Wave (V).
Based on the current wave structure and Fibonacci relationships, the initial objective would be the First Target Range, followed by the Target Range. If Wave (V) extends, the market could eventually reach the Expanded Target, completing another major impulsive sequence.
However, until Wave (IV) is confirmed as complete, every bullish objective should be viewed strictly as a structural scenario, rather than a price prediction. The ongoing corrective structure will determine whether Wave (IV) concludes as a relatively straightforward correction or evolves into a more complex pattern, such as a Multiple Zigzag or another valid corrective formation.
For this reason, the primary focus remains on monitoring the internal development of Wave (IV). Only after the correction is structurally complete can the probability of the next impulsive advance in Wave (V) be evaluated with greater confidence.
If the completion of Wave (IV) is confirmed, the larger bullish cycle is expected to resume. Under this scenario, Wave (V) could carry Bitcoin beyond its previous all-time high and establish a new historical high. The ultimate extent of Wave (V), however, will depend on the strength and quality of the impulsive structure emerging from the completion of Wave (IV).
This analysis presents a structural interpretation based on the Elliott Wave Principle and should not be considered a price prediction. The preferred wave count will be reassessed whenever market structure no longer supports the current interpretation.
— Mr. Nobody
Independent Elliott Wave Principle Researcher
"Patterns whisper. I listen." 📊🎧
Pt 2: The Golden Rule for the Next Bull Market
We've posted much on how Bitcoin trades, here and other social media. However, here is one Indicator to watch for the Real Move!
In our last post, we looked at why Bitcoin might be setting a bear trap. Today, we are looking at the secret engine of the crypto market, which is the total value of all small crypto assets outside the top ten. The index is; $OTHERS.
When we look back at history, smaller crypto assets tell us exactly when real market expansion begins.
The secret key is the weekly Relative Strength Index, or RSI. This tracks the speed and change of market movements on a scale from zero to one hundred. The exact midpoint is fifty.
We found a golden rule by looking at past cycles. When smaller assets drop into oversold territory and grind sideways, you cannot just buy blindly. You must wait for a synchronized confirmation.
The real bull market only starts when Bitcoin AND the smaller assets break above that fifty RSI right around the same time.
Right now, the smaller assets are holding a massive historical floor. Sellers are completely exhausted. But we are still waiting for that final push. If Bitcoin defeats its bearish pattern and both charts cross above that fifty line together, the green light is officially on.
Until then, patience is a virtue. Do not guess the move, let the tape confirm it for you.
Pt1: The Bitcoin Bear Trap?Why the Bitcoin Head and Shoulders Might Fail
A lot of traders are looking at the Bitcoin chart right now and panicking. The price has been carving out lower highs and lower lows inside a clear downward channel, marked by the two descending trendlines on the chart. To the untrained eye, it looks like a collapse is underway.
But looking at the underlying data shows why the sellers might be walking straight into a major trap.
While the price action looks heavy, the momentum underneath is telling a completely different story. If you look at the Relative Strength Index, or RSI, it is actually rising and making higher lows. Even better, our TTM momentum bars at the very bottom are shifting from bright red to a dark red color.
This behavior shows that the downward selling pressure is rapidly losing its strength. When a market prints higher lows on momentum indicators while the actual price drops, it means a positive divergence is forming. Historically, when selling power dries up right as a market hits major historical support levels, a sharp trend reversal follows.
We are not forcing any trades here. We are staying highly disciplined and waiting for the market to prove its strength. If this positive divergence holds, the trapped sellers could be forced to cover their positions, fueling a massive short squeeze. Keep a close eye on the tape.