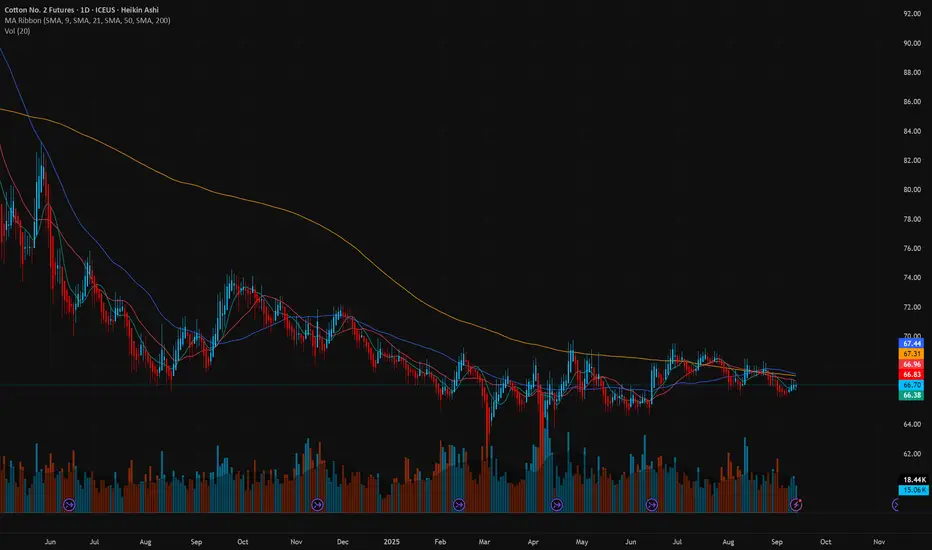
Will Global Supply Shocks Explode Cotton Prices?Cotton sits at a genuine inflection point, but the case for a durable bottom is more mixed than the headlines suggest. Prices have actually declined roughly 4% over the past month even as they ticked modestly higher into July, and the most recent independent analysis available called the bears still in control. The one unambiguous catalyst is policy, not speculation: India's textile ministry lifted its 11% cotton import duty from June 1 through October 30, the second such waiver in a year, giving spinning mills and yarn producers real but limited relief on input costs. That's a genuine support factor. Talk of a sharp, China-driven rebound is not yet backed by the scale of actual purchases on the tape.
The macro picture cuts both ways. A hawkish Federal Reserve has kept the dollar firm, which makes US cotton more expensive for foreign buyers and has kept export sales subdued, while cheaper crude has made synthetic fibers more price competitive, a structural headwind cotton has been fighting for years. Working against that, USDA's latest supply and demand estimates point to a tighter 2026/27 global balance, with world ending stocks projected at their lowest since 2018/19 and production expected to fall almost everywhere except India. That tightening is the more durable bullish argument here, more so than any single rumor of Chinese demand returning.
Underneath the daily price noise, the structural story in cotton is shifting toward risk management rather than speculation. Hedging through forward contracts has become close to mandatory for mills trying to protect margins against this volatility, and the supply side is leaning harder on technology, climate-resilient GM seed traits, drone-based soil monitoring, and precision fertilizer application to protect yields as weather risk in places like India and Texas becomes a bigger swing factor than trade headlines.
The near-term path depends on a narrow set of catalysts worth watching directly: whether Indian monsoon rainfall supports or delays planting, whether US crop conditions hold up through the growing season, and whether China's actual purchase volumes, not rumors of them, start showing up in the weekly export data. Until then, this looks less like an explosive breakout and more like a market searching for a floor amid a genuinely tighter supply outlook.
Cotton No. 2 Futures
No trades
No trades
In-depth trading ideas
Cotton LONGBack at historic support and holding.
Hit its .886 Fib level.
Highest volume ever last month.
Rising oil prices may increase demand for cotton as costs for synthetics increase.
Commodity cycle is in full swing.
Enter now
3 take profits
You can access this trade by finding your regional cotton ETF/ETC.
Long Cotton📌 Cotton Futures: Seasonality, Market Drivers & How to Trade
For more than 7,000 years, cotton has been one of humanity’s most important raw materials. Once spun by hand and woven into basic cloth, today cotton is at the core of the global textile industry, used in apparel, home furnishings, industrial fabrics, and even specialized materials like fishnets and early forms of gunpowder.
Currently, cotton accounts for over 35% of all fiber consumed globally, making it a multibillion-dollar market. Most price discovery happens through cotton futures (CT contracts), which are actively traded on ICE. These futures allow farmers, textile factories, and investors to hedge against price swings, diversify portfolios, or speculate on supply-demand cycles.
🔹 1. Seasonality of Cotton Futures
Like most agricultural commodities, cotton prices follow predictable seasonal cycles:
📈 Winter & Spring (Nov–May): Historically the strongest performance period for cotton futures. Global demand rises as textile factories restock, and weather risks emerge in key producing regions.
📉 Summer & Fall (Jun–Oct): Often weaker, as new crop supply pressures the market.
📌 Example:
Between Nov 2020 and May 2021, cotton futures rallied more than 25% as strong textile demand from China collided with weather-related yield concerns in the U.S.
🔹 2. What Moves Cotton Prices the Most?
Cotton futures are influenced by both global supply conditions and consumer demand cycles.
1️⃣ Global Producers (U.S., India, China)
These three nations account for over 65% of world cotton production.
Weather shocks, export bans, or lower yields in any one of them can create global scarcity.
2️⃣ China’s Cotton Policy
As the largest consumer, China’s stockpiling and release strategy directly impacts global prices.
Import/export restrictions and subsidies amplify volatility.
3️⃣ Substitute Fabrics
Prices of polyester, rayon, and synthetic fabrics influence demand for cotton.
When synthetics are cheap, cotton demand softens; when synthetics are costly, cotton regains market share.
4️⃣ Energy Prices
Cotton production is energy-intensive. Rising oil prices push up cotton costs.
5️⃣ Domestic Policies
Subsidies, tariffs, and trade policies (especially U.S.-China trade tensions) have a strong impact.
🔹 3. How to Trade Cotton & Related Companies
Cotton is not just a commodity — it is directly tied to the global fashion cycle and the profitability of apparel brands. Traders can gain exposure either by trading cotton futures directly or through companies sensitive to cotton prices.
🌎 Publicly Traded Companies with Strong Cotton Exposure
✅ Textile & Apparel Stocks (Direct Cotton Users)
Levi Strauss & Co. (LEVI) → Denim giant heavily dependent on cotton.
Rising cotton = margin squeeze, unless prices are passed to consumers.
📌 2021: Cotton spike → Levi raised jeans prices to protect margins.
V.F. Corporation (VFC) → Brands include Vans, Timberland, The North Face.
High cotton usage in apparel lines.
📌 2022: Cotton inflation + weak demand → VFC’s profits fell sharply.
Ralph Lauren (RL) → Premium brand with better pricing power.
Less vulnerable than mass-market peers.
📌 2023: Cotton price drop improved margins → RL stock up ~20%.
Hanesbrands (HBI) → Global cotton undergarments producer.
Very exposed to raw cotton cycles.
📌 2022: Rising cotton costs + supply chain issues → stock collapsed ~70%.
Gildan Activewear (GIL) → Supplier of cotton-heavy t-shirts & socks.
📌 2021–22: Cotton spike pressured margins, though hedging softened impact.
🌎 Cotton Producers & Agricultural Stocks
Bunge (BG) & Archer Daniels Midland (ADM) → Global agricultural traders handling cotton exports.
Louisiana-Pacific (LPX) → Agricultural supplier with indirect cotton exposure.
Plains Cotton Cooperative Association (Private) → One of the world’s largest cotton cooperatives.
📌 2021 Example: When cotton demand surged, both BG and ADM rallied as trading volumes spiked.
🌎 Private Cotton Leaders (Not Publicly Traded)
Cotton Incorporated (USA) → Research & marketing firm for cotton.
Lummus Corp (USA) → Cotton ginning & processing equipment.
Sateri (China) → World’s largest producer of cotton-based textiles.
❌ Indirect Retail Play: Dick’s Sporting Goods (DKS)
While not a pure cotton stock, DKS sells cotton-heavy apparel and sportswear.
📌 Best during: Sporting event seasons + cotton demand cycles.
However, DKS is more tied to Nike/Adidas trends than cotton futures directly.
🔹 4. Cotton Trading Playbook
✅ When Cotton Prices Rise:
Bullish: Cotton producers & traders (BG, ADM, LPX).
Bearish: Apparel companies (Levi, Hanes, Gildan).
Neutral: Premium brands (Ralph Lauren) → can pass costs to consumers.
📌 2021 Example: Cotton surged → producers gained, apparel stocks fell.
✅ When Cotton Prices Fall:
Bullish: Apparel companies (Levi, Hanes, Gildan, DKS).
Bearish: Cotton producers face revenue compression.
📌 2018 Example: Cotton dropped → apparel margins expanded, retail stocks gained.
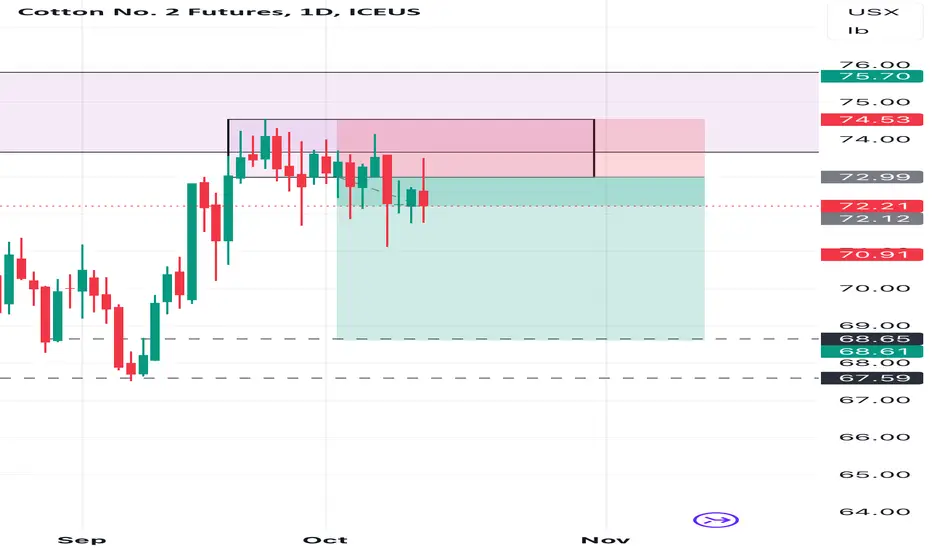
📌 Best Cotton Trading Strategy - Short-only
✅ When Cotton Prices Fall below the 200 SMA.
Short the following open after the close is higher than the 20-day high.
Cover after 5 days, at open.
📌 Conclusion:
Cotton is one of the most historically important and globally traded soft commodities, directly linking farmers, textile factories, fashion brands, and consumers.
✅ Seasonality Edge: Cotton tends to rally in winter & spring (Nov–May) and weaken in summer & fall (Jun–Oct).
✅ Fundamental Edge: Watch U.S., India, China output + China’s stockpiling policy.
✅ Corporate Edge: Trade apparel stocks alongside futures — when cotton prices rise, buy producers (BG, ADM) and short consumer apparel (Levi, Hanes). When prices fall, flip the trade.
✅ Hedging Edge: Cotton futures remain a reliable hedge against inflation, textile input costs, and global supply chain shocks.
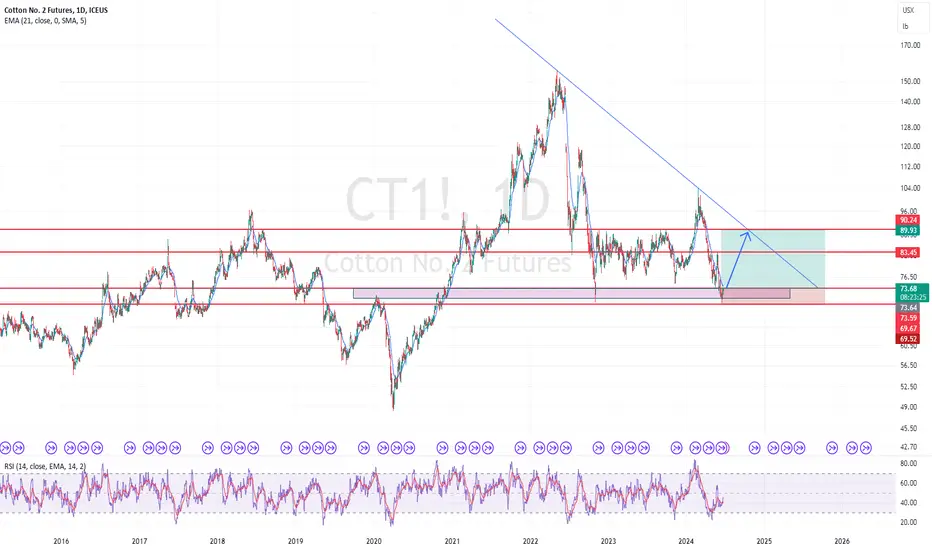
Clear Diversions = Time to enter### **Cotton No. 2 Futures (CT1!) - Bullish Divergence & Trade Setup**
(**Not Financial Advice**)
#### **📌 Key Observations:**
- **Bullish Divergence**: RSI is making higher lows while price is making lower lows → Indication of **potential reversal**.
- **Support & Resistance Levels**:
- **Support:** 🟢 **65.73** (Major Demand Zone)
- **Resistance Levels:**
- **67.29 - 67.44** (First Resistance Zone)
- **68.17 - 68.40** (Strong Resistance, possible reaction area)
- **84.60** (Key Liquidity Area, Major Resistance)
#### **🎯 Short-Term Bullish Targets (TP Levels)**
1️⃣ **67.36 - 67.44** → First Take Profit (Minor resistance, watch for reactions)
2️⃣ **68.40** → Strong resistance, key breakout level
3️⃣ **94.60** → Major liquidity zone (long-term target if momentum builds)
#### **🔹 Trade Setup Consideration:**
- **Entry:** Around current price action if it holds above support.
- **Stop-Loss (SL):** Below **61.73** to manage risk.
- **Confirmation:** Price closing above 67.44 would strengthen bullish case.
Would you like a risk-management strategy for this trade? 🚀 (**Not Financial Advice**)
Cotton Futures: Decoding the Matrix of Market ForcesCotton, a seemingly unassuming commodity, is quietly aligning for a significant bullish move. But remember—this is not a prompt for reckless action. The entry is reserved for those who wait for the Daily timeframe to confirm the trend change.
The Codes of the Cotton Conspiracy
Code #1: The Commercial COT Index
Commercials are not merely dabbling—they are at an extreme in positioning, maxed out over a 26-week lookback. Their hands are heavy with longs, signaling a brewing storm that only the wise will prepare for.
Code #2: All-Time Extreme Positioning
For the first time since 2019, commercials hold their maximum long positions. Unlike 2019, these positions are at higher prices, implying deeper convictions. Meanwhile, Large Speculators are excessively short—a telltale sign that the tide may soon turn. Both are at an all-time extreme in positioning.
Code #3: Valuation Metrics
Cotton stands undervalued against the pillars of Gold, DXY, and Treasuries. The market’s mispricing is your opportunity, should you dare to seize it.
Code #4: Open Interest Analysis
Open Interest (OI) has been climbing steadily, a silent crescendo. Who is fueling this growth? The commercials—those orchestrators of market moves—are discreetly accumulating, signaling an impending bullish wave.
Code #5: ADX Over 60—The Endgame Approaches
The ADX has breached the critical threshold of 60, a harbinger of trend exhaustion. Confirmation lies in the ADX’s roll-over or the Large Speculators’ retreat from their short positions.
Code #6: Spread Divergence
As prices sink to new lows, the spread between the front and next month contracts defiantly rises—commercials are eager for the front month, a potent sign when paired with extreme positioning.
Bonus Codes: Hidden Layers of Accumulation
Insider Acc Index and ProGo hint at quiet accumulation. Momentum shows bullish divergence, %R enters a buy zone, and the oversold stochastic adds another layer of intrigue.
The Flaws in the System
Yet, no system is without its anomalies. Small Speculators are excessively long—a peculiar deviation, given their knack for misjudging bottoms. This anomaly presents two scenarios: a merciless long squeeze forcing out the naive, or a rare stroke of luck for the masses. Moreover, while True Seasonal is misaligned, remember that seasonals reflect historical ghosts, while positioning unveils the machinations of today's masters. Always lean towards positioning as your guide, not seasonals.
The Red Pill Awaits
The stage is set. The players are in position. The market whispers secrets only a few are willing to hear. Cotton’s matrix is laid bare—whether you act or remain a spectator is the choice only you can make.
But beware, the rabbit hole goes deeper than you think. Are you ready to follow?
Choose wisely.
Cotton: Navigating the DeclineCOTTON, in a long-term decline since last February is currently stuck within a narrowing range, with a minimum break above 70 cents per pound needed to change the negative outlook.
However, it is worth noting managed money accounts have held a net short position for a record-breaking 39 weeks. In the week to 21 January it reached a near record short position of 48.4k contracts, potentially increasing the risk of short covering on a technical break to the upside
Smart Money Positioned to LONG Cotton - COT StrategyDISCLAIMER: This is not trade advice. This is for educational purposes only to demonstrate how I am looking to participate in this market. There is significant risk involved in trading, do your own homework and due diligence.
COT Strategy
LONG
Cotton (CT)
My COT strategy has me on alert for long trades in CT if we get a confirmed bullish change of trend on the Daily timeframe.
COT Commercial Index: Buy Signal
Valuation: Undervalued vs Gold
Extreme Positioning: Commercials around max long of last 3 years - bullish. Small specs around max short of last 3 years - bullish.
OI Analysis: "Bubble Up" of positioning happening between commercials and large specs = bullish.
COT Small Spec Index: Buy Signal
Supplementary Indicators: UO & Momentum (not yet confirmed)
Remember, this is not a "Long Now" idea. These indicators are not timing tools. They simply tell us that this market could have a move of some significance to the upside, which we will participate in with a confirmed Daily trend change to the upside.
Good luck & good trading.
Upside Ahead for Cotton - COT Strategy BuyDISCLAIMER: This is not trade advice. This is for educational purposes only to demonstrate how I am looking to participate in this market. There is significant risk involved in trading, do your own homework and due diligence.
COT Strategy
LONG
Cotton (CT)
My COT strategy has me on alert for long trades in CT if we get a confirmed bullish change of trend on the Daily timeframe.
COT Commercial Index: Buy Signal
Extreme Positioning: Commercials more long than they've been in 3 years = bullish.
OI Analysis: We are seeing a "Bubble Up" between Commercials & Large Specs. This is a sign of a significant bottom being formed.
Valuation: Undervalued VS Gold
COT Small Spec Index: Buy Signal
Supplementary Indicators: %R Buy Signal
Remember, this is not a "Buy Now" idea. These indicators are not timing tools. They simply tell us that this market could have a move of some significance to the upside, which we will participate in with a confirmed Daily trend change to the upside.
Good luck & good trading.
Cotton sowing minus in india 56% minuseAll india cotton sowing minus 56 % in india, so bullish cotton price target 75000 per candy.
Good future for cotton buyer
CLong
CShort
Cotton #2 overextended, possible retracementAnalysis: Price experienced a sharp decline over the short period and can now be seen as extended. Reversal position (long) can be taken to trade the potential retracement or even reversal.
Long opportunity: High risk Long at market as reopening towards 83.89 as Take Profit - 1 level.