U.S. Dollar Index Futures (DXY) – 1H Technical AnalysisMarket Structure
The DXY is showing a potential bullish reversal structure after the sharp decline from the 101.48 area.
Price formed a significant base around 98.685, followed by a sequence of higher lows. The latest move has pushed price back toward the descending trendline, creating a critical
Peers for comparison
Dollar Index (DXY) Double Three Rally Likely to Break LowerThe short‑term Elliott Wave view in the Dollar Index (DXY) indicates that the Index is correcting the cycle from the June 24, 2026 high within a double three structure. From the August 20, 2026 low, wave ((w)) concluded at 99.86. The subsequent pullback in wave ((x)) unfolded as a zigzag formation,
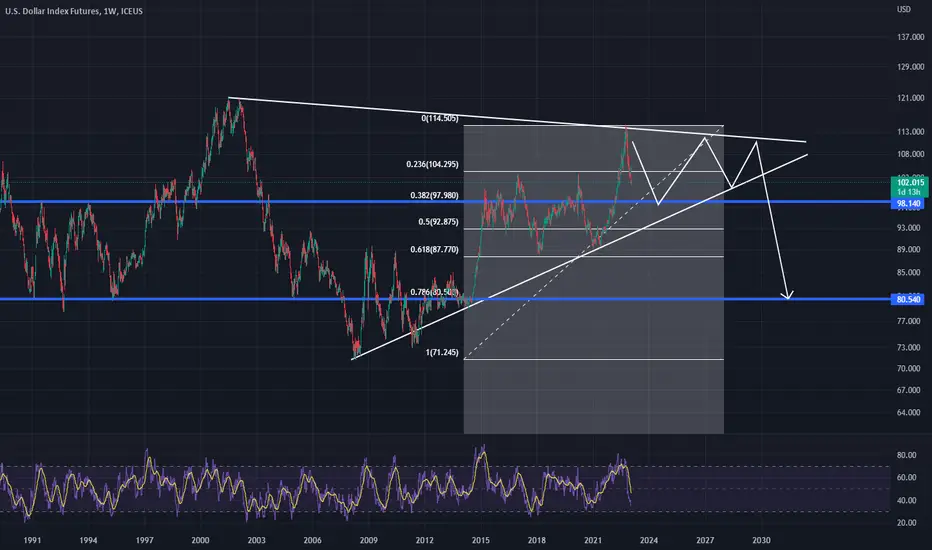
Weekly Rising Wedge On DXYThis looks to be bearish structure. Wanted to check against the community to ask for other opinions. Trend lines are valid.
Little more pump before the DXY drops off into the Low 80s?
Rsi indicated another pump to the top of the wedge, but I could see it falling through after that.
Comment!
No
USD Bulls Case Builds - Though NFP Decides Its FateWith Fed fund futures implying a 54% chance of a September hike, today's NFP report could decide which side of 50% those odds shift by the weekly close. The US dollar has been battered but showing signs of promise around support - so I take a closer look at the dollar index, NFP data and a high-leve
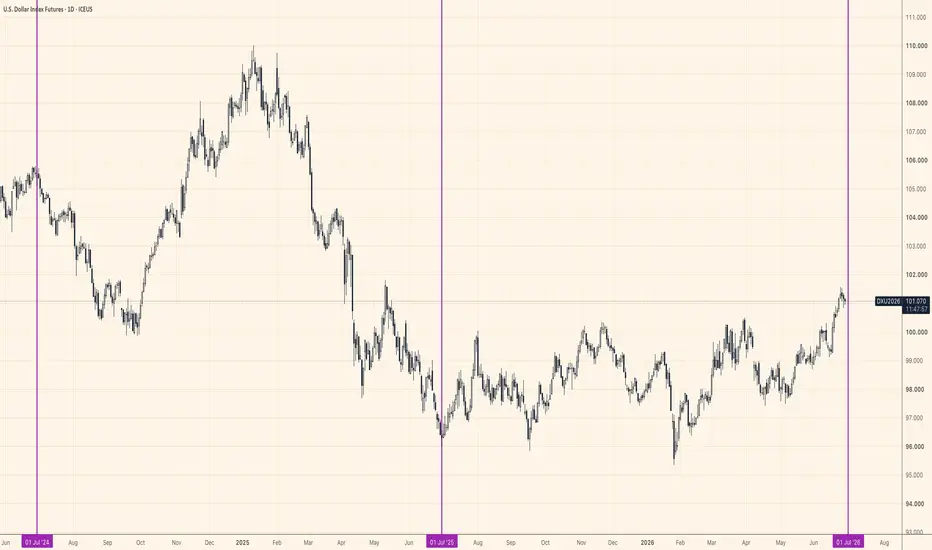
DXY — same date, same reversal, two years runningThe Dollar Index has done something specific on the same date, twice running. July 1, 2024 — reversal. July 1, 2025 — reversal. The vertical lines on this chart mark both of those turns.
Two data points is a coincidence. But the setup around this year's July 1 is worth noting anyway.
The calendar is
$DXY Year long range finally pressing the topBox runs $95.79 to $100.36.
Price has broken out the top and is now testing the May 2025 ceiling at $101.57.
One level decides this and it's the resistance at $101.57.
Daily close above $101.57 on volume opens the measured move.
Range height projects a target near $104.94.
No close above, and
AUD/USD Holds 70c For Now, Key Data AwaitsAUD/USD is called "the battler" with good reason, and it showed resilience last week despite a hawkish Fed meeting, stronger US dollar and less-hawkish than expected RBA. Perhaps it can perform a bounce from 70c this week? But whether it does or how high it can, sits in the hands of AU CPI, employme
US DOLLAR INDEX GAP FILLED WAR TRADE IS BACK!Bullish- seems like everytime Oil bounces the US Dollar becomes a safe haven for the war. Therefore because Oil still holding support levels and making new highs I am bullish the dollar. But even if Oil falls that is also bullish the dollar because lower export demand and commodities and dollar hav
See all ideas
A representation of what an asset is worth today and what the market thinks it will be worth in the future.
Displays a symbol's price movements over previous years to identify recurring trends.
Frequently asked questions
One way to gain exposure to DXH2021 is through a broker that offers futures. Before trading, make sure you understand how the product works and the risks involved.
You can trade DXH2021 directly from TradingView:
– Choose a broker: Explore our supported trading partners and pick one that fits your needs
– Compare options: View available brokers side by side to evaluate fees and features
– Connect your account: Open Supercharts, click "Trade", select your broker, and log in
– Start trading: Place orders directly from the chart
Tip: If you're new to trading, try paper trading first — it lets you practice strategies in real market conditions without risking funds.
You can trade DXH2021 directly from TradingView:
– Choose a broker: Explore our supported trading partners and pick one that fits your needs
– Compare options: View available brokers side by side to evaluate fees and features
– Connect your account: Open Supercharts, click "Trade", select your broker, and log in
– Start trading: Place orders directly from the chart
Tip: If you're new to trading, try paper trading first — it lets you practice strategies in real market conditions without risking funds.
The nearest expiration date for DXH2021 is Mar 15, 2021.
Futures contracts expire on predetermined dates. As expiration approaches, many traders roll positions into the next contract to maintain exposure to the market.
Key metrics to watch near expiration:
• Volume and liquidity: Trading activity often shifts to the next contract month
• Open interest: Falling open interest may signal positions being closed or rolled forward
• Forward curve: Differences between contract prices can help identify market structure, including contango and backwardation
Explore the DXH2021 chart to monitor active contracts and contract-month activity.
Futures contracts expire on predetermined dates. As expiration approaches, many traders roll positions into the next contract to maintain exposure to the market.
Key metrics to watch near expiration:
• Volume and liquidity: Trading activity often shifts to the next contract month
• Open interest: Falling open interest may signal positions being closed or rolled forward
• Forward curve: Differences between contract prices can help identify market structure, including contango and backwardation
Explore the DXH2021 chart to monitor active contracts and contract-month activity.