COFFEE | Return to an upward trend | Week, 17-22 August, 2026Hello Traders!
Long time no see.
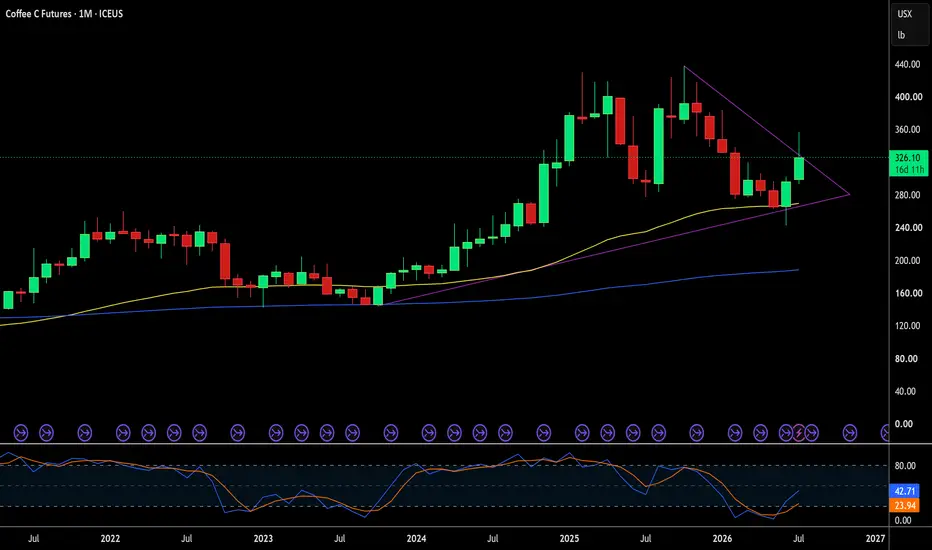
This time, the opportunity has emerged in ICEUS:KC1! with a classic ascending triangle pattern . The signal candle has appeared, breaking the trend line with valid volume.
Then place a Buy Stop and wait for the market's response.
In-depth trading ideas
Are Coffee Futures Brewing a Global Commodity Crisis?The Volatility Brew
Coffee futures face severe global supply shocks today. A powerful earthquake in Colombia recently halted critical coffee exports. Key export hubs and shipping routes experienced immediate operational suspensions. Consequently, ICE-certified Arabica inventories fell toward historical lows. Meanwhile, a Super El Niño threat looms over Brazilian harvests. Commodity traders navigate extreme market volatility across global exchanges. Smart investors look past temporary price spikes. They analyze the core structural drivers across multiple critical domains.
Geopolitics and Geostrategy
Coffee production relies heavily on specific geographic regions. South American supply disruptions immediately threaten global trade balances. Major consuming nations depend on fragile international supply corridors. Disrupted shipping lanes at port hubs highlight strategic infrastructure risks. Western economies face sudden import cost increases during supply bottlenecks. Geopolitical stability hinges on secure agricultural trade networks. Sovereign nations now treat food commodities as critical national infrastructure.
Macroeconomics and Industry Trends
Agricultural supply shocks directly reignite broader food inflation. Central banks monitor rising soft commodity prices with intense scrutiny. High interest rates raise storage costs for capital-intensive inventory. Coffee futures reflect a sharp divergence between Arabica and Robusta supplies. Declining certified stocks create upward pressure on short-term contract prices. Global consumer demand remains remarkably inelastic despite rising retail prices. Consequently, commodity traders brace for sustained market volatility ahead.
Business Models and Management Leadership
Corporate coffee giants face severe profit margin pressure today. Executive leadership must execute aggressive hedging strategies in futures markets. Roasters balance raw material cost surges against consumer price sensitivity. Flexible business models rely on diversified multi-region sourcing contracts. Effective management mitigates supply chain risk through long-term supplier commitments. Corporate cultures prioritize supply resilience over short-term cost savings. Strategic hedging protects profit margins during unexpected supply shocks.
Science, High-Tech, and Innovation
Modern agriculture leverages cutting-edge computer science and high-tech tools. Farmers use satellite imaging to monitor soil moisture and crop health. Artificial intelligence models predict yield impacts from climate anomalies like El Niño. Advanced genetic research develops climate-resilient coffee plant varieties. High-tech sensors track temperature and humidity in international shipping containers. Technology empowers growers to mitigate environmental risks and optimize harvests.
Patent Analysis and AgTech
Intellectual property plays a growing role in global agriculture. AgTech companies aggressively patent drought-resistant coffee plant varieties. Patent portfolios cover automated harvesting machinery and precision irrigation systems. Core patents protect proprietary post-harvest processing and fermentation techniques. These technological breakthroughs safeguard global yield efficiency from extreme weather. Intellectual property dominance creates high barriers to entry in agricultural technology.
Cybersecurity Protocols
Commodity trading relies entirely on digital exchange platforms today. State-sponsored hackers and cybercriminals frequently target global logistics networks. Security teams protect automated port operations and digital supply manifests. IoT sensors in shipping containers require robust encryption against digital tampering. Zero-trust architecture shields financial exchanges from catastrophic cyber disruptions. Strong cybersecurity maintains integrity across physical supply chains and derivative markets.
Pharmaceutical Industry Connections
The pharmaceutical industry maintains a direct operational link to coffee production. Decaffeination facilities isolate massive quantities of pure caffeine during processing. Pharmaceutical firms use purified caffeine in pain relief formulations and stimulants. Medical researchers also extract antioxidant compounds from green coffee beans. These botanical extracts support novel therapeutic treatments and nutraceutical products. Commodity price shifts directly influence raw material costs for pharmaceutical manufacturers.
The Final Verdict
Coffee futures present a compelling dynamic for global macro investors. Structural supply deficits and natural disasters continue pushing prices higher. Advanced technology and strong patents will define future agricultural resilience. Investors must monitor trade logistics, supply inventories, and climate models closely. Coffee remains a volatile yet vital asset in the global financial landscape.
Elon Musk's New market had a nice moveIt's Friday the date is 8/7 26
The video is a little bit on the long side and I wanted to talk about another market as well and that is called coffee but I pushed the wrong button and I don't want to repeat that video so this will be the first part and I will dutifully post my point of view on coffee in the next 30 minutes
Coffee: Waiting for a Confirmed Break Above 340After months of corrective price action, coffee futures may be approaching one of the most important technical moments of the year.
The market has already shown strong buying interest from the recent lows, accompanied by increasing volume and a sharp impulsive recovery.
Now, price is consolidating just beneath a major resistance level.
For me, this is not a buying opportunity yet.
The trade only becomes interesting if buyers can break above **340** and successfully retest that level as new support.
That's where I intend to get involved.
---
## Why 340 Matters
The **340** level is far more than just another horizontal resistance.
It represents a major decision point where several technical factors converge.
Previous market structure, Fibonacci retracement levels, and recent price rejection all point to this area as the key barrier separating consolidation from a potential trend continuation.
If buyers can reclaim this level, market structure improves significantly.
---
## Consolidation After an Impulsive Move
Strong trends often pause before continuing.
Instead of immediately reversing lower, coffee has spent several sessions compressing inside a tight range following a powerful impulsive advance.
This type of price action frequently represents absorption rather than distribution.
If supply continues to be absorbed, the probability of a breakout increases.
The market now appears to be approaching that decision point.
---
## Volume Supports the Thesis
One detail that immediately caught my attention is the increase in trading volume during the recent rally.
Large expansions in volume often indicate stronger participation behind the move.
While volume alone never confirms a breakout, it provides additional confidence that buyers remain active after the recent recovery.
Now the market needs to translate that participation into price.
---
## Confirmation Comes First
Many traders attempt to anticipate breakouts.
I prefer waiting for confirmation.
For this setup, confirmation means:
- A decisive breakout above **340**.
- A successful retest of that level as new support.
- Buyers stepping back in after the pullback.
- Continuation toward the next resistance levels.
If those conditions occur, the probability of trend continuation increases considerably.
---
## Risk vs. Reward
This setup immediately stands out because of its asymmetric profile.
The entry only occurs after confirmation, allowing risk to remain clearly defined below the retest zone.
Meanwhile, the upside extends toward the next Fibonacci objectives, beginning around **375**, followed by the previous swing highs near **394**, with the extended projection reaching approximately **422**.
Rather than trying to buy the exact bottom, I prefer entering after the market proves that buyers have regained control.
---
## What Would Invalidate This Idea?
Every trade requires a clear invalidation.
If price fails to break above **340**, or if the breakout immediately loses acceptance and falls back below resistance, my bullish thesis becomes invalid.
Failed breakouts often lead to sharp reversals.
That's why confirmation is an essential part of my strategy.
---
## Final Thoughts
Markets rarely reward impatience.
The highest-quality opportunities often appear after resistance becomes support.
Coffee is approaching exactly that type of setup.
The recent rally has been impressive, but I'm not interested in buying beneath resistance.
I'll wait for the market to confirm strength first.
If buyers successfully reclaim **340** and defend it during a retest, I believe coffee could begin another impulsive leg higher.
Until then, patience remains part of the trade.
---
*This publication reflects my personal interpretation of the current market structure and should not be considered financial advice. Always conduct your own research before making investment decisions.*
---
### What do you think?
**Will coffee reclaim 340 and resume its uptrend, or will resistance hold once again?**
I'd love to hear your perspective in the comments.
Coffee Coiling Between 306.50 & 325.00 — The Break Decides▪️ COFFEE H4 SNAPSHOT — EXECUTIVE SUMMARY
▪️ Coffee is balancing near 316.60, boxed between a well-defined floor and ceiling with no clear control. The market is rotating sideways as it waits for a catalyst.
▪️ Primary outlook is neutral — 325.00 is the fulcrum. The first clean break of the range sets the tone.
▪️ Key resistance zone: 325.00, defended 13 times. Above that sits 351.50, then 372.00.
▪️ Range floor: 306.50 — a weak level at 12 retests. Lose it and the balance breaks lower.
▪️ Primary downside targets on a break: 285.00, then 263.00, where liquidity pools.
▪️ Major liquidity magnet below: 285.00–263.00 — the zone that would pull price if the floor cracks.
▪️ Bullish scenario: A daily close back above 325.00 flips the tape and targets 351.50, then 372.00.
▪️ KEY LEVELS
▪️ Current Price: 316.60
RESISTANCEs
▪️ 372.00 — ★ 4.5 Weak · 36 retests
▪️ 351.50 — ★★★ 7.8 Strong · 27 retests
▪️ 325.00 — ★ 3.4 Weak · 13 retests
SUPPORTs
▪️ 306.50 — ★ 5.1 Weak · 12 retests
▪️ 285.00 — ★★★ 7.7 Strong · 17 retests
▪️ 263.00 — ★ 4.7 Weak · 5 retests
▪️ ProjectSyndicate Levels Desk — Overview of key S/R zones for Indices, Metals, Futures, NVDA, NQ, ES & GC traders every week. Subscribe to stay up to date with the latest levels.
Awakening Liquid Gold: The Coffee Futures BoomInvestors face a volatile landscape in 2026. ICE Arabica coffee futures exploded higher this month. Prices rallied nearly 50 percent after finding a bottom in June. Supply chain issues and delayed harvests drive this momentum. Heavy rains disrupted fieldwork in Brazil. This weather crisis degrades crop quality and restricts output. Traders monitor these developments closely. We must analyze the catalysts propelling coffee prices across multiple sectors.
Macroeconomics and Economics
Macroeconomic forces heavily influence coffee futures today. The Brazilian Real recently surged against the US dollar. This currency strength discourages Brazilian farmers from exporting their beans. They hold inventory, waiting for better margins. Global demand increases simultaneously. Intercontinental Exchange (ICE) raised margin requirements twice recently. This action drained liquidity from the market. Commodity funds then closed positions rapidly, worsening price volatility. Supply shortages establish a bullish foundation.
Geopolitics and Geostrategy
Trade policies directly shape the global coffee trade. Governments implement new tariffs and export restrictions. Supply chain bottlenecks complicate physical deliveries worldwide. Brazil remains the dominant producer, controlling 37 percent of global output. Vietnam follows as the primary robusta supplier. Geopolitical tensions impact major shipping routes. This disruption forces shipping companies to reroute vessels. Traders must factor these geopolitical risks into their pricing models.
Science and Industry Trends
El Niño creates severe weather anomalies across South America. Heavy rains delay the Brazilian harvest, which currently sits at only 52 percent completion. Agronomists rush to address these climate challenges. Science plays a vital role here. Researchers study the impact of extreme moisture on bean development. Industry trends show a definitive shift toward climate-resilient farming. Farmers adopt advanced cultivation techniques to salvage their yields.
Technology, High-Tech, and Patent Analysis
Technology revolutionizes coffee production and trading. AI algorithms now predict weather patterns and yield fluctuations accurately. High-tech sensors monitor soil moisture and plant health in real time. Innovators file numerous patents for advanced agricultural tech. Patent analysis reveals a spike in drought-resistant seed technologies. Companies also patent novel extraction methods for specialty coffees. This technological arms race gives progressive farms a competitive edge.
Cybersecurity
Digital platforms process millions of commodity trades daily. Cybercriminals target these financial exchanges relentlessly. Cybersecurity protocols must protect sensitive trading data and supply chain logistics. A single breach could manipulate futures pricing or disrupt global distribution. Firms invest heavily in encrypted networks. They deploy zero-trust architectures to secure their commodity trading operations. Constant vigilance prevents catastrophic market manipulation.
Company Culture, Innovation, and Business Models
Coffee companies must foster a culture of ultimate agility. Rigid organizations fail during intense market volatility. Leaders encourage rapid innovation to offset rising bean costs. Businesses adopt dynamic pricing models to maintain profit margins. Some roasters pivot to direct-trade business models. This strategy bypasses intermediaries and secures supply lines. Hedging against volatile futures requires a forward-thinking corporate mindset.
Management and Leadership
Executives face immense pressure from volatile coffee markets. Leaders must execute precise risk management strategies. They utilize complex financial instruments to hedge against future price spikes. Managers optimize supply chains to reduce unnecessary costs. Strong leadership ensures stability during market chaos. Decision-makers must remain proactive rather than reactive. Effective leaders turn these market disruptions into strategic advantages.
The Pharmaceutical Industry Connection
Pharmaceutical companies watch coffee futures closely. Coffee beans contain valuable bioactive compounds and antioxidants. Manufacturers extract high-grade caffeine for medicinal formulations. Scientists study chlorogenic acid for its metabolic benefits. Rising raw material costs squeeze pharmaceutical profit margins. Drug companies must secure their supply of these crucial organic compounds. This cross-industry reliance highlights the broad economic impact of coffee.
Conclusion
Coffee futures represent far more than a morning beverage. They reflect a complex matrix of global forces. Climate change, currency fluctuations, and technology drive this dynamic market. Investors must understand these diverse catalysts. Astute traders will capitalize on these violent price swings. We expect continued volatility as weather patterns remain unpredictable. The liquid gold rush presents unique opportunities for prepared minds.
This is a quick look at two markets and I have very little time This is Tuesday about 7 AM...... Pay attention if you're motivated to see how I handle the setup and the trade location as it relates to pivots and this will get you more precise setups to get in and out of the market. I talked about oil and coffee because these became profitable trading setups.
Price is always moving according to the newest probabilistic setThink about that. Nobody knows for sure what is happening right now. The best we can do is to find patterns, take statistics, and use probabilities in our favor to frame different probabilistic scenarios and build sensible risk-to-reward ratios. But what happens if we take a context from 3 weeks ago, right now, on a 5-minute chart? Certainly that’s not what’s happening right now, the current context is going to escape us and we are going to fail. Only the current, latest, or newest “probabilistic set” carries the information that we want.
Every single time the market makes a new pivot, the probabilistic set varies. For example, if I am a supply/demand zones trader, and the market makes a low going higher, I HAVE TO take notice of that low and look for a demand zone; and if I am a trader that focuses on highs and lows for liquidity, it is the same, because now I have a new low in the market and the context has changed, and that is happening for every single high/low the market creates.
For example, this is, right now, my latest probabilistic set for gold intraday, detected by the system
This is telling me that I must project the whole structure further down because support is not holding.
I’m projecting that it is going to reach this area.
In the whole process, I have to take no decisions at all since I’m working with the outputs of the system.
If prices can’t reach the projected parallel and they break up, I simply keep track of the movements, taking notice of the new low the market created.
Yeah, it looks like Frankenstein, but do we want to have pretty charts or make money?
Now price is way more bullish, maybe I can enter on a pullback at the lows, right?
The point is, markets are always changing the environment. The only way to be on top of the world is to track the current context dynamically. Just wait patiently and at some point they are going to hand you the edge on a silver platter. That’s the edge for retail traders, to simply wait for the time when everything is in our favor while market makers HAVE TO trade to support the liquidity of the markets. We don’t have to trade every single price, but we have to understand what is happening and trade when everything aligns, evolving dynamically.
For example, take what @Path_Of_Hanzo is doing here on Tradingview, the guy/group is considering every single signal in real time, dynamically, even if they are opposite, like in this case.
Or take how I’m following “my” system, The Action and Reaction System. I’m not making up stuff on the fly according to what seems right, but I’m actually taking the calls from the market itself because I coded pure structure.
Next time you sit in front of a chart, ask yourself if you know the current probabilistic scenario, and only then, if you want, look for something else, like more context from the past, more information, or whatever, because this is a general principle: the latest/current probabilistic scenario is always going to carry more weight and offer the best trade, while if we take a call that contradicts that, coming from old data, most likely that approach is going to fail in the long term. The next step is to actually code (with the help of AI) the rules for your method so you don’t even have to move a finger and can simply keep track of the markets until they give you your setup in your hands.
It's important to see how coffee acceleratedThis is the 7th of December I gave a rather long video here because I cleaned up my charts and I also wanted to show where there might be trades in some of these markets but it's not ready for me to take a trade and I want you to see what that looks like.... More importantly I'm more than happy to show you this decisions that didn't work out it's not a big deal to me so I think it's important to make decisions understanding when you need to use caution but you need to make the decision that the tool you're using will help you manage the market even if you don't take the trade at this very moment.
Coffee Futures Coffee C Futures may be one of the few charts capable of waking traders up before the coffee itself does.
From a purely pattern-recognition perspective (and with a healthy dose of market humor), the chart is beginning to exhibit some of the same repeatable behaviors often observed across completely different asset classes. One of the fascinating aspects of financial markets is that human psychology tends to leave similar footprints whether the instrument is a technology stock, a cryptocurrency, a commodity, or—in this case—the beverage many traders rely on to survive Monday mornings.
The higher-timeframe structure remains interesting, but as always, charts rarely reward impatience. Before declaring that coffee is preparing for its next caffeine-fueled adventure, it may be worth waiting for lower-timeframe confirmation and evidence that buyers are ready to refill the momentum cup.
A few observations worth monitoring:
• Alignment between lower and higher timeframe structures
• Return of buyer participation after consolidation phases
• Trend confirmation rather than emotional prediction
• The ever-reliable 200-period moving average finding its way beneath price action
More broadly, this chart serves as another reminder that markets often repeat behaviors even when the underlying assets have little in common. Apparently, fear, greed, optimism, and impatience trade coffee futures just as enthusiastically as they trade stocks and cryptocurrencies.
Of course, this commentary is intended purely for fun, market observation, and educational discussion about recurring chart behaviors across different instruments. It is not investment advice, a trading signal, or a recommendation to buy, sell, brew, roast, grind, or consume any particular quantity of coffee.
COFFEE | Sell again again | Week, June 01-05,2026Hello Traders!
This is the third time I’ve recommended ICEUS:KC1! . The first time I took a loss, and the second time the order didn’t execute. If things don’t go well this time, it might be quite a while before we look at this asset again.
Now we can place a Sell stop order based on this signal candle and wait for the market’s response.
Coffee C Futures Daily: Technical Bounce Targets Strong 300 - 31Coffee C Futures ( ICEUS:KC1! - ICEUS) has printed a clear local bottom formation on the Daily Chart, opening the gates for a tactical counter-trend recovery before encountering major macro overhead supply.
The soft commodity market relies heavily on structural technical baselines, and current price action is respecting historical key areas with great precision.
### Key Technical Factors:
* **The Demand Floor (263.25):** The market successfully found buyers and absorbed selling pressure exactly at the horizontal support line of **263.25**. This test completed a short-term exhaustion phase for the bears.
* **The Multi-Layered Resistance Block (300.00 - 318.00):** As indicated by the blue arrow, the short-term path of least resistance points upward to a key intersection:
* **The Macro Descending Trendline (LTB):** The long-term green resistance line crosses right around the psychological **300.00** region.
* **The 200 Exponential Moving Average (EMA 200):** The purple dynamic baseline acts as structural value overhead, currently trending near **318.32**.
### Strategic Scenario (The Rebound and Rejection Sequence):
The dynamic markers on the chart display a very structured, high-probability sequence:
1. **The Tactical Bounce (Blue Arrow):** Short-term momentum is carrying price action up from the 263.25 floor to hunt liquidity near the trendline compression.
2. **The Macro Rejection (Red Arrow):** Once the index tests the 300.00 to 318.00 cluster, institutional sellers are highly expected to defend the structural bears. A technical failure at this confluence zone will likely trigger a new expansion leg down to retest the local lows and continue the broader bearish regime.
### Execution Blueprint:
Chasing long positions late into the 300.00 zone presents a poor risk-to-reward ratio. The institutional trade consists of observing lower timeframe structures (such as H4 or H1) inside the 300.00 - 318.00 block, waiting for a structural shift (CHoCH) or clear seller absorption to trigger short entries aligned with the dominant trend.
---
📊 **ProData Chart** | By Rogerio Zaglia
*12+ years of daily global market technical analysis.*
⚠️ **Disclaimer:** This analysis is for educational and informational purposes only. It does not constitute financial advice or an investment recommendation. Past performance is not indicative of future results.
COFFEE | Sell again | Week, May 25-29,2026After hitting the stop-loss on the previous trade, ICEUS:KC1! pulled back and entered a consolidation phase between the short-term EMA and the trend line, while retesting the resistance zone on the daily timeframe
Currently, a signal candle has formed, providing a basis for placing an order. Then place a Sell Stop and wait for the Market's response.
Coffee alert: Strategic pullback to $285—Bulls eye the $320The current coffee price rise is attributable to the tightening of the global balance sheet, which is being driven by many reasons. The Hormuz Logistics Premium, owing to the need for ships to take a longer route via the Cape of Good Hope, delays shipments of Arabicas coming from East Africa and Vietnam by weeks, resulting in insurance premiums and shortage premiums for physical coffee held in North American and European inventories. Among others, some issues that are also affecting the market are the Brazilian Weather Volatility and Robusta Shortage from Vietnam caused by hot weather.
With the RSI now at 43.94, Coffee is no longer in an overbought or oversold state. It has moved into a balanced or neutral zone, which is a classic consolidation area often preceding the establishment of the next dominant trend. This drop in the RSI confirms a mean reversion in price. I anticipate the 20 EMA will now serve as a key structural support level, acting as a magnet for the price action. Traders should watch the Volume Profile closely; look for volume to contract during this neutral RSI period. The ideal trigger for a new long position will be a subsequent sharp increase in volume, accompanied by a rising RSI.
Trade recommendation :
Direction : Long
Entry Zone : 278.00 – 285.00 (Building positions while the RSI is below 50).
Primary Target : 305.00
Secondary Target : 320.00
Stop Loss : 265.00
Technical scenarios
Bullish
Trigger & Indicators: RSI sustains above 70 + Daily close above 290.00.
Potential Outcome: A rapid short-squeeze targets the 320.00 handle.
Retest
Trigger & Indicators: Price rejects 290.00 + RSI curls down.
Potential Outcome: A tactical pullback to the 275.00 support zone.
Consolidation
Trigger & Indicators: Price grinds sideways between 280.00 and 295.00.
Potential Outcome: Setting the stage for a late-May breakout to 320.00.
COFFEE | Will the downward trend continue? | Week May 04-08,2026Hello Traders!
ICEUS:KC1! is in a downtrend on the H4 and D1 timeframes based on my EMA's system.
Price action is consolidating between the EMA and the support line
Wait a bearish breakout candle accompanied by high volume, then place a Sell Stop order
There are two price target zones at 23x and 18x.
Coffee Futures — Bearish BreakdownCoffee seems to be breaking lower again.
Price action remains weak, the trend looks bearish, and the bearish pennant structure is still in play.
Given this setup, I recently recommended a coffee producer client to buy 270 strike puts as downside protection against a potential further decline.
Key levels to watch:
Support: 277 / 245
Bearish bias while price stays below: 300
Protection idea: Buy 270 puts
Invalidation: A strong close back above the pennant / 300 area
This is not about guessing the bottom.
It is about protecting margins before the market decides to get ugly.
#Coffee #Commodities #Futures #Options #Hedging #RiskManagement #TradingView #TechnicalAnalysis
Checking multiple markets4 20 26 I've had some claims with my software and it looks like I've solved those problems with help from my friends so you will get a sense of how I use the tools for the markets that I follow on a regular basis. The last market that I looked at today was coffee and I discuss how this could have been a long trade for me because failure of the market moving to a lower level but we have a 2 bar reversal which I explained and that tells you where you can enter a long trade with a small stop.
Technical analysis April 13: Arabica broke out close to the 301 The market is in a strong growth phase after establishing a solid bottom and breaking the previous downward structure. The price range of 301.00 is currently a key psychological threshold. Trading tends to prioritize holding Buy positions and trigger chasing when the price completely escapes the current resistance zone.
1. Review previous session recommendations
The scenario of Buying at the adjustment period of 288.00 - 290.00 in the April 9 session brought optimal results when the price rebounded strongly right after the testing period. In the April 10 session, the price decisively broke through 297.00 and closed at 300.10, closely following the main growth scenario. Existing Buy positions are in a state of great profit; The Breakout Buy scenario at 301.00 is waiting to be activated as soon as the next session opens.
2. Overview of trends & price structure
Arabica has officially ended the medium-term price decline phase and switched to the growth phase with expansion acceleration. The current market structure is completely controlled by the Bulls after forming a double bottom reversal pattern and breaking out of the long-term downtrend line. The fact that prices continuously set higher closing levels shows that cash flow is focusing strongly on this commodity due to supply concerns. The chart's logic reflects the shift from the accumulation phase to the sustainable price increase phase, where short-term corrections are quickly eliminated by active demand, creating a premise for the price to soon approach the target resistance area of 325.00.
2. Technical prices
Resistance: 301.25 – 325.00 – 361.15
Support: 291.80 – 285.00
3. Detailed technical analysis
The candle on April 10 was a long bullish candle, closing close to the session high at 300.10. Data correlation shows: Price increased + Green volume increased (22.92K) + OI decreased (38.44K) → Short Covering. This breakthrough is mainly due to the fact that the Sellers were forced to close a series of stop-loss positions when the price surpassed the above blocking thresholds, creating an extremely strong resonant thrust. The VPA signal confirms that the upward momentum is highly reliable when the efforts of the Buyers result in a decisive breakthrough in price.
Hedge funds are aggressively liquidating the remaining Short positions and starting to shift to an overwhelming Buy position. Market sentiment turned to excitement as logistics risks in Brazil show no signs of cooling down. Traders are stepping up defensive buying positions to protect capital prices, causing supply pressure on the electricity board to be completely absorbed as soon as prices show signs of a slight dip.
The top-bottom sequence is forming a steep ascending structure. According to the arrow diagram on the chart, the price has completed the regression wave and is in an upward wave pushing towards the 325.00 mark. The current price position is just below the psychological resistance of 301.00; Exceeding this mark will confirm the continuation of the medium-term uptrend wave. This structure will only be disabled if the price turns down sharply and closes decisively below 285.00.
4. Next session's trading scenario
Action: Continue to hold and open more Buy positions (TP: 325.00 SL: 291.00); Background: Confirmation of continued upward momentum from strong Short Covering effect.
Scenario 2 (25%): Price faces profit-taking pressure at 301.25 and there is a technical correction to 294.00.
Action: Wait to buy (Buy Limit) at area 293.00 – 295.00 (Tp: 301.00; SL: 284.00); Basis: Retesting demand at the short-term support zone before continuing the upward wave.
5. Recommendations by subject
Manufacturer/importer (Buyer): Make a drastic Long Hedge as soon as the price exceeds 301.25. This is the key price area to protect profit margins before the market enters the acceleration phase to 325.00.
Trade/export (Sellers): Absolutely do not establish short positions to block the trend. Patiently wait for the price to approach the target resistance of 325.00 and for clear reversal signals to appear before considering re-establishing short Hedge positions.
Coffee long trade plan Long coffee short term to the daily 200EMA and high volume node as the defensive take profit #1 with a longer term target of $373 if we get the breakout
The structure flipped bullish, on no attention, at the same time it recovered the daily pivot
The daily RSI printed bullish divergence and is currently printing hidden bearish divergence with its fast move towards overbought.
Safe trading