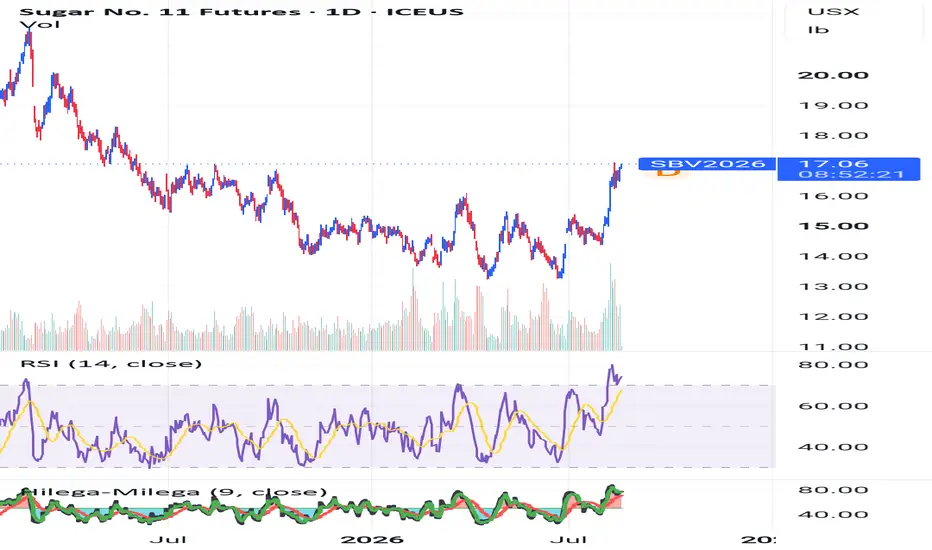
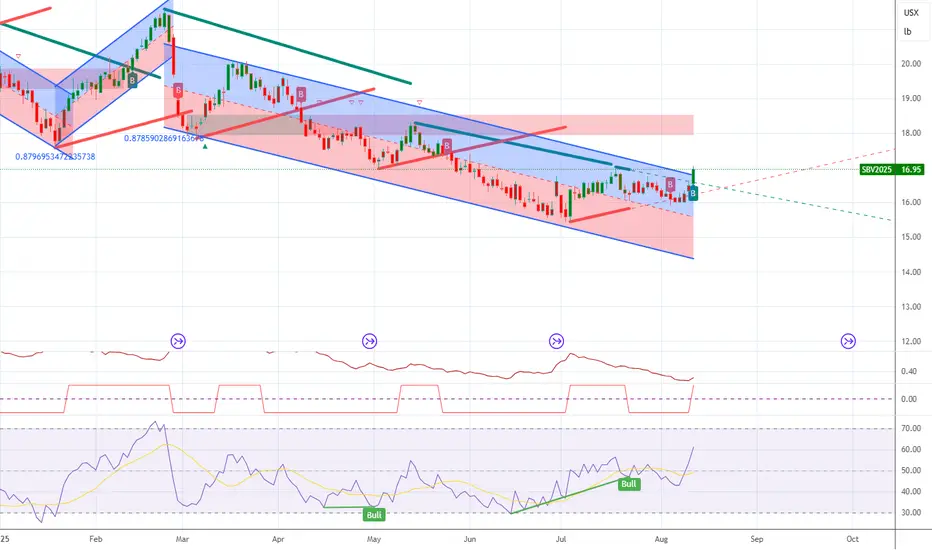
#SUGAR 2027–2029: The Sweet Life Has Ended! Part IIGreetings, gentlemen ⚫️ | comrades 🔴 | colleagues 🔵
Welcome to all newcomers and long-time residents of my virtual den, where we dissect global financial markets without slobbery optimism, rose-colored glasses, or any of the other BS daily spoon-fed to us by sold-out media and mainstream influencers. Outside the window, it is the autumn of 2026. While the lulled crowd waits for an eternal party in the stock market with endless growth from AI giants, the gears of the macroeconomic mill continue
In-depth trading ideas
Sugar: 20.30 S/R reclaimed, longSugar has turned hard. From the 17.10 September low it ran to 21.24 in two weeks, a 24% move and a new yearly high, and on the way it broke through 20.30, a major level in my long term sugar S/R model (clustered swing pivots going back to 1969). That level had been resistance; the question was whether it would flip.
It did. The pullback from 21.24 tested the area, dipped to 20.00 intraday and closed back above 20.30 every day. Yesterday’s bar pushed back to 21.11, so the retest is done and the
Sugar: short below the 17.10 double bottomSugar ran from the 14.37 July low to 18.88 on September 10, about 31% in six weeks. Since that high the daily swing chart has turned down. Price fell back into the August congestion range, made a lower high near 17.90 on September 25, and is trading at 17.37 today.
The level that matters is 17.10. It has held twice, at the August 21 low and the September 22 low, and both boxes on the chart share that floor. A break below it completes a two month distribution top above the early August breakout.
Ascending Trendline Breakdown & Buyer Trap (Short Setup)SUGAR RAW (OCT 2026) 1H:
1. Market Context
On the 1H chart, Sugar Raw (Oct 2026) has been advancing along a major green ascending trendline from the 16.300 base up to the 18.700 peak. After forming a lower-high rejection peak near 18.438, price is now pressing down directly against the key trendline support floor at 17.930.
2. Sentiment & House Trap Analysis
• Where Traders Place Orders: Seeing the green ascending trendline support hold repeatedly over several weeks, retail traders are opening
UShort
The second most crowded speculative reading in twenty yearsSugar has just produced one of the most extreme positioning readings in its recorded history, and the sequence that got it there is more interesting than the reading itself.
Managed money net position, from the CFTC weekly file:
28 July: net short 112,413
4 August: net short 77,814
11 August: net long 58,990
18 August: net long 151,349
25 August: net long 207,082
That is a swing of 319,495 contracts in four weekly reports. Underneath it, longs went from 181,809 to 309,452 and shorts fell from
Sugar Rush to $0.1872 - Not good for consumers
The Iran conflict has pushed oil toward multi-year highs, which directly impacts sugar because Brazil (largest producer) diverts cane into ethanol instead of sugar when oil rises.
And this is going to cause a huge sugar run, potentially to $0.1872.
Remember this, less sugar production means supply squeeze = higher prices (Simple economics)
🚢 Shipping Disruptions (Strait of Hormuz)
War risk in the Middle East is disrupting key shipping routes, reducing global sugar trade flows and tighten
SUGAR NO. 11 SETS MEDIUM-TERM BOTTOM – EXPECTING NEW GROWTH WAVEKEY TAKEAWAYS:
Price structure confirms a bullish divergence at the 13.50 bottom, completing the Falling Wedge pattern.
Strong recovery momentum has pushed prices out of the accumulation zone below 15.00.
Wave projection forecasts a long-term bullish cycle targeting old resistance at 20.00 and potentially 23.00.
Date: March 26, 2026 | Timeframe: Daily (1D) | Contract Code: SB1! (Sugar No. 11)
1. Trend and Price Structure Overview
Following a prolonged decline since late 2024, Sugar prices f
Sugar #11 seems to have fallen into a descending wedge patternAfter falling through support at around 15.3 cents (assumed C/S Brazil ethanol parity?), spot #11 seems have fallen into a descending wedge pattern, whiplashed by developments in the Straits of Hormuz but so far the descending wedge pattern remains unbroken.
Sugar SB Futures: Extreme COT Divergence – Short Squeeze Ahead?
ICEUS:SB1!
🔎 Market Situation
The latest COT report shows one of the most extreme positioning imbalances in 18 years for Sugar #11:
• Commercials: Net Long 128,130 contracts → 2nd highest since 2007 (only surpassed in Sep/Oct 2020 with ~160k).
• Non-Commercials (Funds): Net Short –125,628 contracts, almost a mirror image.
• COT Index: above 80% since July, peaking at 100% → continuous accumulation by Commercials.
• Open Interest: very high → massive market participation.
• On-Balance Vo
Bears Crush Sugar Hope at 15.85 - Bulls Await Revenge🎯 SB1!: Bears Crush Sugar Hope at 15.85 - Bulls Await Revenge
💡 To see my confluences and/or linework, step 1: grab chart 📊, step 2: unhide Group 1 in object tree 🗂️, step 3: hide and unhide specific confluences ✨. Also double-click the screen which would show the RSI, MFI, CVD and OBV indicators alongside the divergence markings! 📈
The Market Participant Battle:
Bulls attempted a comeback from the 15.17 low (point 3), reaching 15.95 resistance (point 4), but bears have violently rejected
Sugar Futures Long SetupThis is my play — based on seasonality, COT index, and supply/demand.
Seasonality into Q4 historically supports sugar strength.
COT Index: commercials/hedgers are now heavily long, which typically signals a turning point — these players are often positioned opposite speculators at major inflection zones.
Managed money has been trimming shorts, opening the door for a short-cover rally.
Price is pressing into a long-term base zone, with RSI washed out and downside momentum stalling.
Trade Pl
Short Sugar📌 When is Sugar in High Demand & How Does It Cycle?
Sugar, extracted from sugarcane and sugar beet, is one of the world’s oldest and most consumed commodities. Beyond sweetening food and beverages, sugar has also become a critical biofuel input through ethanol production, especially in Brazil. Because of its dual role in food and energy markets, sugar futures are actively traded on global exchanges like ICE, CME, and NYMEX, offering traders volatility and diversification.
Historically, sugar h