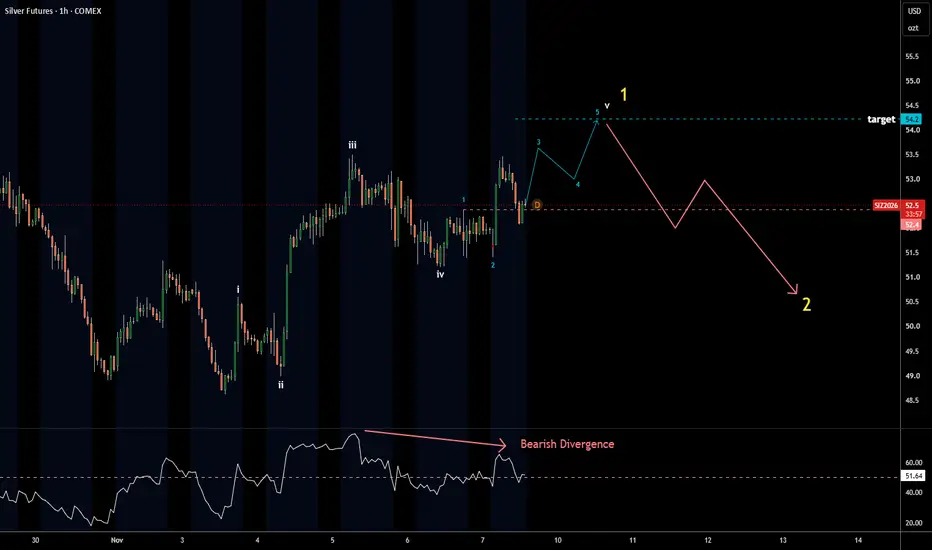
Silver Hourly Chart: 1st Impulse Breakdown it might be the first impulse up (yellow large)
it has 3 waves done
wave 4 could be over as well as the price is testing the peak of wave b
and might trigger the 5th wave bullish trigger
target for wave 5 is $54.2
after that, the corrective wave 2 should unfold down to 38.2-61.8% Fibonacci retrac
Silver Micro Futures
Sorry, this is only available to registered users
MCX provides data to our registered users only, so to get it you'll need to sign up for a TradingView account.
Peers for comparison
Silver Hourly Chart: 1st Impulse Almost Doneit an update of earlier chart
price follows that path
final 5th wave is in progress
we have waves 1-2 of
and waves 1-2-3-4 of 3 of
wave 5 of 3 of just kicked off
wave 4 of should keep above the top of wave 1 of at $52.4
RSI shows Bearish Divergence and its healthy as it confirms posi
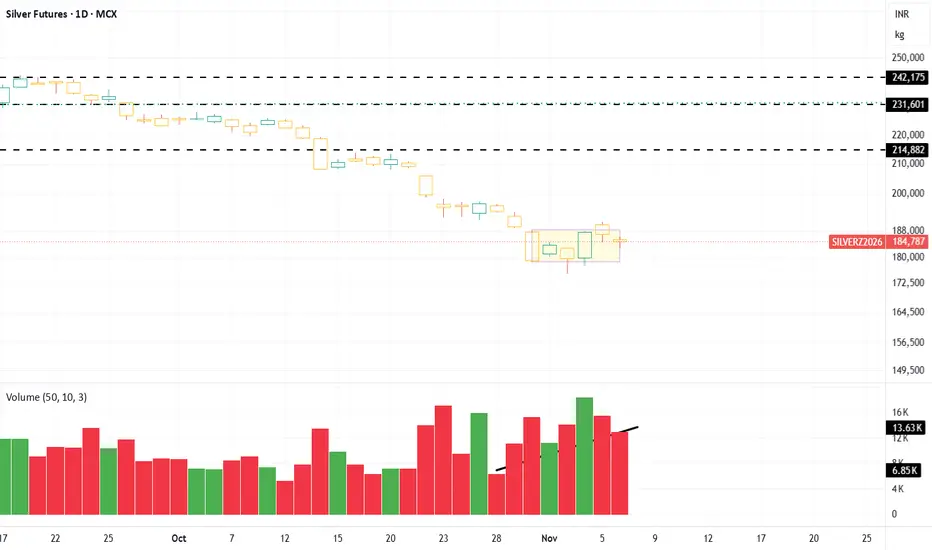
Chart Study | SILVER FUTURES | Daily Chart | MCX | 2 November 26The chart shows a SELL signal followed by a sustained downward price move. Silver has moved below both T1 and T2 reference levels and is now trading near 181,711, with T3 at 173,707 remaining as the next reference level.
Chart reference levels:
Entry reference: As indicated by the SELL label
Stop
SILVER IS READY FOR ITS NEXT BIG MOVE!📊 SILVER – TECHNICAL VIEW | INTRADAY & SWING
Silver is currently showing signs of short-term recovery after taking support near the lower boundary of its descending channel. The recent bounce indicates improving buying momentum; however, the broader trend still requires breakout confirmation.
🔹 Ke
Episode 14 — The Leading Diagonal# 🎬 The Chronicles of Mr. Nobody
## Season I — The History of the Elliott Wave Principle
### Episode 14 — The Leading Diagonal
*The First Sign of a New Move?*
⏱️ Reading Time: Approximately 3 minutes
---
# When a New Trend Doesn't Begin Like a Typical Impulse
Imagine a market that has been de
Silver broke its July low. The idea: the break becomes the lowSilver closed Friday at 53.949, under its July low of 55.00. On my rules that ends the cycle that began in July. My base case is a lower low inside the window for silver's next intermediate low, Oct 30 to Feb 19 (typical: around New Year).
The other case is this week's idea, and I carry it on pape
See all ideas
A representation of what an asset is worth today and what the market thinks it will be worth in the future.
Sorry, this is only available to registered users
MCX provides data to our registered users only, so to get it you'll need to sign up for a TradingView account.
Frequently asked questions
One way to gain exposure to SILVERMICM2027 is through a broker that offers futures. Before trading, make sure you understand how the product works and the risks involved.
You can trade SILVERMICM2027 directly from TradingView:
– Choose a broker: Explore our supported trading partners and pick one that fits your needs
– Compare options: View available brokers side by side to evaluate fees and features
– Connect your account: Open Supercharts, click "Trade", select your broker, and log in
– Start trading: Place orders directly from the chart
Tip: If you're new to trading, try paper trading first — it lets you practice strategies in real market conditions without risking funds.
You can trade SILVERMICM2027 directly from TradingView:
– Choose a broker: Explore our supported trading partners and pick one that fits your needs
– Compare options: View available brokers side by side to evaluate fees and features
– Connect your account: Open Supercharts, click "Trade", select your broker, and log in
– Start trading: Place orders directly from the chart
Tip: If you're new to trading, try paper trading first — it lets you practice strategies in real market conditions without risking funds.
The nearest expiration date for SILVERMICM2027 is Jun 30, 2027.
Futures contracts expire on predetermined dates. As expiration approaches, many traders roll positions into the next contract to maintain exposure to the market.
Key metrics to watch near expiration:
• Volume and liquidity: Trading activity often shifts to the next contract month
• Open interest: Falling open interest may signal positions being closed or rolled forward
• Forward curve: Differences between contract prices can help identify market structure, including contango and backwardation
Explore the SILVERMICM2027 chart to monitor active contracts and contract-month activity.
Futures contracts expire on predetermined dates. As expiration approaches, many traders roll positions into the next contract to maintain exposure to the market.
Key metrics to watch near expiration:
• Volume and liquidity: Trading activity often shifts to the next contract month
• Open interest: Falling open interest may signal positions being closed or rolled forward
• Forward curve: Differences between contract prices can help identify market structure, including contango and backwardation
Explore the SILVERMICM2027 chart to monitor active contracts and contract-month activity.
Open interest is the total number of active futures contracts that have not been closed or expired. For SILVERMICM2027, the current open interest is 3.51 K.
Traders use open interest to assess trend strength and market participation:
– Rising price + rising open interest: New money is entering the market, trend may be strengthening
– Rising price + falling open interest: Positions are being closed, trend may weaken
– Falling price + rising open interest: Increasing short positions, bearish pressure may build
– Falling price + falling open interest: Positions are closing, trend may be losing momentum
Open interest is most effective when combined with volume and price action — track both on the SILVERMICM2027 chart for deeper insight.
Traders use open interest to assess trend strength and market participation:
– Rising price + rising open interest: New money is entering the market, trend may be strengthening
– Rising price + falling open interest: Positions are being closed, trend may weaken
– Falling price + rising open interest: Increasing short positions, bearish pressure may build
– Falling price + falling open interest: Positions are closing, trend may be losing momentum
Open interest is most effective when combined with volume and price action — track both on the SILVERMICM2027 chart for deeper insight.