MARKET DALAM KENAIKANLast week, the market broke above the bearish resistance, confirming a shift in market structure and starting a bullish move. As a result, the market moved higher instead of continuing the bearish trend as previously expected.
At the moment, FCPO remains in a bullish bias, with 4,691 acting as the support level and 4,786 as the resistance level. If price manages to break above the current resistance, it could form a new Break of Structure (BOS) and confirm the continuation of the uptrend.
Possible Scenarios for Next Week
1. Pullback Before Continuing Higher (Preferred Scenario)
The market may retrace into the discount zone before resuming its bullish movement. If this happens, the pullback area could provide a potential entry opportunity for traders who wait for confirmation.
2. Bearish Reversal
The market may break below the 4,691 support level, which could signal a potential shift in market structure and increase the possibility of a bearish trend.
For now, let's wait and see how the market reacts next week. Stay disciplined, follow your trading plan, and always practice proper risk management.
Disclaimer
This trading idea reflects my personal market analysis and opinion and is shared for educational and discussion purposes only. It does not constitute financial advice or a recommendation to buy, sell, or hold any financial instrument, including FCPO futures contracts. Please do your own research (DYOR) and make your own trading decisions based on your trading plan and risk tolerance.
In-depth trading ideas
Bias Bearish Masih KekalThis week, the market moved into the previously marked pullback zone before consolidating for a while and eventually continuing its bearish move, aligning with the previous outlook.
At the moment, FCPO is still trading within a bearish market structure . Price is currently attempting to break below the 4,560 support level to establish a new Break of Structure (BOS) and confirm further downside momentum.
Looking ahead to next week, I see three possible scenarios :
1. Preferred Scenario
The market performs a pullback into a discount zone before continuing its move lower and printing a new BOS. If this scenario develops, traders may monitor the pullback for potential entry opportunities based on their own confirmation and trading plan.
2. Immediate Continuation
The market continues its bearish momentum without a meaningful pullback and breaks below the current structure to form a new BOS.
3. Alternative Scenario
The least preferred scenario is for the market to consolidate briefly before pushing higher, potentially indicating that a bullish trend reversal is beginning.
For now, we'll let the market reveal its next move. Stay patient, follow your trading plan, and always manage your risk.
---
Disclaimer
This trading idea reflects my personal market analysis and opinion and is shared for educational and discussion purposes only. It does not constitute financial advice or a recommendation to buy, sell, or hold any financial instrument, including FCPO futures contracts. Please conduct your own research (DYOR) and make your own trading decisions based on your risk tolerance and trading plan.
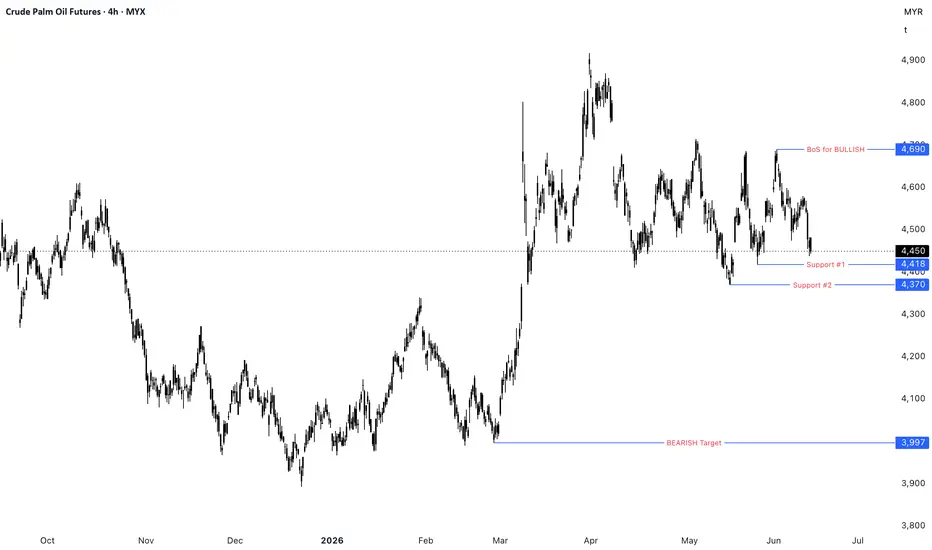
FCPO: Bearish bias.Price is still within range between 4715 and 4370.
4H structure shown that overall price is moving lower.
Next week the target is for price to move lower towards 4520, 4438 and 4370.
If price can close below 4370 (maybe not next week) then the overall target would be the imbalances within the 4100 area.
If price defended the 4370 then we are going back into the range.
Happy trading 💰!
FCPO: Long or Short?MYX:FCPO1! Price stuck in range. If you like trading ranges then this is your market.
So where is next?
If price can break 4689 and close above it then we are breaking higher.
If price instead move lower and break Support #2 then it will be a long way down. Perhaps towards below 4000.
Since price failed to break any structure to go long last week, 4575 seems to be the resistance for now.
Happy trading 💰!
FCPO: Bullish?MYX:FCPO1! stuck in range between 4370 to 4687. If you plot the area you can probably see an ascending triangle developing. Top of the triangle is a horizontal line connecting two swing high at 4687. If price break and close higher then price would probably going bullish.
Right now price is more or less within the lower range of the triangle. If price close above 4533, I'm expecting it to bounce higher and if it can break 4595 then the eventual target for this long position is 4687.
Happy trading. 💰🚀
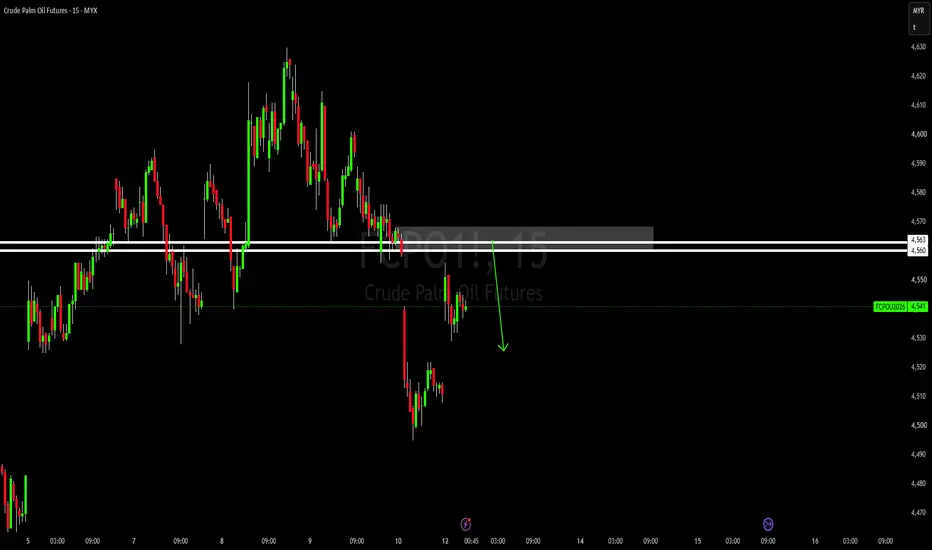
(FCPO 15m) 🧠 Trade Ideas (Based on Structure)
🔴 Bearish Scenario (Higher Probability)
Rejection around:
4,540 – 4,560 area
Target:
First: 4,470 zone
Then: 4,440
Break → continuation to 4,340 zone
✅ Confluence:
Downtrend
Lower highs forming
Supply above
🟢 Bullish Scenario (Invalidation)
Bullish ONLY if:
Strong breakout above 4,560
Followed by hold/retest
Targets:
4,584
4,620
👉 Without breakout, bullish trades are risky (counter-trend).
⚠️ Key Signals to Watch
Rejection candles near 4,550 → bearish confirmation
Break below 4,440 with volume → continuation
Strong bullish engulfing above 4,560 → shift in structure
✅ Bottom Line
Market is still bearish overall
Current move looks like a pullback before another leg down
Your marked zones are valid and well-placed
The likely path:
👉 Sideways → rejection → move into lower demand (4,34xx)
fcpoFCPO Technical Analysis: Bearish Quasimodo AlignmentExecution: SELLRationale: The FCPO chart has formed a structural Quasimodo pattern (Over-and-Under structure). Price successfully created a Higher High followed by a Lower Low, breaking the minor market structure. Selling on the return to the Left Shoulder level for a high-probability risk-to-reward setup.
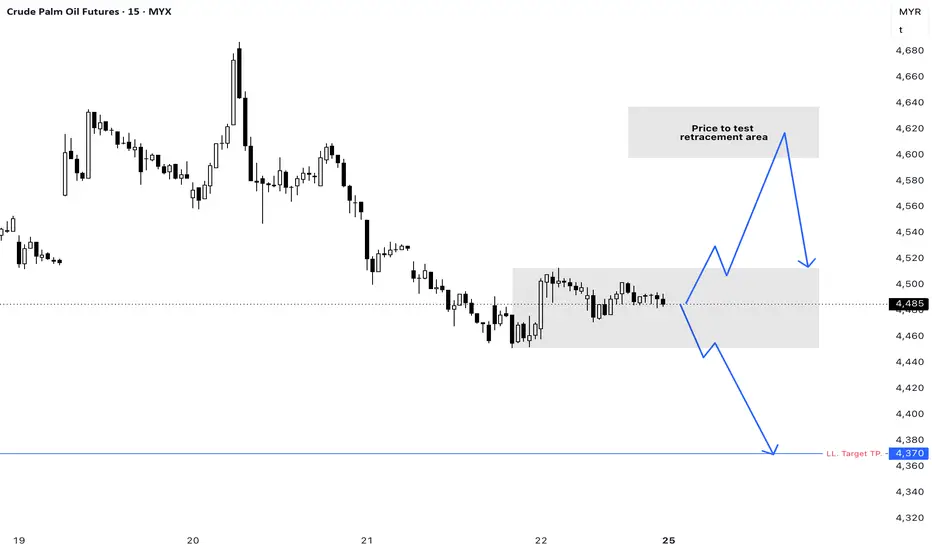
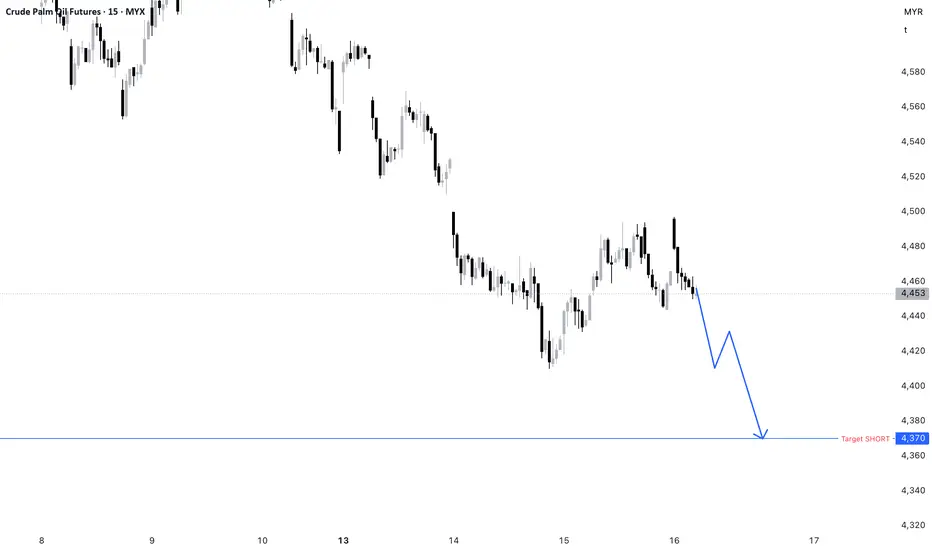
FCPO: Looking for SHORT.MYX:FCPO1! Price is still trapped within the range between 4687 and 4370. Overall bias still favors the bearish side.
There are three parameters to consider:
Parameter 1:
If price breaks 4518 and closes below it, bearish continuation is likely, initially toward 4445, then potentially toward 4370.
Parameter 2:
If price breaks 4575 and continues higher toward the 4600 area, the overall outlook remains bearish. Therefore, I will still be looking for short opportunities.
Parameter 3:
If price breaks 4575, continues higher, breaks the 4600 area, and closes higher, the bearish probability becomes lower. A further break above 4687 would be significant because 4687 is also a 4H swing high. A break above this level may signal that the bias is starting to shift bullish. In that case, it is better to stand aside and observe the next price action.
Happy trading 💰🚀.
FCPO: Bearish continuation...So FCPO had successfully making a retracement higher. This open up an opportunity to look for a new SHORT position. A close below 4510 would open up a move lower to 4370. However if price persisting higher and break above 4635 then probably stand aside because it would mean that bearish is weakening and probability of bullish increasing. So bearish view for now unless proven otherwise.
Happy trading ✌🏽💰🚀!
FCPO: Bearish update...Price retraced to the expected area. It then turns lower after and broke the previous higher high. Further than that it also continued lower and broke the support level. Right now expecting price to continue lower with first target is 4485 and eventually also targetiing the lower of the 4H support at 4410.
Happy trading ✌🏽💰!
FCPO: BEARISH in the making?Price still within 1W range of high at 5200 and low at 3640. 1D however showing signs that a bullish trend might be ending. However there is no confirmation yet on 4H. Next week expecting price to go higher to around 4700 area before giving any indication that bullish is ending.
Happy trading.
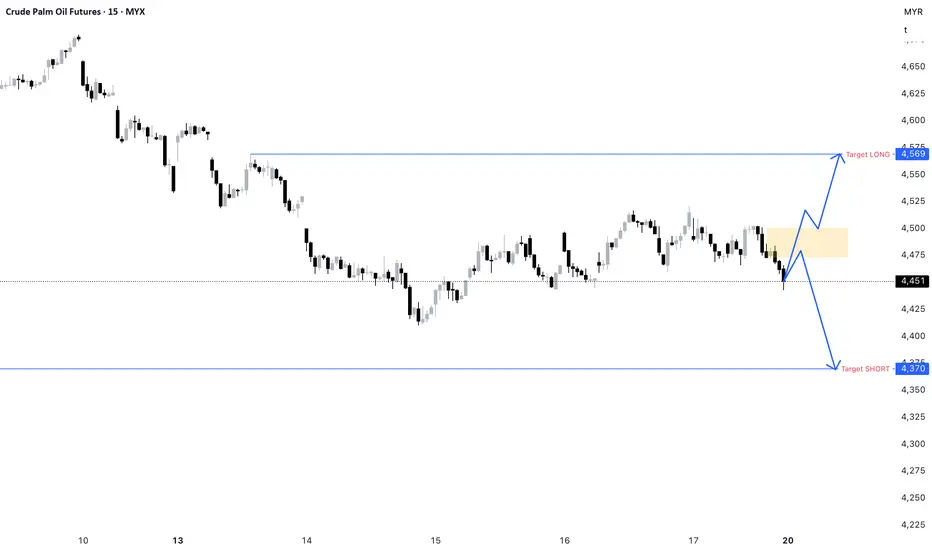
FCPO: Long or Short?Price is in range. It didn't breakthrough lower as expected last week. Instead it continues to be in range. For next week:
Option 1: if price breakthrough 4500 and stay above it then there is likely we will see a bullish movement.
Option 2: If price retraced towards 4475 and defend the level then we might see price to move lower.
Based on previous price action, Option 2 is preferred.
Happy trading. MYX:FCPO1!
16/4/26 Can Bulls Create A Pullback? Strong or Weak?
The market formed a second leg sideways to down, trading below the 20-day EMA and testing near the 4430 level.
In our last report, we said traders would watch if bears could create follow-through selling below the 20-day EMA, or if the market would stall around the 20-day EMA or around the 4450-4500 area instead.
Bulls view the current move as a deep pullback and hope to get a retest of the April 1 high, even if it makes a lower high; forming the right shoulder of a head and shoulders pattern.
They want the market to reverse back above the 20-day EMA.
If the market trades lower, they hope the 4000 or the 4350 prior breakout point will act as support.
Bears created a tight bear channel down from a higher high major trend reversal.
The move down is strong enough for traders to expect a second leg sideways to down after a pullback.
If the market trades higher, bears want the 20-day EMA to act as resistance.
Fundamentals:
• Production: Production for April up +26.77% in the first 10 days for SPPOMA
• Refineries: So far, buying according to spot futures level. Appetite looks ok.
• Exports: Export in April first 15 days down -34.18% - Per ITS
The market formed a tight bear channel trading below the 20-day EMA, indicating persistent selling.
For now, traders will watch if bears can continue create follow-through to test the 4350 area.
Or will the market form a pullback to the 20-day EMA in the days ahead?
If a pullback forms, traders will watch the strength of the move. If it is strong with consecutive strong bull bars, traders will expect a higher retest of the April 1 high. If it is weak and lacking in follow-through buying, traders will expect a lower price moving forward.
Andrew
9/4/26 Bears Need FT Selling to Show Control
Wednesday's candlestick (April 8) was a big bear bar testing the 20-day EMA.
In our last report, we said traders would watch if bulls could create a strong breakout above the 2025 high, or if the market would stall around these levels, followed by a pullback to the 20-day EMA this week.
Bulls see the current move as a deep pullback and want the third leg sideways to up with the first two legs being March 9 and April 1.
At the least, they want a retest of the April 1 high, even if it makes a lower high.
They want the 20-day EMA to act as support.
If the market trades lower, they hope the area around 4450-4500 would act as support.
Bears view the recent move as a retest the prior high (March 9), and want a reversal from a higher high major trend reversal.
Bears need to create consecutive bear bars closing near their lows trading far below the 20-day EMA to show they are back in control.
Fundamentals:
• Production: Production for Apri up +15.63%
• Refineries: Physical spot has more or less caught up to futures spot, no longer trading at a huge discount.
• Exports: Export in April first 5 days down -51.49% - Per ITS
The market formed a second leg sideways to up to retest the prior high, forming a higher high followed by a deep pullback yesterday following the ceasefire in the Middle East conflict.
For now, traders will watch if bears can create follow-through selling below the 20-day EMA.
Or will the market stall around the 20-day EMA or around the 4450-4500 area instead.
Andrew
6/4/26 Market Trading Sideways to Up, No Significant Bear Bars
The market recently retested the March 9 high and the 2025 high. The market is currently trading sideways around this area in the last few session.
Bulls want a strong breakout above these levels followed by a measured move to around 5350 based on the height of the latest leg up to April 1.
At the least, they want the third leg sideways to up with the first two legs being March 9 and April 1.
If the market trades lower, they want the 20-day EMA to act as support.
Bulls need sustained follow-through buying to increase the odds of a measured move up.
Bears view the current move as a retest the prior high (March 9), and hope it will stall around the 2025 high area.
They want a reversal from a higher high major trend reversal.
If the market trades higher, they want the move to be brief followed by a failed breakout above the 2025 high.
Bears need to create consecutive bear bars closing near their lows to show they are back in control.
Fundamentals:
• Production: Production for March - up 2.35% per MPOA. April's production should be higher.
• Refineries: Physical spot has more or less caught up to futures spot, no longer trading at a huge discount.
• Exports: Export in March was strong. April TBD
The market formed a second leg sideways to up to retest the prior high, forming a higher high.
So far, there is no ceasefire or permanent solution to the Middle East conflict. Any further escalation or de-escalation will have a significant impact on commodities such as crude oil.
For now, traders will see if bulls can create a strong breakout above the 2025 high.
Or will the market stall around these levels, followed by a pullback to the 20-day EMA this week.
Andrew
Elliott Wave Analysis: FCPO Price MovementFCPO has completed wave (2) of wave (V).
Currently, it appears to be completing wave (v) of wave 1 of wave (3).
For FCPO to retrace to wave 2 of wave (III) uptrend, it must complete wave 1 first which is possibly in progress to wave (v).
Wave 2 may retrace to Fibonacci of wave 2 which is below 50% of wave 1. Wave 2 may complete with zigzag pattern.
Wave (3) may complete with 5 minor waves.
This analysis is intended solely for Elliott Wave learning purposes and is not a recommendation to buy or sell. Please conduct your own technical analysis.