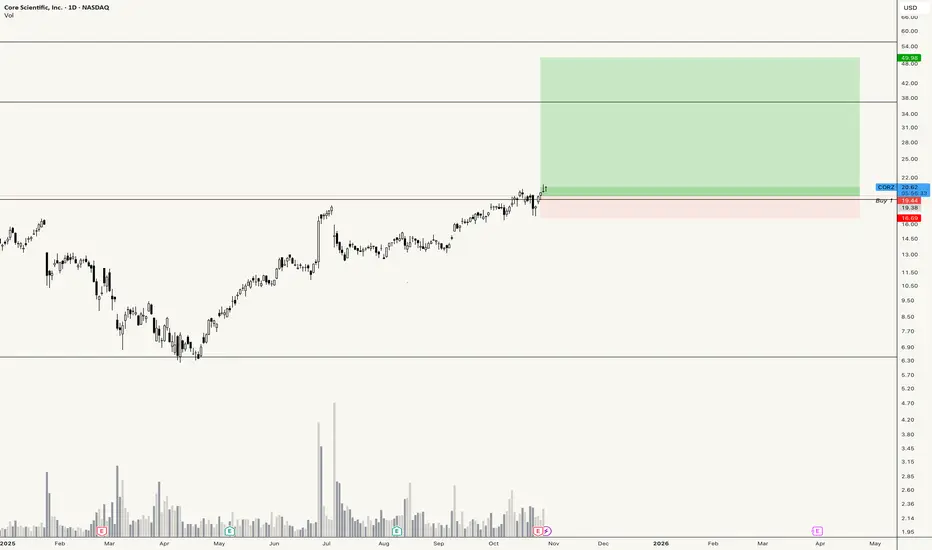
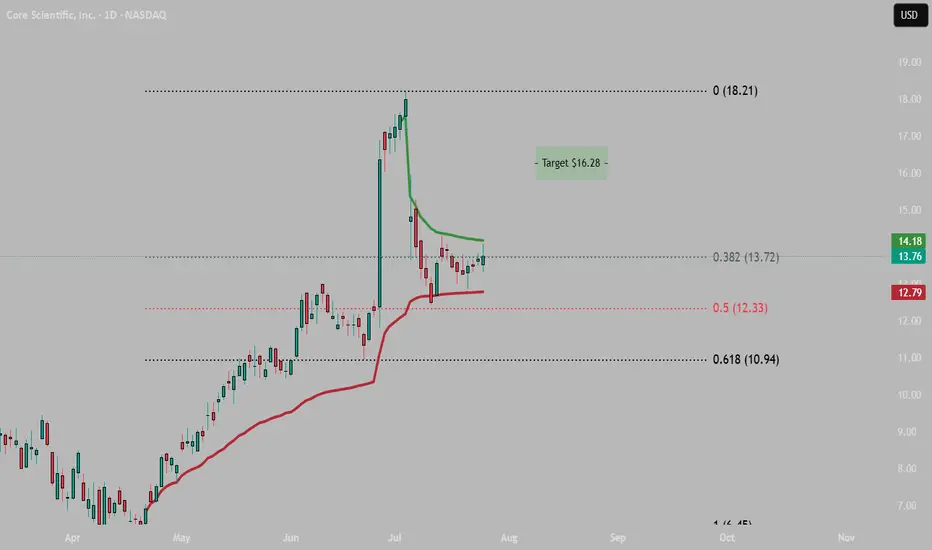
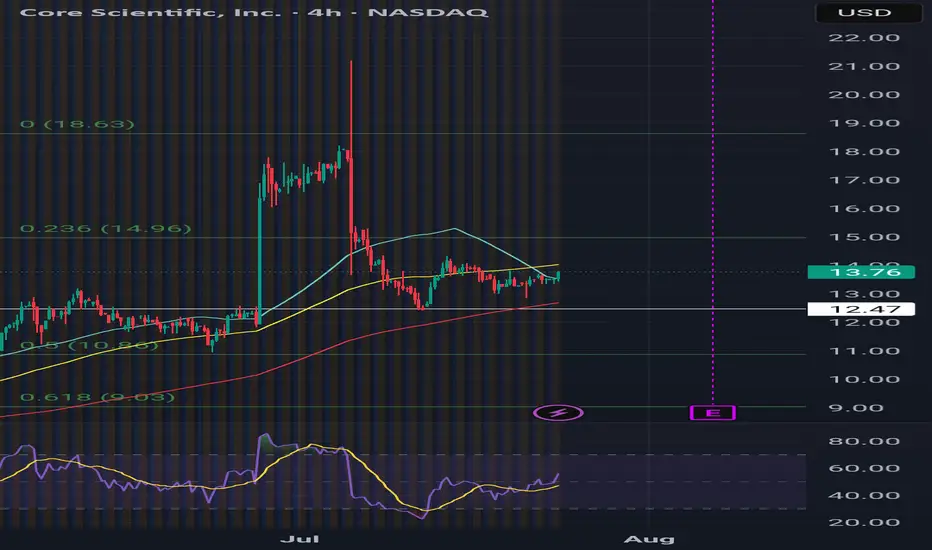
$CORZ · Daily · 06.02.26🧭 NASDAQ:CORZ · Daily · 06.02.26
Up 124% off the April low. Now pressing premium at $30.46 — the weak high. Rising price on rising volume says the trend is alive. But this far into a vertical run, I'm mapping the pullback, not chasing the high.
The thesis:
Price is extended at the top of the ran
Compare with Core Scientific, Inc.
−0.96 USD
−280.74 M USD
319.02 M USD
300.63 M
Next report date
—
Report period
—
EPS estimate
—
Revenue estimate
—
Profile
Sector
Industry
CEO
Adam Sullivan
Website
Headquarters
Dover
Founded
2017
IPO date
Apr 5, 2021
ISIN
US21874A1060
CUSIP
21874A106
FIGI
BBG01L5GH011
Identifiers
ISIN US21874A1060
Core Scientific, Inc. engages in the business of operating a purpose-built facility for digital asset mining and provision of blockchain infrastructure, software solutions, and services. It operates under the Mining and Hosting segments. The Mining segment focuses on bitcoin mining for the company's own account. The Hosting segment includes blockchain infrastructure and third-party hosting business. The company was founded by Michael Jeffrey Levitt and Darin Feinstein on December 13, 2017 and is headquartered in Dover, DE.
CORZ Weekly | Testing 0.702 Fib at Confluence Zone — AI Pivot MCORZ Weekly | Testing 0.702 Fib at Confluence Zone — AI Pivot Meets Macro Tailwind
NASDAQ:CORZ breaking out of a multi-month descending wedge on the weekly and now pressing into the 0.702 Fibonacci retracement at $18.80. This is the level that matters.
Structure:
Price reclaimed the CM Ultimate
$CORZ | Cup & Handle Breakout – Key Levels Ahead🔹 Technical Setup
Clean Cup & Handle formation confirmed above 17.50–18.10 resistance.
RSI hot (74.5) but still supportive of trend continuation.
Volume expansion aligns with breakout structure.
Fib extensions project 21.0 → 22.7 → 25.6 as upside targets.
🔹 Diverging Forecasts
WaverVanir DSS p
CORZ: Head & Shoulders Top – 50MA BreakdownThe Setup:
Core Scientific ( NASDAQ:CORZ ) is facing heavy technical damage, perfectly illustrating why we avoid long exposure in a weak market and a weak sector . The stock has carved out a massive Head and Shoulders topping pattern, signaling a major trend reversal. Adding to the bearish con
CORZ breakout setup: traders eye $17.50 level for upside move:Current Price: 15.81 (Analysis was generated on Monday Morning)
Direction: LONG
Confidence level: 58%(Social trading sentiment leans bullish and several traders repeatedly highlighted $17.50 as a breakout level with upside toward $20+, but the lack of YouTube and Reddit data reduces confirmation s
Merger canceled?Will some news push CORZ upward? It’s currently a laggard in the sector and just needs some fundamental catalyst to gain momentum. The downside seems protected in my view, as most holders are either waiting for the buyout or for the merger to fall through, which would likely trigger a bullish re-pri
CORZ daily resistance breakout!🔉Sound on!🔉
📣Make sure to watch fullscreen!📣
Thank you as always for watching my videos. I hope that you learned something very educational! Please feel free to like, share, and comment on this post. Remember only risk what you are willing to lose. Trading is very risky but it can change your life!
CORZ Earnings Alert — Bearish Setup Ahead of BMO Report****⚠️ CORZ Earnings Alert — Bearish Setup Ahead of BMO Report**
Core Scientific (CORZ) faces heavy fundamental headwinds with declining revenue (-55.6%) and negative margins, despite some bullish options flow and technical support near \$14.
**📉 Market Sentiment:**
* Moderate bearish conviction (7
See all ideas
Summarizing what the indicators are suggesting.
Neutral
SellBuy
Strong sellStrong buy
Strong sellSellNeutralBuyStrong buy
Neutral
SellBuy
Strong sellStrong buy
Strong sellSellNeutralBuyStrong buy
Neutral
SellBuy
Strong sellStrong buy
Strong sellSellNeutralBuyStrong buy
An aggregate view of professional's ratings.
Neutral
SellBuy
Strong sellStrong buy
Strong sellSellNeutralBuyStrong buy
Neutral
SellBuy
Strong sellStrong buy
Strong sellSellNeutralBuyStrong buy
Neutral
SellBuy
Strong sellStrong buy
Strong sellSellNeutralBuyStrong buy
Displays a symbol's price movements over previous years to identify recurring trends.
— YTM
Maturity dateMay 15, 2031
Coupon7.75% (Fixed)
— YTM
Maturity dateJun 15, 2031
Coupon0% (Zero)
— YTM
Maturity dateSep 1, 2029
Coupon3.00% (Fixed)
See all CORZ bonds
Weight0.01%
Market value245.44 M
Weight0.09%
Market value177.28 M
Weight0.21%
Market value170.56 M
Weight0.08%
Market value128.84 M
Weight0.21%
Market value102.40 M
Weight0.09%
Market value93.34 M
Weight0.39%
Market value56.58 M
Weight0.24%
Market value46.25 M
Weight0.26%
Market value35.70 M
Weight3.20%
Market value35.27 M
Weight0.15%
Market value33.64 M
Explore more ETFs
Frequently asked questions
The current price of CORZ is 24.45 USD — it has increased by 6.97% in the past 24 hours. Watch Core Scientific, Inc. stock price performance more closely on the chart.
Depending on the exchange, the stock ticker may vary. For instance, on NASDAQ exchange Core Scientific, Inc. stocks are traded under the ticker CORZ.
CORZ stock has fallen by −2.38% compared to the previous week, the month change is a −23.08% fall, over the last year Core Scientific, Inc. has showed a 82.87% increase.
We've gathered analysts' opinions on Core Scientific, Inc. future price: according to them, CORZ price has a max estimate of 55.00 USD and a min estimate of 27.00 USD. Watch CORZ chart and read a more detailed Core Scientific, Inc. stock forecast: see what analysts think of Core Scientific, Inc. and suggest that you do with its stocks.
CORZ reached its all-time high on Jun 2, 2026 with the price of 30.46 USD, and its all-time low was 2.61 USD and was reached on Feb 1, 2024. View more price dynamics on CORZ chart.
See other stocks reaching their highest and lowest prices.
CORZ stock is 9.00% volatile and has beta coefficient of 2.20. Track Core Scientific, Inc. stock price on the chart and check out the list of the most volatile stocks — is Core Scientific, Inc. there?
Today Core Scientific, Inc. has the market capitalization of 6.68 B, it has decreased by −7.79% over the last week.
Yes, you can track Core Scientific, Inc. financials in yearly and quarterly reports right on TradingView.
Core Scientific, Inc. is going to release the next earnings report on Aug 6, 2026. Keep track of upcoming events with our Earnings Calendar.
CORZ earnings for the last quarter are −1.06 USD per share, whereas the estimation was −0.06 USD resulting in a −1.58 K% surprise. The estimated earnings for the next quarter are −0.06 USD per share. See more details about Core Scientific, Inc. earnings.
Core Scientific, Inc. revenue for the last quarter amounts to 115.24 M USD, despite the estimated figure of 117.04 M USD. In the next quarter, revenue is expected to reach 144.90 M USD.
CORZ net income for the last quarter is −342.44 M USD, while the quarter before that showed 190.52 M USD of net income which accounts for 0.00% change. Track more Core Scientific, Inc. financial stats to get the full picture.
No, CORZ doesn't pay any dividends to its shareholders. But don't worry, we've prepared a list of high-dividend stocks for you.
As of Jul 21, 2026, the company has 325 employees. See our rating of the largest employees — is Core Scientific, Inc. on this list?
EBITDA measures a company's operating performance, its growth signifies an improvement in the efficiency of a company. Core Scientific, Inc. EBITDA is −102.85 M USD, and current EBITDA margin is −35.35%. See more stats in Core Scientific, Inc. financial statements.
Like other stocks, CORZ shares are traded on stock exchanges, e.g. Nasdaq, Nyse, Euronext, and the easiest way to buy them is through an online stock broker. To do this, you need to open an account and follow a broker's procedures, then start trading. You can trade Core Scientific, Inc. stock right from TradingView charts — choose your broker and connect to your account.
Investing in stocks requires a comprehensive research: you should carefully study all the available data, e.g. company's financials, related news, and its technical analysis. So Core Scientific, Inc. technincal analysis shows the buy rating today, and its 1 week rating is buy. Since market conditions are prone to changes, it's worth looking a bit further into the future — according to the 1 month rating Core Scientific, Inc. stock shows the buy signal. See more of Core Scientific, Inc. technicals for a more comprehensive analysis.
If you're still not sure, try looking for inspiration in our curated watchlists.