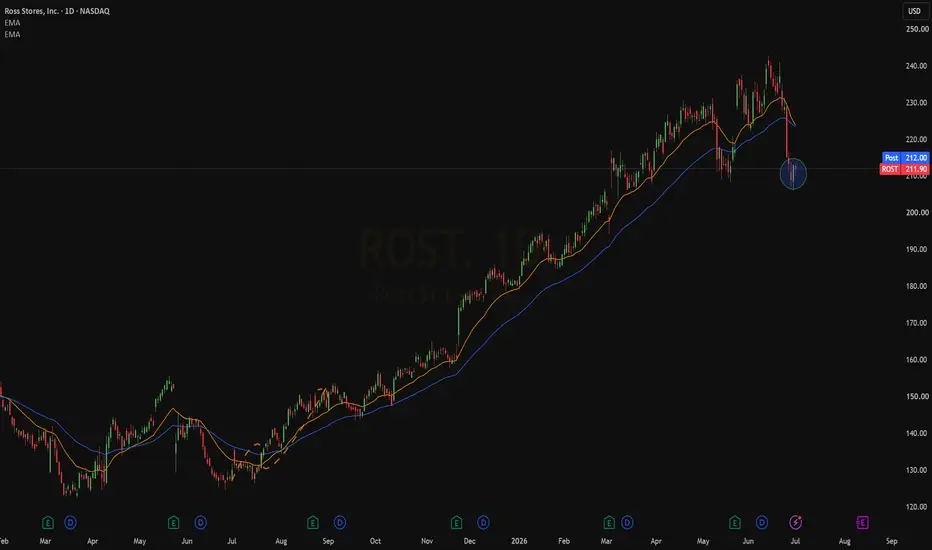
Ross Stores (ROST) Pullback Presents Buying OpportunityROST is attracting buying interest following its recent retracement. The stock remains in a strong uptrend, making higher highs and higher lows while trading above well-aligned 20 and 50-day moving averages, signaling continued bullish momentum.
Ross Stores, Inc. is a $74.89 billion market capitali
Compare with Ross Stores, Inc.
Key facts today
Ross Stores (ROST) opened 47 stores in June–July (35 Ross Dress for Less, 12 dd's), raising 2026 openings toward ~110; recent adds include Puerto Rico, NY, MI, CA, FL, NC, TX. 1
7.22 USD
2.15 B USD
22.75 B USD
313.84 M
Next report date
—
Report period
—
EPS estimate
—
Revenue estimate
—
Profile
Sector
Industry
CEO
James Grant Conroy
Website
Headquarters
Dublin
Founded
1957
IPO date
Aug 8, 1985
ISIN
US7782961038
CUSIP
778296103
FIGI
BBG000BSBZH7
Identifiers
ISIN US7782961038
Ross Stores, Inc. engages in the operation of off-price retail apparel and home accessories stores. Its products include branded and designer apparel, accessories, footwear, and home fashions through the Dress for Less and dd's DISCOUNTS brands. The company was founded by Stuart G. Moldaw in 1957 and is headquartered in Dublin, CA.
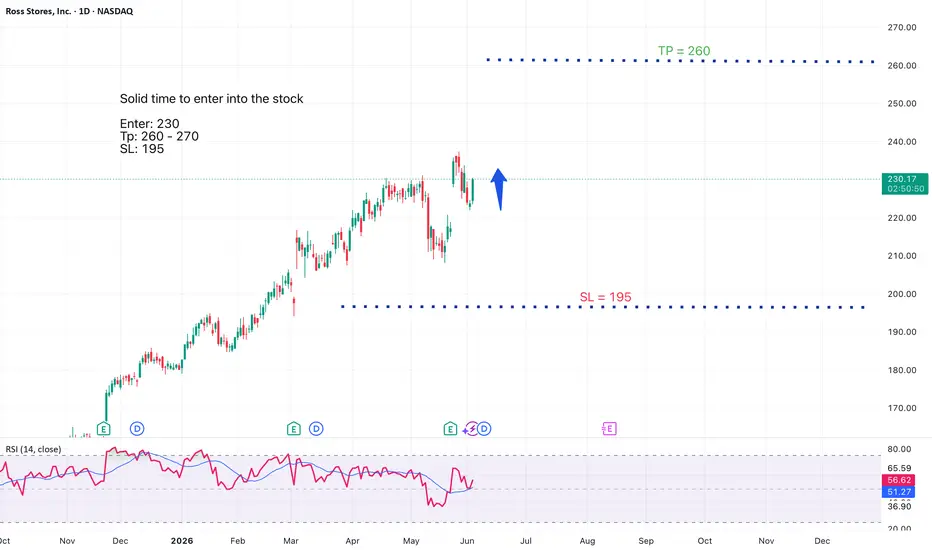
Buy ~ $ROST — Steady Uptrend with Strong Fundamentals As you can see, this stock has been maintaining a steady and consistent uptrend, showing strong price structure over time.
On the fundamental side, the story remains equally compelling, with a healthy upward revision to full-year guidance and notable confidence from major institutions that have be
ROST — 98% Bull Signals, Whale Sell, Bear Volume at CeilingPrice is at 213.52 with no futures market. The bias reads 98.4% bull against 1.6% bear across 112 signals — the most extreme directional reading in this entire series by a significant margin. Clarity at 52% is the highest of the group. Retrace is only -1.5% with a 15.6% bounce target at 10.3x Para.
ROST pressing highs ahead of earnings — momentum favors upside:Current Price: 205.64 (Analysis was generated on Monday Morning)
Direction: LONG
Confidence level: 68%(X sentiment shows clear bullish bias with multiple traders expecting upside ahead of earnings, and price is holding above key support levels. Confidence is moderated due to limited YouTube trader
ROST Breaks Higher as Strong Uptrend and Volume Confirm StrengthROST is in a strong ascending trend, supported by increasing volume, signaling rising institutional interest. The stock continues to print higher highs and higher lows, while holding firmly above key moving averages, reinforcing the prevailing uptrend. Price is currently in a breakout phase, trading
ROST - Ross Stores - Broke previous High and back for Re-testHello Everyone, Followers,
Second one and probably last one from me for today is ROST - Ross Stores Inc.
What they do
Ross Stores is a major U.S. off-price retailer. They operate the flagship “Ross Dress for Less®” chain—the largest off-price apparel & home fashion chain in the U.S.—plus the dd’
Ross Stores, Inc. (ROST) Grows With Consumer Value FocusRoss Stores, Inc. (ROST) is a leading off-price retailer offering name-brand apparel, footwear, and home fashions at discounted prices. With over 2,000 stores across the U.S. under the Ross Dress for Less and dd’s DISCOUNTS banners, the company attracts value-conscious shoppers in all markets. Ross’
ROST - Strong Fundamental + Technical Breakout Setup**Title: ROST - Strong Fundamental + Technical Breakout Setup | Long Entry $150.9**
---
**📈 Ticker:** ROST (Ross Stores Inc.)
**📍 Recommendation:** LONG
**⏰ Timeframe:** Swing to Position Trade (1-4 weeks)
---
### **🎯 Trade Idea Summary**
- **Entry:** $150.90 (on pullback or breakout confi
ROST Earnings Play: Big Call Setup Ahead of BMO! 🚀 ROST Earnings Play: Big Call Setup Ahead of BMO! (Aug 21, 2025) 🚀
### 🏦 Earnings Outlook
* 📊 **Revenue Growth:** +2.6% TTM – stable retail performance
* ⚖️ **Margins:** Profit 9.8%, Operating 12.2%, Gross 32.8% → strong operational efficiency
* 📈 **Historical Beat Rate:** 100% over last 8 quarte
See all ideas
Summarizing what the indicators are suggesting.
Neutral
SellBuy
Strong sellStrong buy
Strong sellSellNeutralBuyStrong buy
Neutral
SellBuy
Strong sellStrong buy
Strong sellSellNeutralBuyStrong buy
Neutral
SellBuy
Strong sellStrong buy
Strong sellSellNeutralBuyStrong buy
An aggregate view of professional's ratings.
Neutral
SellBuy
Strong sellStrong buy
Strong sellSellNeutralBuyStrong buy
Neutral
SellBuy
Strong sellStrong buy
Strong sellSellNeutralBuyStrong buy
Neutral
SellBuy
Strong sellStrong buy
Strong sellSellNeutralBuyStrong buy
Displays a symbol's price movements over previous years to identify recurring trends.
6.247% YTM
Maturity dateApr 15, 2050
Coupon5.45% (Fixed)
4.971% YTM
Maturity dateApr 15, 2030
Coupon4.80% (Fixed)
4.832% YTM
Maturity dateApr 15, 2031
Coupon1.88% (Fixed)
4.480% YTM
Maturity dateApr 15, 2027
Coupon4.70% (Fixed)
See all ROST bonds
Weight0.09%
Market value2.18 B
Weight0.11%
Market value1.78 B
Weight0.34%
Market value1.58 B
Weight0.66%
Market value1.49 B
Weight0.12%
Market value1.04 B
Weight0.12%
Market value929.70 M
Weight1.93%
Market value746.53 M
Weight1.48%
Market value677.48 M
Weight0.26%
Market value652.28 M
Weight2.26%
Market value549.83 M
Weight1.50%
Market value525.32 M
Explore more ETFs
Frequently asked questions
The current price of ROST is 237.09 USD — it has increased by 0.99% in the past 24 hours. Watch Ross Stores, Inc. stock price performance more closely on the chart.
Depending on the exchange, the stock ticker may vary. For instance, on NASDAQ exchange Ross Stores, Inc. stocks are traded under the ticker ROST.
ROST stock has risen by 4.90% compared to the previous week, the month change is a 0.18% rise, over the last year Ross Stores, Inc. has showed a 81.64% increase.
We've gathered analysts' opinions on Ross Stores, Inc. future price: according to them, ROST price has a max estimate of 290.00 USD and a min estimate of 230.00 USD. Watch ROST chart and read a more detailed Ross Stores, Inc. stock forecast: see what analysts think of Ross Stores, Inc. and suggest that you do with its stocks.
ROST reached its all-time high on Jun 12, 2026 with the price of 242.81 USD, and its all-time low was 0.11 USD and was reached on Oct 26, 1987. View more price dynamics on ROST chart.
See other stocks reaching their highest and lowest prices.
ROST stock is 3.26% volatile and has beta coefficient of 0.42. Track Ross Stores, Inc. stock price on the chart and check out the list of the most volatile stocks — is Ross Stores, Inc. there?
Today Ross Stores, Inc. has the market capitalization of 74.65 B, it has increased by 6.38% over the last week.
Yes, you can track Ross Stores, Inc. financials in yearly and quarterly reports right on TradingView.
Ross Stores, Inc. is going to release the next earnings report on Aug 13, 2026. Keep track of upcoming events with our Earnings Calendar.
ROST earnings for the last quarter are 2.02 USD per share, whereas the estimation was 1.73 USD resulting in a 16.72% surprise. The estimated earnings for the next quarter are 1.93 USD per share. See more details about Ross Stores, Inc. earnings.
Ross Stores, Inc. revenue for the last quarter amounts to 6.01 B USD, despite the estimated figure of 5.64 B USD. In the next quarter, revenue is expected to reach 6.14 B USD.
ROST net income for the last quarter is 649.96 M USD, while the quarter before that showed 645.87 M USD of net income which accounts for 0.00% change. Track more Ross Stores, Inc. financial stats to get the full picture.
Yes, ROST dividends are paid quarterly. The last dividend per share was 0.44 USD. As of today, Dividend Yield (TTM)% is 0.73%. Tracking Ross Stores, Inc. dividends might help you take more informed decisions.
Ross Stores, Inc. dividend yield was 0.86% in 2025, and payout ratio reached 24.50%. The year before the numbers were 0.98% and 23.27% correspondingly. See high-dividend stocks and find more opportunities for your portfolio.
As of Jul 21, 2026, the company has 111 K employees. See our rating of the largest employees — is Ross Stores, Inc. on this list?
EBITDA measures a company's operating performance, its growth signifies an improvement in the efficiency of a company. Ross Stores, Inc. EBITDA is 3.43 B USD, and current EBITDA margin is 14.14%. See more stats in Ross Stores, Inc. financial statements.
Like other stocks, ROST shares are traded on stock exchanges, e.g. Nasdaq, Nyse, Euronext, and the easiest way to buy them is through an online stock broker. To do this, you need to open an account and follow a broker's procedures, then start trading. You can trade Ross Stores, Inc. stock right from TradingView charts — choose your broker and connect to your account.
Investing in stocks requires a comprehensive research: you should carefully study all the available data, e.g. company's financials, related news, and its technical analysis. So Ross Stores, Inc. technincal analysis shows the buy rating today, and its 1 week rating is buy. Since market conditions are prone to changes, it's worth looking a bit further into the future — according to the 1 month rating Ross Stores, Inc. stock shows the buy signal. See more of Ross Stores, Inc. technicals for a more comprehensive analysis.
If you're still not sure, try looking for inspiration in our curated watchlists.