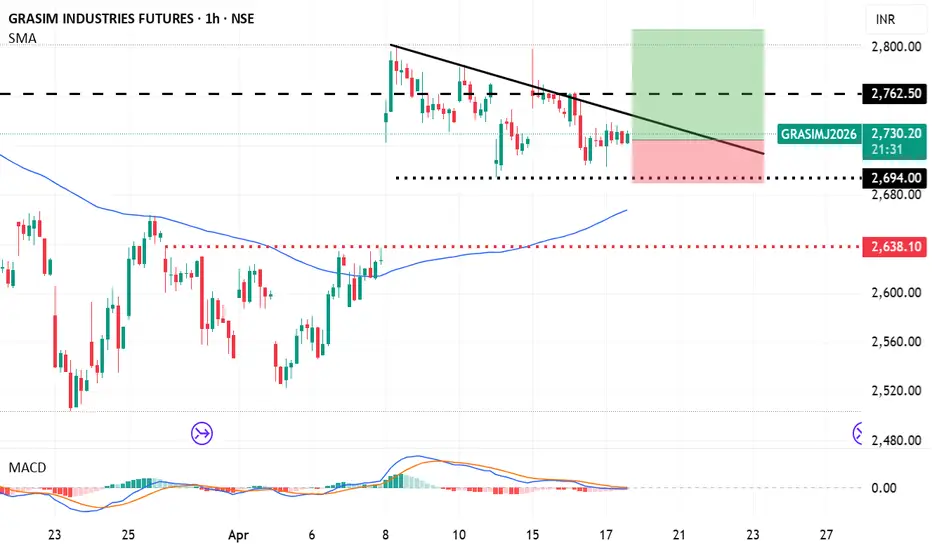
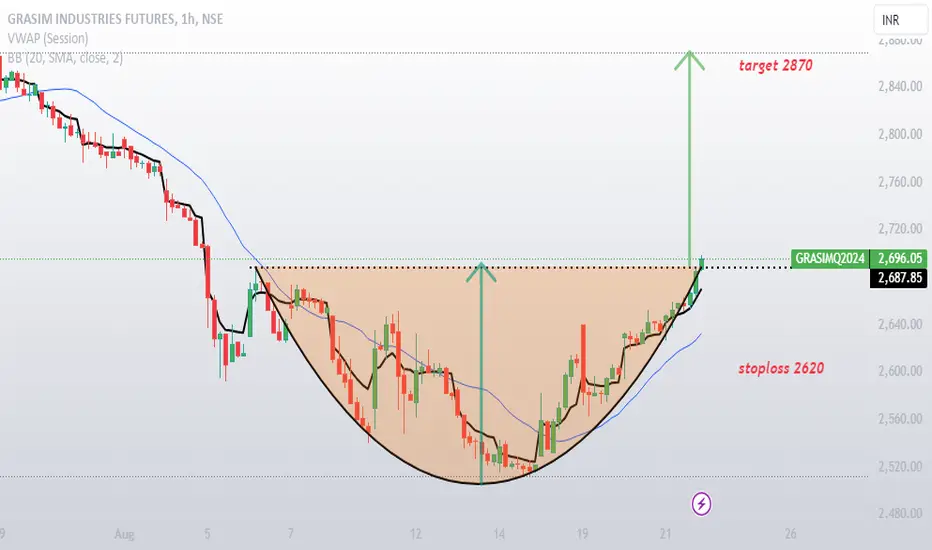
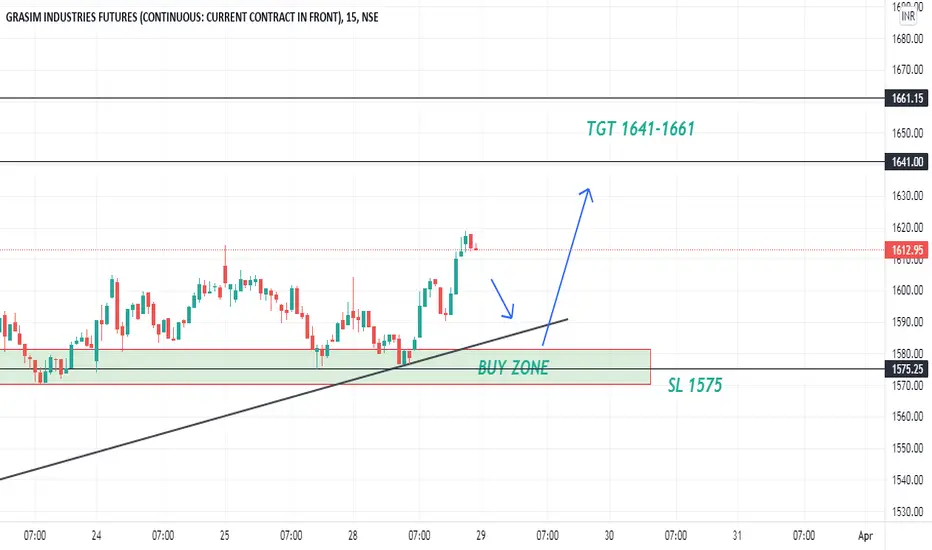
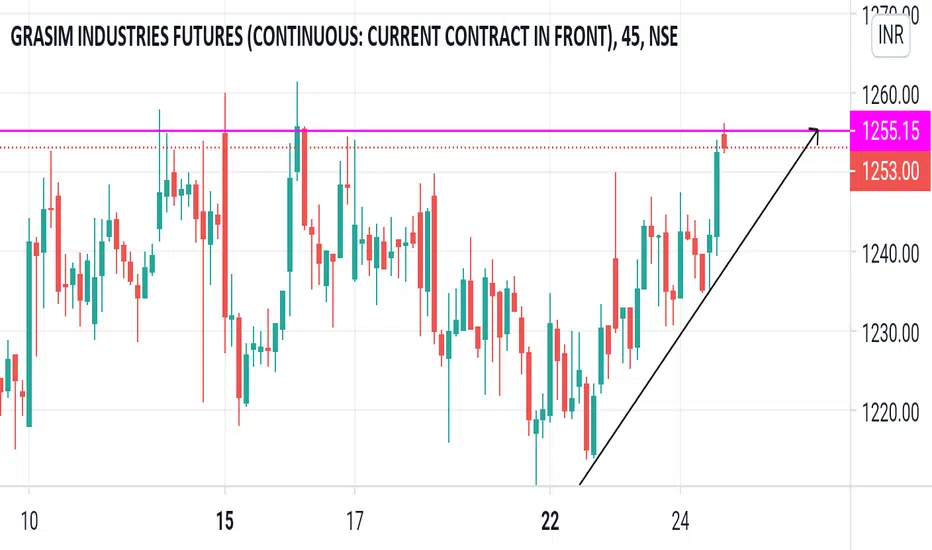
GRASIM INDUSTRIES FUTURES
No trades
No trades
See all ideas
Summarizing what the indicators are suggesting.
Neutral
Neutral
Neutral
A representation of what an asset is worth today and what the market thinks it will be worth in the future.
Frequently asked questions
Today, GRASIMZ2026 trades at 3,200.80 INR.
For broader market analysis, dive into the technicals on the GRASIMZ2026 futures price chart and read the latest GRASIMZ2026 news:
– Diwali Stock Picks 2026: Tata Steel, BEL, HDFC Bank - 25 brokerages reveal 187 shares to buy in Samvat 2083 | Full List
– Bandu’s Blockbusters for November 8, 2026
– Home loan interest rates for Diwali 2026: Planning to buy a house? Check rates starting at 7.25% across major banks
For broader market analysis, dive into the technicals on the GRASIMZ2026 futures price chart and read the latest GRASIMZ2026 news:
– Diwali Stock Picks 2026: Tata Steel, BEL, HDFC Bank - 25 brokerages reveal 187 shares to buy in Samvat 2083 | Full List
– Bandu’s Blockbusters for November 8, 2026
– Home loan interest rates for Diwali 2026: Planning to buy a house? Check rates starting at 7.25% across major banks
GRASIMZ2026 volume is the number of futures contracts traded over a given period. The current volume is 117.75 K.
This metric helps you understand market activity and liquidity:
– Higher volume indicates strong interest and easier trade execution
– Lower volume may signal weaker participation and wider spreads
Traders often use volume to confirm trends and identify potential reversals. Track more movements on the GRASIMZ2026 chart.
This metric helps you understand market activity and liquidity:
– Higher volume indicates strong interest and easier trade execution
– Lower volume may signal weaker participation and wider spreads
Traders often use volume to confirm trends and identify potential reversals. Track more movements on the GRASIMZ2026 chart.
When to sell GRASIMZ2026 futures depends on your strategy, risk tolerance, and market conditions. Traders often consider reducing or closing positions when:
– Profit targets are reached: Locking in gains after a favorable price move
– Technical signals weaken: Trend reversals, resistance levels, or bearish indicators emerge
– Expiration approaches: Some traders close or roll positions ahead of Dec 29, 2026 to maintain exposure in a later contract and avoid settlement
– Market conditions change: Shifts in macro trends, seasonality, or market sentiment may affect the outlook
Selling is often part of a broader trading and risk management plan rather than an attempt to time the market perfectly.
– Profit targets are reached: Locking in gains after a favorable price move
– Technical signals weaken: Trend reversals, resistance levels, or bearish indicators emerge
– Expiration approaches: Some traders close or roll positions ahead of Dec 29, 2026 to maintain exposure in a later contract and avoid settlement
– Market conditions change: Shifts in macro trends, seasonality, or market sentiment may affect the outlook
Selling is often part of a broader trading and risk management plan rather than an attempt to time the market perfectly.
One way to gain exposure to GRASIMZ2026 is through a broker that offers futures. Before trading, make sure you understand how the product works and the risks involved.
You can trade GRASIMZ2026 directly from TradingView:
– Choose a broker: Explore our supported trading partners and pick one that fits your needs
– Compare options: View available brokers side by side to evaluate fees and features
– Connect your account: Open Supercharts, click "Trade", select your broker, and log in
– Start trading: Place orders directly from the chart
Tip: If you're new to trading, try paper trading first — it lets you practice strategies in real market conditions without risking funds.
You can trade GRASIMZ2026 directly from TradingView:
– Choose a broker: Explore our supported trading partners and pick one that fits your needs
– Compare options: View available brokers side by side to evaluate fees and features
– Connect your account: Open Supercharts, click "Trade", select your broker, and log in
– Start trading: Place orders directly from the chart
Tip: If you're new to trading, try paper trading first — it lets you practice strategies in real market conditions without risking funds.
No single indicator can determine whether to buy or sell GRASIMZ2026 futures contracts. The right decision depends on market conditions, risk tolerance, and your trading strategy.
Here are a few factors to consider:
• Technical rating — neutral: A summary of signals from multiple technical indicators that can help assess current market conditions.
• Forward curve: The relationship between futures prices across different expiration dates, which can provide insight into market expectations and sentiment.
For a broader view, consider these metrics alongside price action, market news, and fundamental data.
Here are a few factors to consider:
• Technical rating — neutral: A summary of signals from multiple technical indicators that can help assess current market conditions.
• Forward curve: The relationship between futures prices across different expiration dates, which can provide insight into market expectations and sentiment.
For a broader view, consider these metrics alongside price action, market news, and fundamental data.
The nearest expiration date for GRASIMZ2026 is Dec 29, 2026.
Futures contracts expire on predetermined dates. As expiration approaches, many traders roll positions into the next contract to maintain exposure to the market.
Key metrics to watch near expiration:
• Volume and liquidity: Trading activity often shifts to the next contract month
• Open interest: Falling open interest may signal positions being closed or rolled forward
• Forward curve: Differences between contract prices can help identify market structure, including contango and backwardation
Explore the GRASIMZ2026 chart to monitor active contracts and contract-month activity.
Futures contracts expire on predetermined dates. As expiration approaches, many traders roll positions into the next contract to maintain exposure to the market.
Key metrics to watch near expiration:
• Volume and liquidity: Trading activity often shifts to the next contract month
• Open interest: Falling open interest may signal positions being closed or rolled forward
• Forward curve: Differences between contract prices can help identify market structure, including contango and backwardation
Explore the GRASIMZ2026 chart to monitor active contracts and contract-month activity.
Open interest is the total number of active futures contracts that have not been closed or expired. For GRASIMZ2026, the current open interest is 92.50 K.
Traders use open interest to assess trend strength and market participation:
– Rising price + rising open interest: New money is entering the market, trend may be strengthening
– Rising price + falling open interest: Positions are being closed, trend may weaken
– Falling price + rising open interest: Increasing short positions, bearish pressure may build
– Falling price + falling open interest: Positions are closing, trend may be losing momentum
Open interest is most effective when combined with volume and price action — track both on the GRASIMZ2026 chart for deeper insight.
Traders use open interest to assess trend strength and market participation:
– Rising price + rising open interest: New money is entering the market, trend may be strengthening
– Rising price + falling open interest: Positions are being closed, trend may weaken
– Falling price + rising open interest: Increasing short positions, bearish pressure may build
– Falling price + falling open interest: Positions are closing, trend may be losing momentum
Open interest is most effective when combined with volume and price action — track both on the GRASIMZ2026 chart for deeper insight.