CRUDE OIL 1000-DAY AVERAGEWhy should we look at a 1000-day average? Because people are talking about inflation from crude oil prices and that it is a terrible thing that is destroying consumer confidence, destroying consumer purchasing power and it is in the headlines continuously.
So let's look at it and see what it shows
Crude Oil Futures (Jan 2035)
No trades
No trades
Compare with Crude Oil Futures (Jan 2035)
Contract highlights
USOIL is setting a Trap?USOIL has staged an impressive recovery from the $68–72 weekly demand zone, reaching approximately $101.70. However, despite the bullish momentum, I am not interested in buying at current prices.
The market is now trading directly below a major resistance cluster:
• Weekly descending trendline
• Pre
USOIL at 90$ last pump to 98-103$ before going lower. TVC:USOIL To me it's trading inside a daily bear flag, we are near the support of the bear flag, we bounce right off the 50ema day at 89$ today 22 september 2026. Daily there's 2 gap's from 98-100$, then on the 12hr a fair value gap at 103$ish. So that'S why I'm bullish and see it go up to 98-103$
CL Daily_+3,481 Ticks to targetCL Daily time frame is in a down trend. The market
is making lower lows and lower highs. There is a
down Fibonacci with an extension price point 63.18
about -3,481 ticks below the market. As long as the
market does not take out the one boundary price
point 110.93 it is expected the market to fall t
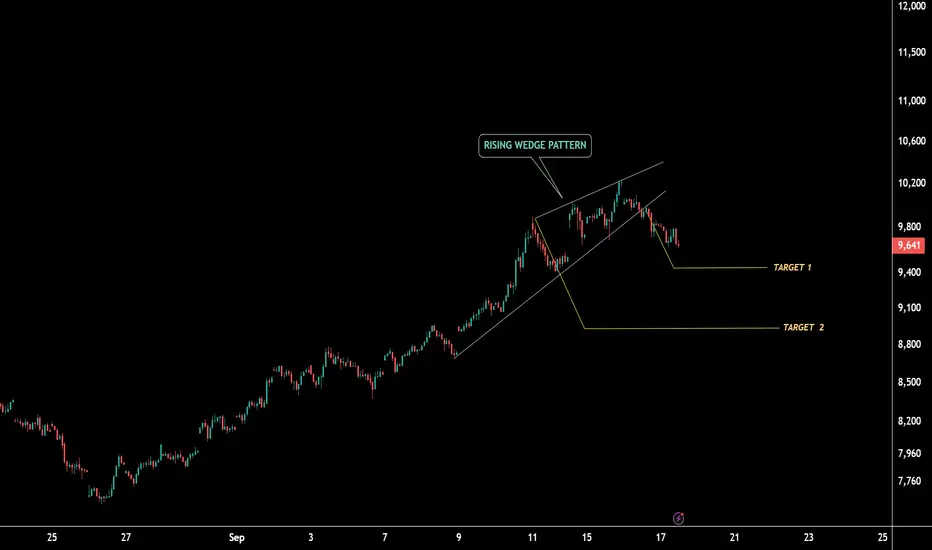
CRUDE OIL: Rising Wedge Breakdown Setup Crude Oil is showing a potential bearish reversal setup as price develops a clear Rising Wedge pattern near the ₹10,000–₹10,200 resistance zone.
Key Technical Observations
Rising Wedge Pattern
Price has been moving upward within a narrowing structure, indicating weakening momentum despite higher p
Crude Oil (CL) Analysis, Key-Zones, Setup for Fri (Sep 18)Bias: Crude settled Thursday at 97.23 on the November contract, down 52 cents or 0.53 percent, and that settlement conceals the entire session. November opened at 97.50, printed a session low of 94.42 and settled 83 percent of the way up a 3.37 dollar range. The decline that actually happened was 3
See all ideas
Summarizing what the indicators are suggesting.
Neutral
Neutral
Neutral
A representation of what an asset is worth today and what the market thinks it will be worth in the future.
Displays a symbol's price movements over previous years to identify recurring trends.
Frequently asked questions
The current price of Crude Oil Futures (Jan 2035) is 54.59 USD / BLL — it has fallen −0.56% in the past 24 hours. Watch Crude Oil Futures (Jan 2035) price in more detail on the chart.
Track more important stats on the Crude Oil Futures (Jan 2035) chart.
The nearest expiration date for Crude Oil Futures (Jan 2035) is Dec 19, 2034.
Traders prefer to sell futures contracts when they've already made money on the investment, but still have plenty of time left before the expiration date. Thus, many consider it a good option to sell Crude Oil Futures (Jan 2035) before Dec 19, 2034.
Buying or selling futures contracts depends on many factors: season, underlying commodity, your own trading strategy. So mostly it's up to you, but if you look for some certain calculations to take into account, you can study technical analysis for Crude Oil Futures (Jan 2035). Today its technical rating is sell, but remember that market conditions change all the time, so it's always crucial to do your own research. See more of Crude Oil Futures (Jan 2035) technicals for a more comprehensive analysis.