CRUDE OIL 1000-DAY AVERAGEWhy should we look at a 1000-day average? Because people are talking about inflation from crude oil prices and that it is a terrible thing that is destroying consumer confidence, destroying consumer purchasing power and it is in the headlines continuously.
So let's look at it and see what it shows. Objectively the average price at the end of a President's term is the "average price that people experienced during that term".
So in January 2021, the 4-year average (approximate 250 trading days a year, usually 255 times 4 years = 1000 days) price for a barrel of oil was $53.34. When Biden's term ended in January 2025 the 1000-day average was $78.67 for an increase of $25.33 over the 4-year term.
We can compare this number to the average in January 2029 and see what the difference is. So far, the average price over the last 400 days is $70.88, which is down from the average of $78.67 over the previous 4-year presidential term.
The price ABOVE average now, of course, so that average will keep rising. But it is rising for a different reason this time.
Sorry for this over simplistic view of the situation but it is 'election season' and the mudslinging continues with every candidate willing to say whatever it takes to get elected.
Enjoy!
Tim West
9/18/2026 1:17PM MST
Denver Time
Crude Oil Futures (Jan 2035)
No trades
No trades
In-depth trading ideas
USOIL is setting a Trap?USOIL has staged an impressive recovery from the $68–72 weekly demand zone, reaching approximately $101.70. However, despite the bullish momentum, I am not interested in buying at current prices.
The market is now trading directly below a major resistance cluster:
• Weekly descending trendline
• Previous swing highs
• Supply between $104 and $106
This is an area where I expect increased volatility and a possible liquidity grab before the market reveals its next directional move.
📈 COT positioning
The latest available COT report shows Non-Commercial traders holding:
• 350,118 long contracts
• 213,539 short contracts
• Net position: +136,579 contracts
During the week, speculative traders added 17,670 longs and 11,002 shorts, improving their net-long exposure by approximately 6,668 contracts.
Open Interest also increased by 18,826 contracts, indicating that new capital is entering the market.
I consider this moderately bullish, but not an extreme signal: both long and short positions increased, meaning positioning is expanding on both sides.
📅 Seasonality warning
Seasonality is the main factor preventing me from becoming aggressively bullish.
September has historically been negative over the longer 10-, 15- and 20-year periods, despite positive performance over the most recent 2–5 years.
More importantly, November shows a negative average return across every period analysed. This suggests that the current rally could still be followed by a significant corrective phase.
My conclusion
The broader structure remains bullish, but USOIL is approaching resistance with an unattractive risk-to-reward profile for new long positions.
I am not chasing the rally.
My ideal setup would be a liquidity sweep around $104–106, followed by a controlled retracement into $94–96 and a confirmed bullish reaction targeting $112–116.
If the market closes decisively below $94, I will abandon the immediate bullish scenario and look toward $80, followed by the weekly demand at $72–74.
USOIL at 90$ last pump to 98-103$ before going lower. TVC:USOIL To me it's trading inside a daily bear flag, we are near the support of the bear flag, we bounce right off the 50ema day at 89$ today 22 september 2026. Daily there's 2 gap's from 98-100$, then on the 12hr a fair value gap at 103$ish. So that'S why I'm bullish and see it go up to 98-103$ before a possible move down. If breaks the white line and near resistance red trend line at 105$ and stay above for like 2-4 day's it should continue much higher. If not should go back down, note that the 200ema day is 85$ so it's risky to short, and it's inside a bull market, so momentum to the upside.
So what form now - next weeks, pump to 98-103$, as long reject and stay under 105$, should come back to 95$, reject the bear flag support drop under it, possible retest off that support fail and next target is 85$ and lower. A very good long to me is 75$ why? It's the big green trend line support from 2026 January. So if it fails and stays under 85$ the 200ema day, it should go to 75$ where I would look for long's, which could mean if usoil go up, would be bad for the stock market..
CL Daily_+3,481 Ticks to targetCL Daily time frame is in a down trend. The market
is making lower lows and lower highs. There is a
down Fibonacci with an extension price point 63.18
about -3,481 ticks below the market. As long as the
market does not take out the one boundary price
point 110.93 it is expected the market to fall towards
the Fibonacci target.
Entry: Counter trend line break bearish in the sell zone.
STOP: 113.05
LIMIT: 63.18
Another entry idea: If the risk is too large off the daily
time frame. It will be a good idea to turn to the smaller
time frames and look for selling ideas with less risk.
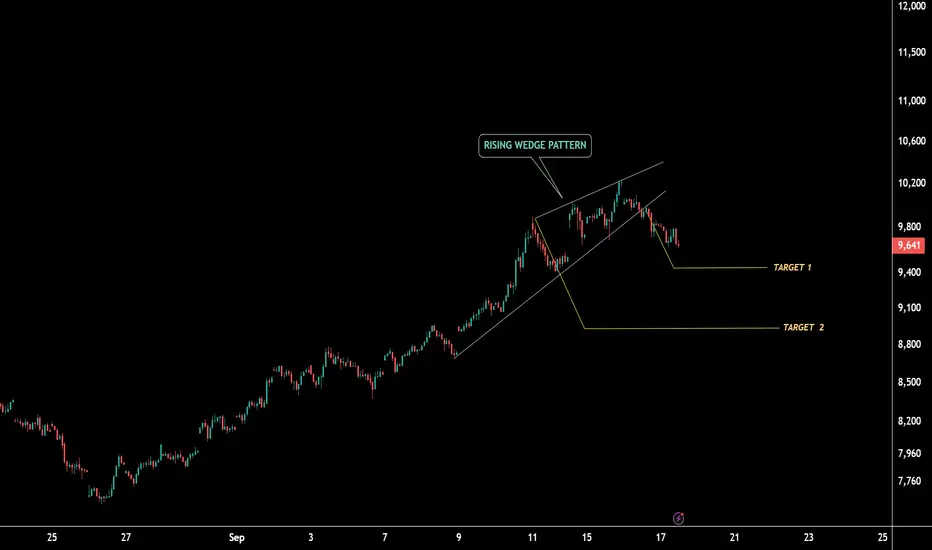
CRUDE OIL: Rising Wedge Breakdown Setup Crude Oil is showing a potential bearish reversal setup as price develops a clear Rising Wedge pattern near the ₹10,000–₹10,200 resistance zone.
Key Technical Observations
Rising Wedge Pattern
Price has been moving upward within a narrowing structure, indicating weakening momentum despite higher prices. A breakdown from the lower trendline can confirm the bearish setup.
Critical Breakdown Zone
A sustained break below ₹9,220 could trigger aggressive selling pressure and confirm the downside move.
Downside Levels
Target 1: ₹9,020
Target 2: ₹8,500
CMT Perspective:
The setup reflects a potential loss of momentum near resistance, followed by a possible breakdown of the rising trendline. Confirmation through a decisive close below the breakdown level would strengthen the bearish thesis.
Trading View
Resistance: ₹10,000–₹10,200
Aggressive Selling: Below ₹9,220
T1: ₹9,020
T2: ₹8,500
Crude Oil (CL) Analysis, Key-Zones, Setup for Fri (Sep 18)Bias: Crude settled Thursday at 97.23 on the November contract, down 52 cents or 0.53 percent, and that settlement conceals the entire session. November opened at 97.50, printed a session low of 94.42 and settled 83 percent of the way up a 3.37 dollar range. The decline that actually happened was 3.41 percent. The decline that survived to the settlement was half a percent. De-escalation authored the move: reports at 7:58 AM ET that China had privately asked Iran to help rein in Yemen's Houthis after a Saudi appeal to Beijing, confirmation that US officials met the Houthis in Oman over the weekend, and a Saudi signal that roughly half the damaged pipeline could restart within days. Escalation headlines arrived in the afternoon, a reported maritime security incident in the Strait of Hormuz 16 nautical miles northeast of Khasab at 3:30 PM ET and explicit government-change language from Israel's prime minister at 3:51 PM ET, and the settlement still finished 2.81 dollars above the low. The forward curve stayed backwardated at the settlement: the expiring October contract settled at 101.91 against November at 97.23, a 4.68 dollar premium for nearer delivery that says barrels are wanted now rather than later. Cross-asset, crude was the independent variable rather than the follower, with cheaper oil easing the inflation path and driving the equity and bond rally, the broad index closing 1.11 percent higher and the technology index 1.70 percent higher, while the dollar index sat near 100.238 in evening trade after the 04:00 PM ET equity close, having held most of its post-decision gains. Positioning inputs for this contract are curve shape and open interest rather than an options surface, and 295,173 contracts on November against 128,801 on the expiring October confirm the roll is complete. Mechanically the contract is extended, with the settlement 8.90 to 32.99 percent above its 20-day through 200-day averages and the multi-indicator composite at 100 percent buy with all thirteen components in agreement, while the 14-day directional index at 35.29 confirms an intact trend rather than a drift. The economic calendar captured for this run lists no energy-specific release for Friday, its one verified Friday item being industrial production at 9:15 AM ET, with Federal Reserve commentary from Bowman at 9:30 AM ET and Schmid at 11:45 AM ET carried on the news-feed calendar only and unconfirmed against a primary source, which places the first-order risk on unscheduled headlines. Bias is constructive higher while 94.42 holds, with mean reversion toward the 97.71 to 97.79 confluence the base case, and the 9:15 AM ET data window is the session's first identifiable catalyst.
Resistance:
- 101.69 to 101.91 the 52-week high converging with Pivot R3, the structural ceiling of the advance
- 99.85 Pivot R2 area, primary upside objective inside one average-range day
- 98.54 Pivot R1, first mechanical objective with no competing structure at the price
- 97.79 session high, upper edge of the immediate ceiling band
- 97.71 5-day moving average, now sitting above price, the earliest signal of momentum fatigue
Support:
- 96.48 Pivot Point, opened on it and traded through it in the reopened session
- 95.17 Pivot S1, lower edge of the primary entry zone
- 94.42 session low, set in Thursday's washout with the settlement 2.81 dollars above it, structural invalidation
- 93.11 Pivot S2, first mechanical objective beneath the session low
- 91.80 Pivot S3, roughly 1.5 average-range units from settlement
- 89.28 20-day moving average, first structural support base beneath the pivot mathematics
Primary Setup: LONG CL from the 95.17 to 96.48 zone on a pullback into the pivot shelf beneath Thursday's settlement, with the thesis resting on a settlement 83 percent up the session range and a forward curve still in 4.68 dollar backwardation. Stop 94.25, placed beneath the session low at 94.42, a level established in Thursday's washout, whose failure would mean the demand that defined Thursday has withdrawn. Targets at 97.79 first, the session high with the 5-day moving average immediately beneath it, 98.54 second at Pivot R1, and 99.85 third at Pivot R2 if momentum extends through the second target on expanding volume. The position carries one half to two thirds of equivalent equity index risk, because a 14-day average true range of 3.60 dollars means 3.70 percent of settlement moves in a routine session, and stops tighter than 75 to 100 cents are not defensible against that range. Pricing is likely to be disorderly around the 9:15 AM ET industrial production release and the Federal Reserve commentary the news-feed calendar places, unconfirmed, at 9:30 AM ET, and the 9:00 AM ET pit open sets the session's first directional test. A decisive close above 98.54 with backwardation intact unlocks 99.85 and then the 101.69 to 101.91 confluence, while a decisive close beneath 94.42 negates the long case entirely and opens 93.11 with little structure until the 20-day average at 89.28. Weekend headline exposure is material: trade closes Friday at 5:00 PM ET and does not reopen until Sunday at 6:00 PM ET, roughly 49 hours of unhedged time against an unresolved maritime incident, and crude gaps on geopolitical developments more readily than the equity index contracts.
Friday is a headline session rather than a scheduled one, since the calendar carries no energy-specific release. The 14-day average true range is 3.60 dollars, or 3.70 percent of the settlement, and a one average-true-range day from 97.23 spans 93.63 to 100.83. Thursday's 3.37 dollar range sat just beneath that average despite containing a 3.41 percent drawdown and a full recovery, which is the clearest measure of how much two-way business this contract absorbs in a routine session.
Crude Oil (CL) Analysis, Key-Zones, Setup for Wed (Sep 16)Bias: October crude settled Tuesday at 105.83, up 4.44 dollars or 4.38 percent, after trading a 5.54 dollar session between 106.75 and 101.21 and closing in the top 17 percent of that range. The high is the headline, because 106.75 is also the published 52-week high, the 13-week high and the one-month high, so crude did not merely rally, it printed a new annual peak and held nearly all of it into the settle. This is the instrument driving the rest of the complex: the surge in crude is what lifted inflation expectations, pushed benchmark 10-year Treasury yields above 5 percent for the first time since 2007, firmed the dollar and pressured equities and gold. The supply story behind it is concrete rather than speculative. A crucial Saudi pipeline struck earlier this month will be mostly out of service for three to five weeks, the conflict involving Iran is described in trade commentary as now in its seventh month, and risk around the Strait of Hormuz has opened a price gap of more than 40 dollars between crude grades. Brent settled at 108.75 dollars, up 2.9 percent, and diesel settled at 5.2620 dollars a gallon, described as the highest on record, which is the clearest evidence that the tightness is physical rather than financial. The technical condition is a powerful confirmed uptrend that is also stretched. Price sits above every average on the board, from the 5-day at 102.93 to the 200-day at 74.18, and the contract is up 84.16 percent year to date. The 9-day directional index reads 51.64 with the positive directional indicator at 36.34 against a negative of 5.04, and the multi-indicator composite reads 100 percent buy at maximum strength, the strongest reading that indicator set produces. Against that, the 14-day stochastic percent K sits at 91.80, about as overbought as these readings get. Bias stays higher while above 102.30, favouring pullbacks into 103.40 to 104.60 rather than chasing the annual high, but the risk is scheduled rather than vague: industry data released after Tuesday's close showed a crude build of 7.1 million barrels against a 1.8 million draw forecast, and the official government figure lands at 10:30 AM ET.
Resistance:
- 113.52 Pivot R3, the outer boundary of the computed ladder, reachable only on a genuine supply escalation
- 110.14 Pivot R2, effectively paired with the 3 Standard Deviation Resistance at 109.99 to form a defined upper shelf
- 109.99 3 Standard Deviation Resistance, the practical ceiling for an ordinary trending session
- 109.23 2 Standard Deviation Resistance, the first genuinely extended objective above the ladder's first rung
- 108.23 1 Standard Deviation Resistance, sitting 0.25 above Pivot R1 so the two form a single band
- 107.98 Pivot R1, the primary upside objective for a continuation session, with the 14-day relative strength reference at 107.50 just beneath it
- 107.15 the computed upside objective from the same level set that produces the pivot ladder
- 106.75 the 52-week high and Tuesday's session high, the line separating continuation from failure, and with the annual high and session high being the same print there is no supply overhead above it within the year
Support:
- 105.63 the overnight session high, the immediate reference beneath the settle that a recovery must reclaim
- 104.69 the overnight session low, where the post-settle give-back found buyers
- 104.60 the computed Pivot Point, nine cents beneath that low, making 104.60 to 104.69 the session's first decision band
- 103.43 1 Standard Deviation Support, the lower edge of the preferred entry zone, with the 14-day stochastic stall reference at 103.84 just above
- 102.44 Pivot S1 with 2 Standard Deviation Support at 102.43 one cent away and the 14-day relative strength reference at 102.39 beneath, three independent methods inside five cents and the structural line for risk
- 101.67 3 Standard Deviation Support, the statistical extreme of the downside band
- 101.21 Tuesday's session low and the base of the expansion day, whose loss means the entire Tuesday advance has been given back
- 99.06 Pivot S2, the first level beneath the round 100 handle
- 96.90 Pivot S3, the outer boundary of the ladder, with the 38.2 percent retracement of the four-week span at 96.39 just beneath it
Primary Setup: LONG CL from the 103.40 to 104.60 zone on a pullback into the band running from the computed Pivot Point at 104.60 down to 1 Standard Deviation Support at 103.43. Stop 102.30, beneath the three-method confluence at Pivot S1 102.44, 2 Standard Deviation Support 102.43 and the relative strength reference 102.39, so that a stop-out requires losing all three together rather than tagging any one. Targets at 106.75 first, the 52-week high and Tuesday's session high, 107.98 second at Pivot R1 with the computed objective at 107.15 beneath it, and 110.14 third at Pivot R2 paired with 3 Standard Deviation Resistance at 109.99, taken only if a supply catalyst carries price through the second target on expanding volume. From a 104.00 entry midpoint that is 1.70 dollars of risk against 2.75, 3.98 and 6.14 dollars of reward, roughly 1.6 to 1, 2.3 to 1 and 3.6 to 1. Half size is appropriate and the reason is specific: government crude inventories land at 10:30 AM ET forecast at a 1.5 million barrel draw, while industry data released after Tuesday's close estimated a 7.1 million barrel build, so that print carries an unusually wide distribution, and the interest rate decision with its Summary of Economic Projections follows at 02:00 PM ET with the press conference at 02:30 PM ET. Pricing is likely to be disorderly between 02:00 PM and 02:45 PM ET. A sustained move beneath 102.30, and in particular a close beneath 101.21, negates the thesis and argues for the mirror trade toward 99.06.
One sizing note specific to this instrument. The 14-day average true range of 3.92 dollars is 3.74 percent of spot, roughly four times the equivalent percentage on the broad equity index, so crude is by a wide margin the most volatile instrument in this package and position size belongs to that percentage rather than to the apparent narrowness of a dollar-denominated stop. The October contract also expires within roughly a week, so anyone carrying risk past the roll should re-derive these levels on the November contract rather than transferring them across.
crudeoil breakout! will hit 10400-800 ya 9200?The structure is now clearly bullish, but RSI near 76 indicates short-term overbought conditions, so chasing the price at the current level can carry higher pullback risk
Key Technical Structure
Current Price: 9974
Immediate Resistance: 10050
Next Resistance: 10400
Major Resistance: 10800
Buy above 10,050 on sustained price action
sl: 9910
Target 1: 10200
Target 2: 10400--10800
bearish / rejection---
Avoid aggressive shorts while price remains above 9,840.
A bearish setup becomes stronger only if crude gives a daily close below 9,840.
Possible downside levels:
9,560- 9400 -9200+++
A rejection around 10,400 combined with bearish price action could produce a short-term correction, especially because RSI is already in the overbought zone.
over all summary --
The breakout is technically strong, but RSI ~76 means the market is stretched in the short term. Therefore, the higher-probability approach is to wait for either a confirmed breakout above 10,050 or a controlled pullback toward 9840, rather than chasing the current price
Mastering Stop Loss Placement in TradingA stop loss is often treated as a basic safety feature in trading.
In practice, it is one of the most decisive factors separating consistent traders from inconsistent ones.
Many traders focus heavily on finding the right entry, but overlook the role of risk management once a position is open. This gap is where performance usually plummets.
Poor stop placement doesn’t just lead to losses. It leads to unpredictable outcomes , where results vary not because of strategy quality, but because of inconsistent risk control.
📌 The Problem with Fixed Distances
Many traders set stops too close to their entry. While this limits the dollar amount lost per trade, it often results in being stopped out by normal market fluctuations. If a stop sits inside the typical noise zone, the trade is frequently closed before the intended move begins.
Stops placed too far away present the opposite risk. These levels often stem from a desire to avoid being wrong rather than a technical strategy. A single large loss from a stop that was stretched too far can erase the gains from multiple successful trades.
📌 Using Volatility to Set Realistic Levels
Market conditions should drive stop placement. Using the Average True Range (ATR) provides an objective measure of how much a security moves. When volatility is high, stops require more room. During quiet periods, they can be tighter.
A common technical approach involves setting a stop 1.5 to 2 times the ATR away from the entry price. This buffer ensures the position can withstand standard price fluctuations without triggering an exit.
📌 Avoiding Obvious Clusters
Retail stops tend to cluster at predictable levels.
Round numbers, recent swing highs, and clear support levels act as magnets for liquidity. Institutional players and algorithms often push prices toward these areas to trigger stops before a real move starts.
Avoid placing a stop exactly on a visible level. Adding a small buffer beyond support or resistance makes the position harder to target.
📌 Ways to Use Technical Analysis for Stops
Technical logic should dictate every stop. A stop is more effective when the market must break a meaningful structural level to reach it.
Swing High/Lows: Place stops a set distance beyond a significant price pivot.
Moving Averages: Stops can go beyond or under a key moving average used in your strategy.
Support/Resistance: Use structure from the chart, not just your entry price.
Trendlines/Channels: Stops outside trend channels last longer.
Check the higher timeframe: A stop that appears safe on a five-minute chart might be sitting right at a major breakout level on the hourly chart.
Example: You buy at $50 because price breaks above resistance. Price recently bounced at $49.10 twice (strong support), and ATR is 0.90. Instead of placing your stop at $49.80, a more resilient stop would be at $48.95 (support minus ATR buffer).
📌 The Risk-Reward Requirement
A stop only makes sense if the potential reward justifies the risk.
In general, traders should aim for a risk-reward ratio of at least 1:2. That means for every $1 you risk, you want at least $2 potential upside.
If the stop required by market structure makes the potential profit too small, the trade should be ignored.
Calculations should happen before the trade is placed. Adjusting a stop to "make the math work" after entering a position will lead to poor execution.
📌 The 7% Rule as a Safety Net
This rule suggests closing a position if it drops 7% below the purchase price. It serves as an absolute ceiling to prevent catastrophic account damage.
While useful for long-term equity traders, it should be viewed as a secondary backup to stops based on volatility and technical structure.
📌 Final Thoughts
Effective stop loss placement is not about avoiding losses, it's about controlling them with precision and consistency. The difference between disciplined risk management and repeated setbacks often comes down to why and where a stop is placed, not simply whether one exists.
Three principles should remain central:
Let market conditions dictate your stop, not arbitrary numbers.
Protect capital first, even if it means missing trades that don’t meet your criteria.
Maintain consistency, as the edge is built over a series of trades.
Refine your risk management approach, review your last 10 trades, and identify whether your stops were placed by strategy or by instinct.
– Team Plus500
📌 Disclaimer
IMPORTANT: Trading in futures and options carries substantial risk of loss and is not suitable for every investor. The valuation of futures and options contracts may fluctuate rapidly and unpredictably, and, as a result, clients may lose more than their original investments. In no event should the content of this website be construed as an express or implied promise or guarantee by or from Plus500US Financial Services LLC that you will profit or that losses can or will be limited in any manner whatsoever. Market volatility, trade volume, and system availability may delay account access and trade executions. Past results are no indication of future performance. Information provided in this correspondence is intended solely for informational purposes and is obtained from sources believed to be reliable. Information is in no way guaranteed. The trading of futures is available through Plus500US Financial Services LLC d/b/a Plus500, a Futures Commission Merchant registered with the US Commodity Futures Trading Commission and a member of the National Futures Association (NFA ID number 0001398). Plus500US Financial Services LLC is a wholly-owned subsidiary of Plus500US Inc. Trading privileges subject to review and approval. Not all applicants will qualify. Information collected on account applications will be used to verify an applicant’s identity, as required under Federal law.
WTI Crude Oil Futures — Technical AnalysisTimeframe: 1D | NYMEX
🔹 Market Structure
WTI has developed a major bullish reversal structure after a prolonged decline from the 2023–2025 highs.
The chart shows:
A long-term descending trendline acting as major resistance.
Strong accumulation/reversal from the $67–70 region.
Price subsequently formed a higher-low structure and pushed back toward the $87–85 breakout/retest zone.
Current price around $91.64 is testing the immediate resistance area and the descending purple trendline.
🎯 LONG SETUP
Preferred Entry: $87–85
This zone is important because it represents the previous breakout/support area. A successful retest and bullish reaction would strengthen the continuation setup.
Stop Loss: $75
A daily breakdown and sustained close below $75 would significantly weaken the bullish structure and invalidate the setup.
🚀 Upside Targets
Target Zone Potential
T1 $119.76 – $122.85 Major resistance / primary target
T2 $135.00 – $139.29 Major historical supply
T3 $144.20 – $147.20 Extended bullish target
📐 Risk/Reward
Using approximately $86 as the average entry:
Risk to $75 = ~$11
T1 midpoint ≈ $121.3 → ~3.2R
T2 midpoint ≈ $137.1 → ~4.6R
T3 midpoint ≈ $145.7 → ~5.4R
That provides an attractive asymmetric setup if the $85–87 retest holds.
⚠️ Critical Levels
$100.93 – $102.44 → First major resistance zone.
A decisive daily breakout above this area would substantially increase the probability of a move toward $119.76–122.85.
$117.49 → Intermediate resistance before T1.
$85–87 → Key bullish support / entry zone.
$75 → Structural invalidation.
📈 Bullish Scenario
If WTI maintains above $85–87, breaks the descending trendline, and then confirms above $100.93–102.44, the market could enter a much stronger bullish expansion:
$102 → $110.93 → $117.49 → $119.76–122.85 → $135–139 → $144–147
The $119–123 region is the major decision zone. A clean weekly breakout above it would open the door toward the higher targets.
🔻 Bearish Alternative
Failure to hold $85 followed by a breakdown of the structure would increase the probability of a deeper correction toward $75. A sustained break below $75 invalidates the bullish setup shown on this chart.
🧠 TradingView Conclusion
WTI remains structurally bullish above $85–87, but the current price is already above the preferred entry zone. The higher-probability strategy is to wait for a pullback/retest rather than chase the move. A confirmed breakout above $100.93–102.44 would provide the strongest momentum confirmation, with $119.76–122.85 as the first major objective and $135–147 as the extended bullish path.
Bias: 🟢 BULLISH above $85 | Strong confirmation above $102.44 | Invalidation below $75
Crude Oil Mini — Swing Trading Study3-Hour Chart | MCX
This chart shows a good example of how a swing setup can take time to develop.
The BTR Buy Signal appeared around the 7,800–7,900 zone after price had declined toward the lower levels. From there, the market gradually built a higher structure and continued moving upward.
📊 Setup Reference
🟢 BTR Buy Signal: ~7,900
🛑 SL / Invalidation Reference: 7,603
🎯 T1: 8,664
🎯 T2: 9,194
🎯 T3: 9,774
Current price in the chart is around 9,079, meaning the move has already progressed well beyond T1 and is approaching the T2 reference zone.
🧠 The real swing-trading lesson
Notice what happened after the Buy Signal.
Price did not move directly toward the targets.
There were:
• Consolidation phases
• Pullbacks
• Small corrections
• Periods where the market appeared uncertain
But the broader move continued to develop.
This is where patience matters.
A swing trader doesn't necessarily need to react to every candle. The focus can remain on whether the original setup is still structurally valid.
The framework is simple:
Setup → Risk level → Potential targets → Patience → Review
And once price has already moved significantly, another important discipline comes in:
Don't confuse a successful setup with a reason to chase the current price.
The opportunity and the current market price are two different things.
🔎 One more observation
The chart shows a predefined SL at 7,603 and three potential upside reference levels. This creates a framework for managing uncertainty rather than trying to predict every intermediate movement.
The indicator is simply a tool to help organize the technical study. It cannot guarantee that any target will be reached, and no setup is free from market risk.
Trading isn't about catching every move.
It's about having a process and having the patience to let the process work.
📌 This chart is shared for educational and technical-study purposes only. It is not investment advice, a buy/sell recommendation, or an assurance of returns. Trading derivatives involves substantial risk.
ENERGY 5: Four Oils Are One Bet, Gas Is Its OwnFirst, four rules.
1. The market is always right.
2. Every price is already set.
3. Every view is a quantum view — stay flexible, keep every state open.
4. All evolution comes through repetition.
Five energy contracts in one place: crude oil, Brent, heating oil, gasoline and natural gas.
Prices are as of the **September 10, 2026 settlement**. All times below are Eastern.
Two things before the numbers.
**These are levels I'm watching. They are not instructions to buy or sell.**
And this is a **medium- to long-term** view. Not days. Months, and possibly longer.
Rule three, applied honestly: **the levels I've written down may never get there.** The probability is open in both directions.
===================================
CRUDE OIL · CL1!
===================================
```
Last 103.88
Watching above
107.68 +3.7%
Watching below
102.35 −1.5%
97.88 −5.8%
93.10 −10.4%
85.47 −17.7%
65.00 −37.4%
```
===================================
BRENT · BR1!
===================================
```
Last 106.86
```
I'm not setting separate levels for Brent. Read it off crude oil. The reason is in section ① below.
===================================
HEATING OIL · HO1!
===================================
```
Last 5.1429
Watching below
2.7646 −46.2%
```
===================================
GASOLINE · RB1!
===================================
```
Last 3.4332
Watching below
2.7479 −20.0%
2.5823 −24.8%
2.1204 −38.2%
1.8914 −44.9%
```
===================================
NATURAL GAS · NG1!
===================================
```
Last 2.8400
Watching above
3.148 +10.9%
```
The only one of the five I'm watching to the upside.
===================================
① Five contracts is not five decisions
===================================
This is the part I think will help most.
I pulled eleven years of daily bars for all five, converted them to weekly returns, and counted how closely they moved together. April 2015 through September 2026 — 440 weeks.
```
Crude ↔ Brent +0.908
Crude ↔ Heating oil +0.845
Crude ↔ Gasoline +0.807
Brent ↔ Heating oil +0.776
Gasoline ↔ Heating +0.736
```
The closer to 1, the more they are the same thing. **The four oils sit between 0.74 and 0.91. They are effectively one market.**
So if you spread across crude, Brent, heating oil and gasoline, you hold four tickers and **one decision**. It looks like diversification. It isn't. When it's wrong, all four are wrong together — you haven't reduced the risk, you've multiplied the size by four.
Watching together and holding together are opposites. **Watching together confirms. Holding together concentrates.**
===================================
② You cannot read natural gas off crude
===================================
Same method, run on natural gas.
```
Gas ↔ Heating oil +0.164
Gas ↔ Crude +0.123
Gas ↔ Brent +0.112
Gas ↔ Gasoline +0.093
```
**Around 0.1 against every one of the four oils.** They share the word "energy" and not much else.
"Oil is up, so gas should follow" feels natural. Eleven years of data says otherwise. However long you stare at a crude chart, it tells you about a tenth of what you'd need to know about gas.
Gas has to be judged on gas.
===================================
③ Reaching a level and capturing it are different things
===================================
Given enough time, most levels get touched. Markets keep moving.
The problem is **sequence**. On the way up you may hit the downside first, or the other way round. Get the direction right and the order wrong, and you're not there when it arrives.
So "it will probably get there" and "I can capture it" are two different statements. Choosing the level matters less than **building a position that can survive the path to it.**
===================================
④ Holding for months means rolling the contract
===================================
All five are futures. If you're thinking in months, this section matters more than the levels.
**Futures expire.** You cannot simply hold them the way you hold a stock. To stay in a position past expiry you have to roll. In practice, two ways:
```
① Enter the next month alongside
Open the deferred month while closing the front month.
② Close before the front month expires, then re-enter
Exit ahead of expiry, then open the next month.
```
Done this way, you can run a position for months, close to the way you'd hold a stock.
It isn't free. **The contract months trade at different prices.** Every roll can go in your favour or against you. Stack enough rolls and the difference shows up clearly in the result.
That's why a chart can be flat while the account is down. **The price on the chart and the result in the account are not the same number.**
The same applies to averaging down. It works on the spot market. On futures, a cost is inserted at every roll — the longer you do it, the worse it gets.
===================================
⑤ Have three to five scenarios before you enter
===================================
This is the most practical thing here.
**If it goes the way you saw it, you run your plan. If it goes the other way, you need a different plan.** Working out that other plan *after* the market turns is too late — what comes out then isn't judgment, it's reaction.
So write them down beforehand. Three at minimum, five if you can.
```
Plan A It goes as expected → run the original plan
Plan B It stalls and goes sideways → decide in advance: wait, or step aside
Plan C It goes against you, shallow → cut size, look again
Plan D It goes against you, deep → the view is wrong. Close it. Don't hold on
Plan E Something unforeseen hits → reduce first, sit out until it settles
```
Do you really need all five? **Yes.** Markets don't only arrive as A or D. Most of the time they arrive as B and C — and B and C are where unprepared traders take the worst damage, because sitting through a market that goes neither up nor down is exactly when people start forcing trades.
**What matters isn't prediction, it's flexibility.** Not holding one view and waiting for the market to agree with it, but having a response ready wherever it goes.
That's what rule three means. Keeping every state open requires having an answer prepared for each one.
===================================
⑥ When it goes against the view, not forcing it comes first
===================================
The market can move against the levels above. On a medium- to long-term view, that stretch can last a while.
What matters then is not being right — it's **still being there**. If the view looks wrong, don't push harder. Cut the size, or step aside. The market stays open and the opportunities keep coming. **You only need to avoid the one loss that ends it.**
===================================
⑦ The setup I consider most favourable
===================================
Everything above is about protection. This part is about compounding.
The shape I consider most favourable looks like this.
```
Precondition The full-size position is up 50–100%+ on margin
↓
Then You are trading from a position of psychological advantage
↓
Operation Use mini and micro contracts to adjust both ways
Add with mini/micro if the trend extends
```
**The order is the whole point.** The profit has to come first.
Once you're up 50–100% on margin, the decisions themselves change. A move against you no longer threatens the account, so you can read the market as it is. **Judgment made while under pressure and judgment made without it are not the same quality of judgment.** The same chart produces a different conclusion.
Only after that cushion exists do you bring in the **smaller contracts**. The same products list side by side in different sizes.
```
Crude oil Full CL1! · Mini QM1! · Micro MCL1!
Natural gas Full NG1! · Mini QG1! · Micro MNG1!
```
The mini is roughly half the full contract; the micro about a tenth. Because the size is small, you can adjust in either direction, and being wrong doesn't take a large bite out of what you've already banked.
If the trend extends, you add in small increments. Scaling a full-size position in one step and scaling with small contracts are **completely different risk shapes**. Same direction, but one settles in a single move while the other leaves room to adjust repeatedly.
**Now the reverse case, stated plainly.**
Used while you're losing, this method does the exact opposite. Adding small contracts into a losing position is averaging down — and on futures, section ④ applies on top of it: a cost at every roll.
**Mini and micro are tools for reducing size, not tools for pressing harder.** Flip that one sentence and the same method runs precisely backwards.
Put simply: **bank it first, then compound it.** Reverse the order and none of it holds.
===================================
⑧ There is no floor underneath
===================================
The downside levels above are lines I drew. They are not places the market has agreed to stop.
On April 20, 2020, WTI crude futures settled at **minus $37.63**. That was a day when zero turned out not to be the floor.
I'm not saying these go to zero. I'm saying **the assumption that zero is the limit has never actually been verified.**
===================================
Count it yourself
===================================
The correlation figures above need no special tools. Pull daily bars, convert to weekly returns, line up two contracts and count. Any market will do.
Counting it yourself changes three things.
One, you stop taking someone else's target on faith. "Where did that number come from" becomes the first question.
Two, you start recognising people who show one side only. If someone gives you the upside and no downside figure, that isn't a calculation.
Three, you start recognising a list of tickers being sold as diversification. Measure the correlation and you'll see immediately whether it's four positions or one.
That alone removes a lot of opportunities to be taken in.
===================================
Closing
===================================
To say it once more: this is a **medium- to long-term view**. The levels above are **not a settled future**. They may never get there, and the market may go the other way. Every probability is open.
What to do with any of it is yours to decide. It isn't mine to decide, and it shouldn't be. Count it yourself, and judge for yourself.
Educational record only. Not a recommendation to buy or sell.
OIL in the Danger ZoneLight crude oil prices have surged dramatically since reaching their summer lows in the $60 range, climbing more than 50% and pushing back into the psychologically significant $100 region. Continued uncertainty surrounding peace in the Middle East, broader geopolitical tensions, elevated yields, and questions surrounding Federal Reserve credibility have all contributed to renewed strength across commodities.
After such an aggressive move higher, however, could oil finally be approaching a major technical inflection point above $100?
I have become increasingly interested in the possibility of a short position in oil and related industries as crude crossed above the $100 level. While the macro environment remains supportive of elevated commodity prices, there are several technical and behavioral factors that make the current area particularly interesting.
1. The Psychological Importance of $100
Large psychological levels such as $100 can often become important areas for both new positioning and profit taking. Investors and institutions that accumulated oil near the July lows are now sitting on substantial gains following a move of more than 50%.
As price moves into the $100 region, some of these participants may begin reducing exposure or protecting profits rather than continuing to aggressively add to positions. At the same time, traders looking to establish bearish positions may view the psychological level as an attractive area to begin building exposure.
This does not necessarily mean that $100 will mark the exact top. Oil could certainly overshoot the level before reversing. However, after such a significant advance, the combination of a major psychological price level and substantial unrealized profits creates an area where the balance between buyers and sellers could begin to shift.
2. A Potential ABC Correction Near Completion
From a technical perspective, I believe we may also be seeing the completion of a classic ABC corrective structure.
One of the more interesting aspects of the current move is that the secondary advance is approaching the 1:1 Fibonacci extension of the initial move higher. In other words, the magnitude of the second major advance is becoming similar to that of the first. This type of measured move can represent a natural area for momentum to weaken and for a corrective structure to reach completion.
If the current advance does represent the final stage of an ABC move, the implications could be significant. A rejection from this region could eventually begin a much larger rotation back through the previous range, with the original $60 area representing the most aggressive downside scenario.
I would not expect that move to occur in a straight line, nor would I assume that reaching the 1:1 extension automatically confirms a top. Instead, I am looking for evidence from price action that the advance is actually beginning to weaken. A failure to maintain prices above $100, followed by the loss of important support levels, would provide significantly more confirmation that the structure is beginning to reverse.
3. Oil's Volatility and the Economic Pressure of Higher Prices
Oil is naturally a highly volatile market, and extended moves in either direction can eventually produce aggressive mean reversion. We have already seen this characteristic over the past several months, with crude moving through an exceptionally wide range and experiencing swings exceeding 50%.
There is also an important economic feedback mechanism that develops as oil prices rise. Extremely high energy prices can slow economic activity, pressure margins across energy intensive industries, increase transportation and production costs, and make inflation considerably more difficult to control.
Recent inflation data has continued to highlight the importance of energy prices within the broader inflation picture. If elevated oil prices begin contributing meaningfully to renewed inflationary pressure, policymakers may face increasing pressure to respond. At the same time, persistently high prices can eventually reduce demand on their own as consumers and businesses adjust their behavior.
This creates an interesting dynamic. Some of the same conditions responsible for pushing oil dramatically higher can eventually create the economic forces necessary to slow demand and bring the market back toward equilibrium.
The Setup Going Forward
Overall, I want to focus primarily on the technical structure of the current price action rather than attempting to predict geopolitical or macroeconomic developments. Those variables are extremely difficult to forecast and can change the outlook for oil almost overnight.
Instead, my primary focus is on how price behaves around the $100 region.
We have an asset that has rallied more than 50% from its summer lows, reached a major psychological level, and is approaching an important measured Fibonacci extension. Combined with the naturally volatile and mean reverting characteristics of the oil market, I believe this creates an interesting area to begin watching for signs of exhaustion.
The macro environment remains important, but I view it primarily as supporting context rather than the basis of the trade. If price begins following the technical trajectory I am anticipating, developments in inflation, monetary policy, geopolitical tensions, and global demand can provide additional clarity and help determine whether the move is developing into a temporary pullback or something considerably larger.
For now, $100 is the key battleground. I am not necessarily trying to predict the exact top. I am looking for confirmation that the buyers who drove this move are beginning to lose control.
If that confirmation appears, the potential downside could be substantial.
WTI Crude Oil (USOIL): Bearish Structure Remains IntactWTI Crude Oil continues to trade within a descending channel, printing a clear sequence of lower highs and lower lows on the medium-term timeframe. Recent attempts to reclaim key resistance have been rejected, keeping sellers firmly in control of the broader structure.
From a fundamental standpoint, persistent concerns over global oversupply, rising inventory builds, and softer-than-expected demand continue to weigh on price. As long as WTI fails to reclaim on strong volume, the path of least resistance remains to the downside.
Key levels to watch:
Resistance:
Support targets: and if the downtrend extends
A confirmed break and hold above resistance would invalidate this bearish bias.
⚠️ This is a personal technical view, not financial advice. Always manage your risk and use a stop loss.
If you tell me your actual resistance/support levels and timeframe, I can plug in real numbers so it's ready to post.
OIL: It Is Bad!Over the weekend, Brent and WTI futures prices initially surged again, but the rally lost steam before reaching new local highs.
Primary Scenario
WTI futures are expected to continue their broader corrective uptrends and eventually break above resistance at $119.48. After these peaks, we anticipate a sharp sell-off into our blue Long-Term Entry Range ($49.85–$27.93), where the ongoing long-term correction should ultimately conclude.
Alternative Scenario
Alternatively, WTI futures could fall below support at $54.98 sooner, forming early corrective lows within our blue Long-Term Entry Range($49.85–$27.93) (probability: 31%).
Trading Craft 101 · Lesson 05 — The Journal🔵 THE UNUSED EDGE
Most traders collect setups, not data. They can tell you the pattern they trade, but not their own win rate, average R, or biggest losing streak. Their edge exists — and they have no idea what it is. The journal is the tool that fixes that.
🔵 WHAT TO RECORD
Every trade: the setup (which pattern, which timeframe), entry and exit, the R-multiple, the reason in one sentence, the emotions in one word (calm, greedy, bored, revenge). The emotions column matters more than it looks — it is the only column that predicts the next mistake.
🔵 THE WEEKLY REVIEW
Once a week, answer three questions from the journal, not from memory: which setup made money, which one lost, and which trade violated the plan? The third question is the gold: plan violations are the only losses you control. Process errors are the leak; the journal finds it.
🔵 THE NUMBERS THAT MATTER
Track three numbers over rolling samples: win rate, average R per trade, and max losing streak. Win rate alone lies — 40% win rate at +2R average is a great system. The combination is the truth, and it only exists in the journal.
Next lesson: psychology — why discipline is not a personality trait but a system.
Educational content only. Not investment advice.
Crude Oil at Critical Resistance: Downside Move Ahead?Resistance-Based Downside Setup
The stock is currently approaching a major resistance/supply zone around ₹10,300–₹10,500. From a technical-analysis perspective, this area is critical because the price is trading close to the upper resistance structure and may face selling pressure if it fails to sustain above the zone.
Key Technical Rationale
Major Resistance Zone
₹10,300–₹10,500 represents an important overhead resistance area. Failure to sustain above this zone could result in profit booking and a corrective move.
Trendline Resistance
The upper red trendline continues to act as a significant resistance barrier. A rejection from this trendline would strengthen the downside setup.
Downside Levels
If bearish confirmation develops from the resistance zone, the next important downside levels to monitor are:
₹9,000 – First Downside Objective
₹8,500 – Extended Downside Objective
View
The setup should be approached through price confirmation rather than prediction. A bearish reversal/rejection near resistance, followed by weakness below the recent swing structure, would provide stronger confirmation for the downside thesis.
Trade Structure
Resistance: ₹10,300–₹10,500
Downside Objective 1: ₹9,000
Downside Objective 2: ₹8,500
Invalidation: Sustained breakout and acceptance above the resistance zone
Technical Bias: BEARISH BELOW RESISTANCE
The key thesis is a potential rejection from ₹10,300–₹10,500, with ₹9,000 and ₹8,500 as the major downside levels to monitor.