A steep slide for Crude this week1. Status
• A sell-off into Thursday got Crude sharply down over 12% on the week
• This after a slow grind up in an overall sideways regime since September
2. DPVA Analysis
• Next resistance $96.5, broadly the range mid-point
• Further $86 - 84 has technical support
Next Resistance:
- 1st $91.75
Peers for comparison
Contract highlights
Crude Oil (CL) Analysis, Key-Zones, Setup for Tue (Nov 10)Bias: The December crude contract settled at 86.85 on Monday, down 3.98 or 4.38 percent, its lowest settle since 09/04/26. The session traded between 91.42 and 85.02, a lower high and a lower low against Friday, and the 6.40 point range was the widest since 11/04/26. The high printed in the 10:00 P
CL at a critical junction - Are we seeing a diamond reversal??www.tradingview.com
NYMEX:CL1! Crude oil has been on a bull run since October 10th, on the low inventory data and the anticipation of further escalation in the war. We have now reached a critical junction, where the bull run seem to take a breather and consolidate.
The HH and HL pattern was bro
Crude Oil Is Turning Bearish; More Weakness After Rally Crude oil has seen a pretty strong selloff, mainly driven by easing tensions between the US and Iran. Trump signaled that further military strikes against Iran are unlikely for now, reducing fears of supply disruptions through the Strait of Hormuz. Higher OPEC production is also adding pressure to o
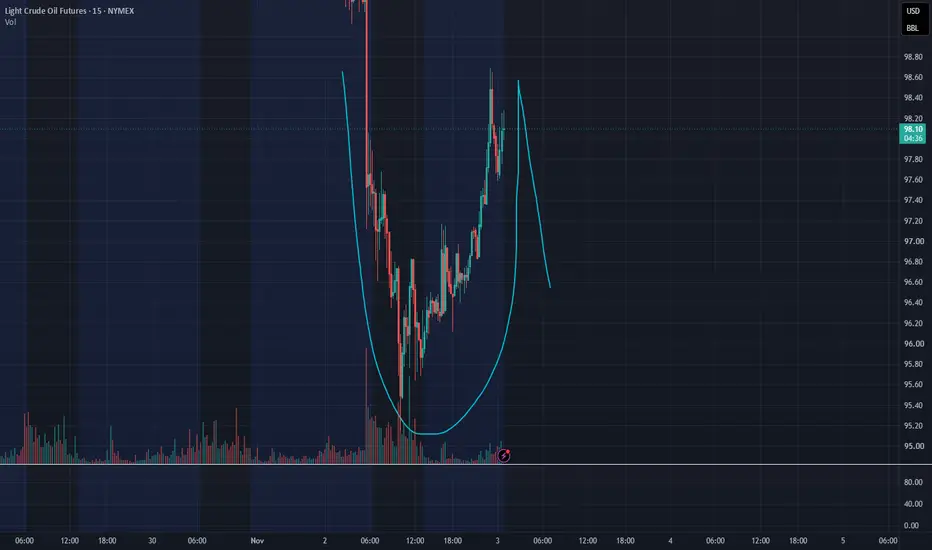
cup and handle patternI can see a cup and handle pattern what i have notice in the past this pattern form and watch it fail miserably. I believe they are manipulating market to form this pattern and squeeze people heavy, I know it suppose to be bullish but I watched from all markets CL, NQ, GC form this pattern and fail
MCL Breakdown: Macro Trendline Snapped, Crucial Support TestThe Micro Crude Oil Futures (MCL) market is currently shifting into a critical "wait-and-see" phase after a highly aggressive bearish expansion. Price action has decisively broken below a major, long-term ascending trendline that has anchored this market since July 2nd, with subsequent structural va
Crude Oil Futures(MCX) - Bearish Outlook From Channel ResistanceCrude Oil remains under pressure after rejecting from a significant resistance region near 9,850-9,880, which aligns with the upper boundary of the ascending channel.
From a technical perspective, price is currently approaching an important support zone around 9,500-9,550. This area may attract buy
CL breaks out with a potential cup and handle pattern!!Crude oil has been consolidating in the current week (19-22 October). The crude price broke out of the consolidation on 23rd October (Friday) session with volume and momentum.
The bull run that started on 6th October ($87) seems to have formed a cup and handle pattern and the price pulled back aggr
Crude Oil Futures: A Quick History Lesson for TradersOil futures tell one of the most interesting stories in markets. Oil has repeatedly collapsed, surged, and reset over the last 100 years. Oil futures have even gone below zero… and also traded above $200. If you’re going to trade crude oil, it makes sense to have a deep understanding of risk managem
See all ideas
A representation of what an asset is worth today and what the market thinks it will be worth in the future.
Displays a symbol's price movements over previous years to identify recurring trends.
Frequently asked questions
One way to gain exposure to CLU2017 is through a broker that offers futures. Before trading, make sure you understand how the product works and the risks involved.
You can trade CLU2017 directly from TradingView:
– Choose a broker: Explore our supported trading partners and pick one that fits your needs
– Compare options: View available brokers side by side to evaluate fees and features
– Connect your account: Open Supercharts, click "Trade", select your broker, and log in
– Start trading: Place orders directly from the chart
Tip: If you're new to trading, try paper trading first — it lets you practice strategies in real market conditions without risking funds.
You can trade CLU2017 directly from TradingView:
– Choose a broker: Explore our supported trading partners and pick one that fits your needs
– Compare options: View available brokers side by side to evaluate fees and features
– Connect your account: Open Supercharts, click "Trade", select your broker, and log in
– Start trading: Place orders directly from the chart
Tip: If you're new to trading, try paper trading first — it lets you practice strategies in real market conditions without risking funds.
The nearest expiration date for CLU2017 is Aug 22, 2017.
Futures contracts expire on predetermined dates. As expiration approaches, many traders roll positions into the next contract to maintain exposure to the market.
Key metrics to watch near expiration:
• Volume and liquidity: Trading activity often shifts to the next contract month
• Open interest: Falling open interest may signal positions being closed or rolled forward
• Forward curve: Differences between contract prices can help identify market structure, including contango and backwardation
Explore the CLU2017 chart to monitor active contracts and contract-month activity.
Futures contracts expire on predetermined dates. As expiration approaches, many traders roll positions into the next contract to maintain exposure to the market.
Key metrics to watch near expiration:
• Volume and liquidity: Trading activity often shifts to the next contract month
• Open interest: Falling open interest may signal positions being closed or rolled forward
• Forward curve: Differences between contract prices can help identify market structure, including contango and backwardation
Explore the CLU2017 chart to monitor active contracts and contract-month activity.