Crude Oil at Daily Support: Weak Bounce Could Set Up Deeper CorrCrude oil’s price action is complex right now. The market has been rejected from the $105 monthly resistance, a major high time frame level that has capped upside attempts. Since that rejection, price has been moving lower toward daily support.
This daily support lines up with the 0.618 Fibonacci r
Peers for comparison
Contract highlights
Every data series is a chewed up and spat out representationThere are currently a great many traders searching for the holy grail of data, measuring “absorption”, “aggressiveness”, “depth” and an infinity of variables to gain an edge over the market. That can be useful or even vital, but at the same time we have to recognize the real limitations of informati
Trading Methodology: Structure, Volume & Order FlowAbout My Experience:
With over 5 years of hands-on experience in global financial markets, my approach to trading goes beyond traditional retail indicators. My entire methodology is built on reading actual market liquidity and institutional footprints using advanced Volume Profile and Order Flow dyn
WTI loses 83.88 floor: lowest close since 28 Aug at 83.83WTI crude is trading at 83.83 on the daily chart, down 2.53% on the day from a 86.01 close. Today's low of 83.82 is a new 20-day low. If it holds into the close, it is also the lowest close since 28 Aug.
What happened
• The 15-day box floor at 83.88 gave way. That level is the 10 Nov low and has no
Crude Oil (CL) Analysis, Key-Zones, Setup for Thu (Nov 12)Bias: The December crude contract settled at 86.53 on Wednesday, up 0.49 or 0.57 percent, its first higher settle after two lower settles. The session traded between 88.74 and 85.81, a higher high and a higher low against Tuesday, and the 2.93 point range was the narrowest since 10/30/26. The low p
Crude Oil: Sharp Sell-Off May Be Part of a Larger ABC CorrectionCrude oil is experiencing a sharp sell-off following its recent rally, but the current decline may still be part of a larger corrective structure rather than a complete trend reversal. The price action over the last few days looks impulsive, suggesting that wave A of a higher-degree ABC correction m
WTI -8.67% in 20 days: 83.88 low holds, 87.39 lidWTI crude is up 0.94% today at 86.85 (daily candle, still moving) after a rough stretch. It is down 8.67% in 20 days and 1.44% in 5 sessions. It sits 10.25% under the 21 MA at 96.77 and 9.03% under the 50 MA at 95.47.
What happened
• Yesterday price pushed through the 85.02 floor and printed 83.88,
Crude Oil Is Turning Bearish; More Weakness After Rally Crude oil has seen a pretty strong selloff, mainly driven by easing tensions between the US and Iran. Trump signaled that further military strikes against Iran are unlikely for now, reducing fears of supply disruptions through the Strait of Hormuz. Higher OPEC production is also adding pressure to o
Crude Oil (CL) Analysis, Key-Zones, Setup for Wed (Nov 11)Bias: The December crude contract settled at 86.04 on Tuesday, down 0.81 or 0.93 percent, its lowest settle since 09/04/26 and a second consecutive lower settle. The session traded between 86.93 and 83.88, a lower high and a lower low against Monday, and the 3.05 point range was the narrowest since
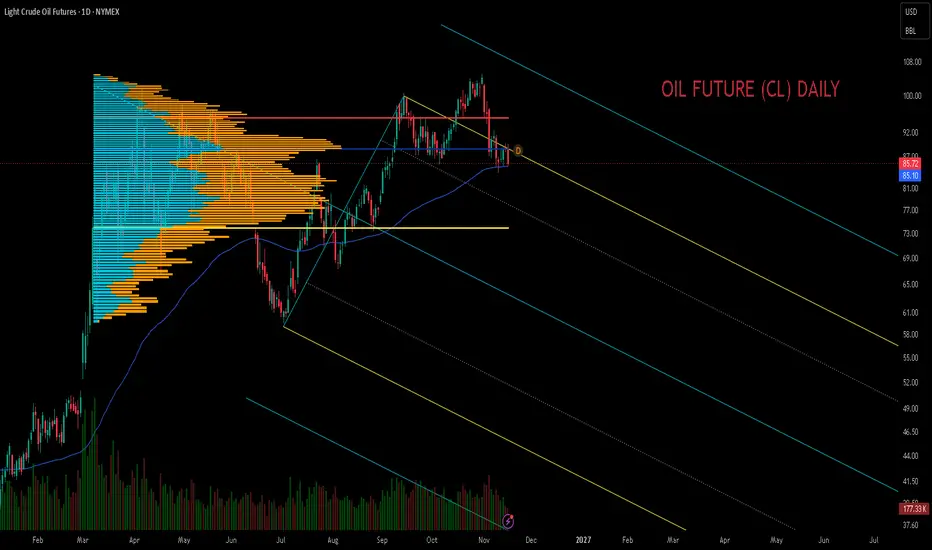
A steep slide for Crude this week1. Status
• A sell-off into Thursday got Crude sharply down over 12% on the week
• This after a slow grind up in an overall sideways regime since September
2. DPVA Analysis
• Next resistance $96.5, broadly the range mid-point
• Further $86 - 84 has technical support
Next Resistance:
- 1st $91.75
See all ideas
A representation of what an asset is worth today and what the market thinks it will be worth in the future.
Displays a symbol's price movements over previous years to identify recurring trends.
Frequently asked questions
One way to gain exposure to CLV2015 is through a broker that offers futures. Before trading, make sure you understand how the product works and the risks involved.
You can trade CLV2015 directly from TradingView:
– Choose a broker: Explore our supported trading partners and pick one that fits your needs
– Compare options: View available brokers side by side to evaluate fees and features
– Connect your account: Open Supercharts, click "Trade", select your broker, and log in
– Start trading: Place orders directly from the chart
Tip: If you're new to trading, try paper trading first — it lets you practice strategies in real market conditions without risking funds.
You can trade CLV2015 directly from TradingView:
– Choose a broker: Explore our supported trading partners and pick one that fits your needs
– Compare options: View available brokers side by side to evaluate fees and features
– Connect your account: Open Supercharts, click "Trade", select your broker, and log in
– Start trading: Place orders directly from the chart
Tip: If you're new to trading, try paper trading first — it lets you practice strategies in real market conditions without risking funds.
The nearest expiration date for CLV2015 is Sep 22, 2015.
Futures contracts expire on predetermined dates. As expiration approaches, many traders roll positions into the next contract to maintain exposure to the market.
Key metrics to watch near expiration:
• Volume and liquidity: Trading activity often shifts to the next contract month
• Open interest: Falling open interest may signal positions being closed or rolled forward
• Forward curve: Differences between contract prices can help identify market structure, including contango and backwardation
Explore the CLV2015 chart to monitor active contracts and contract-month activity.
Futures contracts expire on predetermined dates. As expiration approaches, many traders roll positions into the next contract to maintain exposure to the market.
Key metrics to watch near expiration:
• Volume and liquidity: Trading activity often shifts to the next contract month
• Open interest: Falling open interest may signal positions being closed or rolled forward
• Forward curve: Differences between contract prices can help identify market structure, including contango and backwardation
Explore the CLV2015 chart to monitor active contracts and contract-month activity.