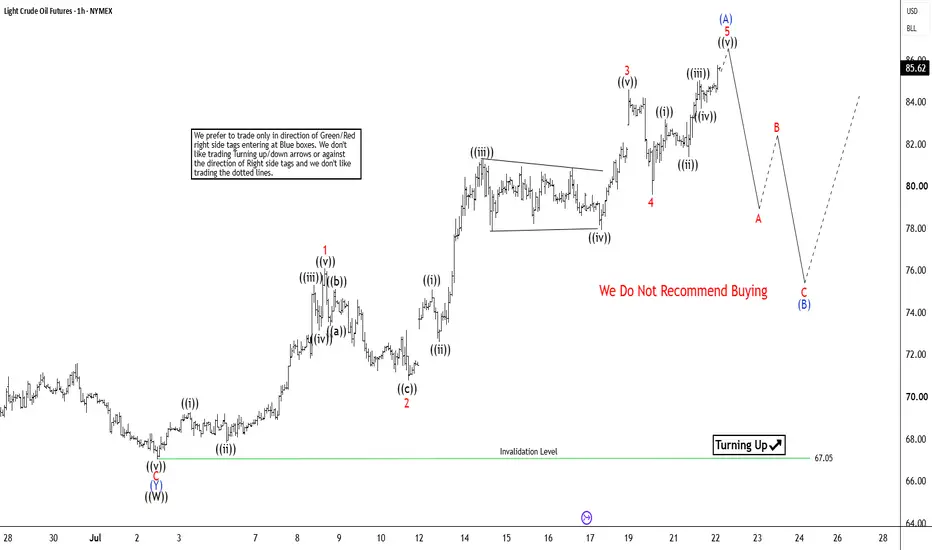
WTI Crude Oil (CL) 5‑Swing Rally from July Low Favors ExtensionThe short-term Elliott Wave outlook in WTI Crude Oil (CL) presents a well-defined impulsive rally from the July 2, 2026 low, with prospects for continued strength. From that low, wave 1 advanced to $76.08, followed by a corrective decline in wave 2 that ended at $70.77. The market then surged in wave 3, reaching $85.39, before retracing in wave 4, which concluded at $80.27. The final leg, wave 5, is now unfolding and is expected to complete shortly. This completion will mark the end of wave (A) in higher degree.
Once the five-wave rally is complete, a larger corrective phase in wave (B) should emerge. This correction will retrace the cycle that began from the July 2 low, allowing the market to consolidate gains before resuming its broader upward trajectory. As long as the pivot at $67.05, established on July 2, remains intact, pullbacks are likely to attract buyers. These retracements should occur in either three or seven swings, reinforcing the bullish outlook for further upside.
The completed five-wave structure from the July 2 low strongly favors at least one more leg higher. This extension is expected to unfold within wave (C) or wave (3), both of which imply continuation of the impulsive sequence. With the technical framework pointing toward additional gains, the near-term outlook remains constructive, and the market appears poised for further upward momentum.
In-depth trading ideas
Can CL Sell off to Fibonacci Extension? -4,614 Ticks to targetCL Daily time frame is in a down trend. The market
is making lower lows and lower highs. There is a
down Fibonacci with an extension price point 42.38
about -4,614 ticks below the market. As long as the
market does not take out the one boundary price
point 110.93 it is expected the market to fall towards
the Fibonacci target.
Entry: Counter trend line break bearish in the sell zone.
STOP: 113.05
LIMIT: 42.38
Another entry idea: If the risk is too large off the daily
time frame. It will be a good idea to turn to the smaller
time frames and look for selling ideas with less risk.
THE OIL ! Job 12:8 — "Or speak to the earth, and it shall teach thee: and the fishes of the sea shall declare unto thee."
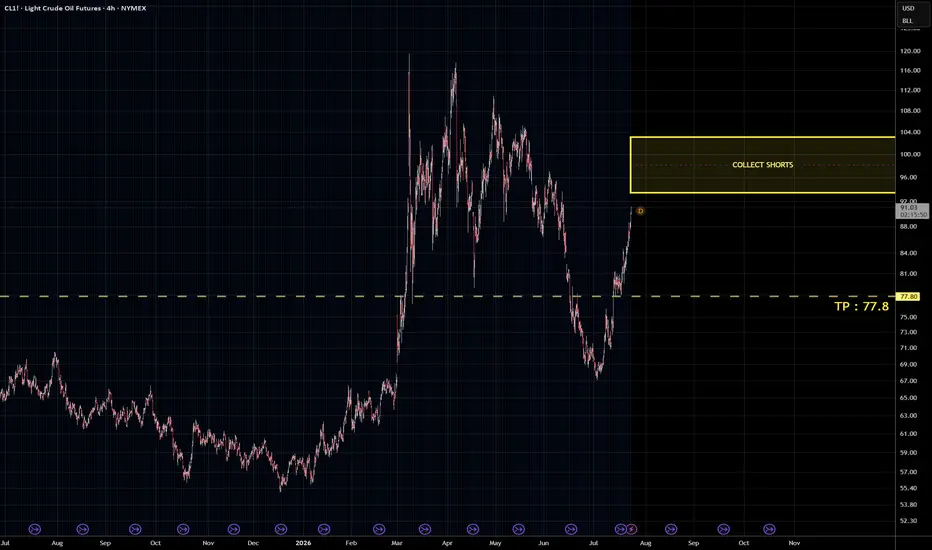
CL — the crude from the deep earth. Gathered at two stations: 93.4 and 96.6.
The patient layeth traps in rising waters.
Option upon option ascending to 103 — the trap door widens.
But 77.8 is written. The descent is certain.
The earth teacheth the humble. The fish of the sea declare it.
From 103 to 77.8 — the judgment is sealed.
OIL: Bound to Push Higher!Primary Scenario
In the near term, Brent and WTI futures are expected to continue moving higher as part of the broader corrective uptrend, ultimately breaking above resistance at $119.50 (Brent) and $119.48 (WTI). After these tops are reached, we anticipate significant sell-offs in both contracts, targeting our blue Long-Term Entry Ranges (Brent: $42.33–$29.90 / WTI: $49.85–$27.93), where the ongoing larger corrections should eventually conclude.
Alternative Scenario
Alternatively, Brent and WTI futures could break below support at $58.40 (Brent) and $54.98 (WTI) sooner, forming early correction lows within our blue Long-Term Entry Ranges (Brent: $42.33–$29.90 / WTI: $49.85–$27.93) (probability: 40%).
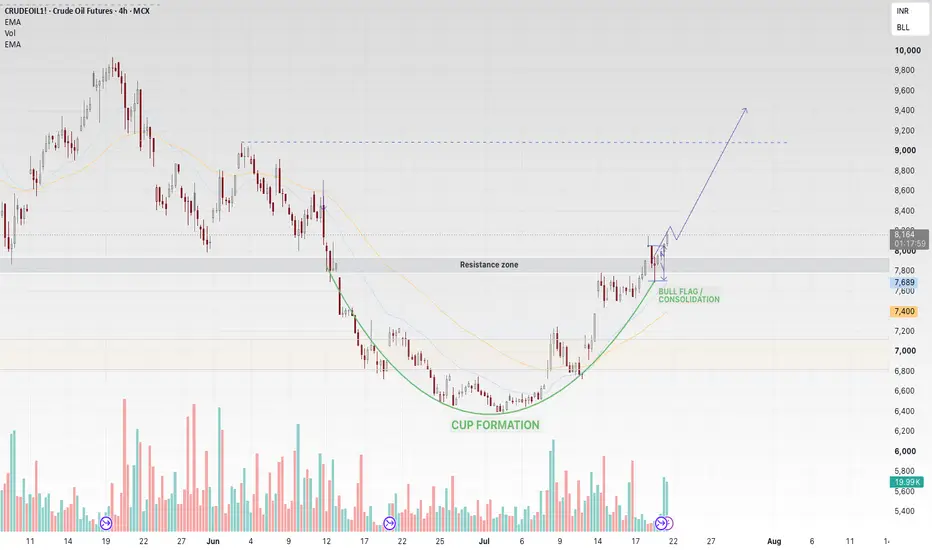
CRUDE OIL: Cup & Handle Breakout Loading | Resistance AbsorptionCrude Oil has completed a textbook Cup & Handle structure after reversing from the 6,400 demand zone.
Price is now testing a critical supply area around 8,000–8,150 where short-term profit booking is expected.
The broader market structure remains bullish with a clear sequence of higher highs and higher lows.
Recent consolidation beneath resistance suggests absorption rather than rejection, increasing the probability of an upside breakout.
Key Levels
🟢 Breakout Trigger: 8000
🟢 Retest Support: 7850–7950
As long as buyers defend the breakout zone, Crude Oil remains a buy-on-dips market.
#CrudeOil #MCXCrudeOil #CommodityTrading #PriceAction #TradingView #CupAndHandle #MarketStructure #TechnicalAnalysis #FuturesTrading #MCX #TrendFollowing
Why the Best Mean Reversion Exit May Not Be the MeanMean reversion has fascinated traders for decades because it is built on a simple observation: markets rarely move in straight lines forever. Periods of unusually strong buying or selling are often followed by a move back toward a more balanced price level. That concept has inspired countless trading strategies across futures, equities, currencies, and commodities.
Among the many tools used to identify these statistical extremes, Bollinger Bands® remain one of the most recognized. They expand and contract with volatility, creating dynamic envelopes around price that can highlight when a market has moved significantly away from its average.
Yet one of the biggest misconceptions about mean reversion trading is that a touch—or even a pierce—of a Bollinger Band automatically creates a trading opportunity. In reality, markets can remain stretched much longer than many traders expect.
This is where confirmation becomes important.
In this article, we'll explore a hypothetical case study using WTI Crude Oil Futures. The focus isn't on predicting where prices will go next. Instead, it's about examining how Bollinger Bands® and the Commodity Channel Index (CCI) can work together to identify potential mean reversion setups—and more importantly, why the exit chosen for those trades may deserve even more attention than the entry itself.
Understanding Mean Reversion
At its core, mean reversion assumes that unusually extended price moves may eventually migrate back toward a more typical trading level.
One of the simplest ways to visualize this behavior is with Bollinger Bands®.
The indicator surrounds a moving average with upper and lower bands that adjust according to recent market volatility. As volatility expands, the bands widen. As volatility contracts, they narrow.
When price trades beyond either band, it suggests that the market has reached a statistically unusual level relative to recent price action.
However, "unusual" does not necessarily mean "ready to reverse."
Strong trends can continue producing multiple Bollinger Band piercings before any meaningful reversal develops. This is one reason why experienced traders often avoid treating Bollinger Band touches as standalone trading signals.
Instead, they frequently seek additional confirmation before considering a potential mean reversion opportunity.
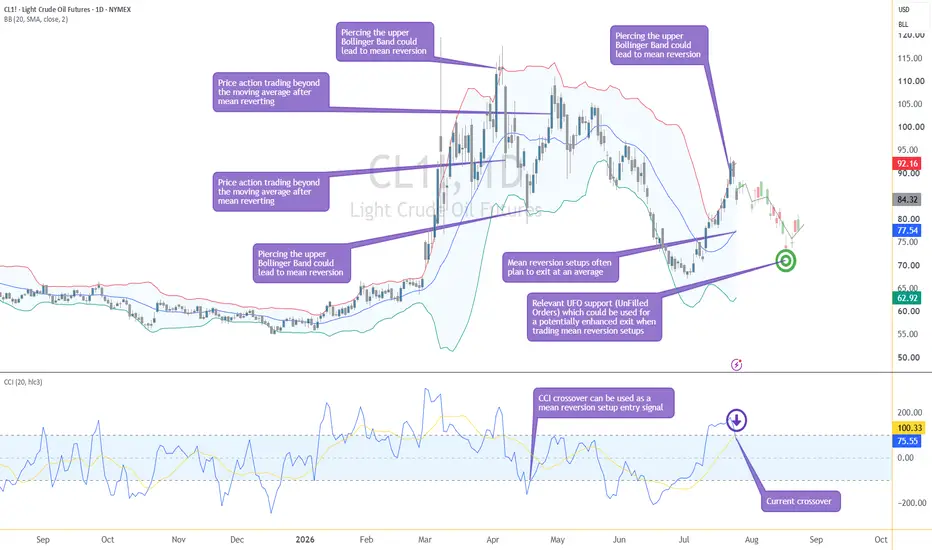
The accompanying chart illustrates several historical examples where price pierced both the upper and lower Bollinger Bands® before eventually reverting toward its average. It also shows that these reversions rarely occur immediately, reinforcing the importance of combining volatility analysis with another confirmation tool.
Adding Confirmation with the Commodity Channel Index
One possible confirmation tool is the Commodity Channel Index (CCI).
Although CCI was originally introduced to identify cyclical behavior in commodity markets, it has become a versatile momentum indicator used across many asset classes.
Rather than focusing solely on price extremes, CCI measures how far price has deviated from its recent statistical average.
In a mean reversion framework, the sequence becomes more important than either indicator individually.
For example:
Price first pierces the upper Bollinger Band, indicating a statistically stretched move.
Instead of entering immediately, the trader waits for CCI to cross downward from overbought territory.
That crossover suggests bullish momentum may be beginning to weaken, potentially supporting a mean reversion scenario.
Likewise, for a potential long setup:
Price pierces the lower Bollinger Band.
CCI later crosses upward from oversold territory.
The crossover may indicate that downside momentum is beginning to fade.
This additional confirmation cannot eliminate false signals.
Markets are probabilistic by nature.
However, waiting for momentum confirmation may help filter some of the premature entries that often occur when traders react solely to Bollinger Band piercings.
The current chart presents a timely educational example.
After trading beyond the upper Bollinger Band, CCI has recently produced a bearish crossover from overbought territory. From a purely educational perspective, this sequence illustrates how multiple technical tools can align to define a hypothetical mean reversion setup. Whether such a setup ultimately succeeds or fails is less important than understanding the analytical process behind it.
The Lesson Most Traders Miss
Entries receive most of the attention.
Books, courses, and online discussions frequently revolve around finding the perfect signal.
But trade management begins long before the entry.
One of the most overlooked questions in mean reversion trading is remarkably simple:
Where should the trade end?
Traditionally, the answer has been straightforward.
If price is reverting toward its average, then the moving average naturally becomes the target.
That logic is understandable.
After all, the moving average represents the statistical center of recent price activity.
Yet markets often display behavior that is far more nuanced.
A successful mean reversion does not necessarily stop exactly at the moving average.
Very often, price continues beyond that average before eventually finding meaningful support or resistance elsewhere.
This observation shifts the discussion from identifying a statistical mean to identifying where the market may actually complete its reversion.
That distinction can significantly influence trade planning.
Looking Beyond the Mean
The chart accompanying this article provides an interesting illustration.
The Bollinger Bands® identify an extended move.
The CCI crossover offers momentum confirmation.
If a trader were managing a traditional mean reversion setup, the moving average—currently located near the 77+ area—would likely become the initial objective.
There is nothing inherently wrong with that approach.
In fact, many successful mean reversion strategies have relied on this methodology for years.
However, another feature on the chart deserves attention.
Below the moving average lies a significant UFO support level near 73.16.
This represents an area where market structure may become particularly relevant.
Historically, markets often do not reverse with mathematical precision.
Instead, they frequently overshoot.
They may trade through moving averages before eventually finding stronger structural support or resistance.
From an educational perspective, this raises an interesting question.
If market structure suggests that price has room to continue beyond its statistical average, should the moving average automatically remain the preferred exit?
Or should traders consider whether additional structural analysis could produce a more efficient objective?
There is no universal answer.
Every methodology has advantages and limitations.
The important lesson is that exit selection deserves the same analytical effort as entry selection.
Rather than viewing the moving average as the mandatory destination, traders may benefit from asking whether the broader market structure supports extending—or in other situations shortening—the original objective.
How Exit Planning Changes Reward-to-Risk
Perhaps the most interesting aspect of this discussion is that nothing about the entry changes.
The Bollinger Band pierce remains the same.
The CCI confirmation remains the same.
The protective stop may remain identical.
Only the exit changes.
Yet changing only one component of the trade can meaningfully alter its overall reward-to-risk characteristics.
If the moving average represents the objective, the potential reward is one value.
If broader market structure supports extending the objective toward a deeper support level, the potential reward becomes larger while the initial risk may remain unchanged.
Naturally, larger objectives may also require greater patience and may be achieved less frequently.
This illustrates why trade management involves balancing probability against potential reward.
Neither approach is inherently superior.
Instead, each reflects a different philosophy regarding how markets complete mean reversion.
The key takeaway is not that every trade should ignore the moving average.
Rather, it is that traders should avoid assuming the moving average is automatically the optimal destination.
Sometimes it may be.
Sometimes market structure may suggest otherwise.
Educational Case Study: CL (WTI Crude Oil Futures)
The current chart provides a useful hypothetical example using CL (WTI Crude Oil Futures).
Price recently traded above the upper Bollinger Band, indicating a statistically extended move.
Subsequently, CCI crossed downward from overbought territory, creating a momentum confirmation consistent with a potential bearish mean reversion framework.
Again, this should not be interpreted as a directional call.
Instead, it serves as a practical example for discussing trade construction.
A traditional approach might define the moving average as the exit objective.
However, the chart also identifies a notable UFO support level near 73.16, located below that average.
If future price action were to continue beyond the moving average before encountering stronger structural support, an exit based solely on the average might leave additional price movement unexplored.
Whether that additional movement ultimately occurs is unknowable in advance.
The educational point is simply that structural analysis can complement statistical analysis when defining potential objectives.
The same methodology can also be applied using MCL (Micro WTI Crude Oil Futures).
Because the micro contract represents a fraction of the standard contract size, it allows traders to study and implement identical analytical techniques while adjusting position sizing according to their own risk parameters.
Illustrative Trade Structure
The following represents a purely hypothetical educational case study designed to demonstrate trade planning concepts.
Illustrative instrument
CL (WTI Crude Oil Futures)
MCL (Micro WTI Crude Oil Futures)
Illustrative entry condition
Price pierces the upper Bollinger Band.
CCI subsequently crosses downward from overbought territory.
Illustrative protective stop
Above the recent swing high that invalidates the mean reversion premise.
Traditional objective
The Bollinger Band moving average.
Alternative objective
Structural support represented by the UFO level near 73.16.
The purpose of this comparison is not to suggest that either objective is more likely to be achieved.
Rather, it demonstrates how different exit methodologies can produce different reward-to-risk characteristics while using the exact same entry criteria.
Contract Specifications
CL (WTI Crude Oil Futures)
Contract size: 1,000 barrels of crude oil
Minimum price fluctuation (tick): 0.01 per barrel = $10.00 per contract
Margin requirements (vary over time according to exchange and brokerage risk policies): ~$8,500 per contract.
MCL (Micro WTI Crude Oil Futures)
Contract size: 100 barrels of crude oil
Minimum price fluctuation (tick): 0.01 per barrel = $1.00 per contract
Margin requirements (vary over time according to exchange and brokerage risk policies): ~$850 per contract.
Although both contracts follow the same underlying market, the micro contract allows traders to scale exposure more precisely while applying the same analytical framework.
Risk Management Remains the Foundation
Every mean reversion strategy will encounter losing trades.
Some Bollinger Band piercings evolve into sustained trends.
Some CCI crossovers fail.
Some reversals begin only to reverse again shortly afterward.
No indicator eliminates uncertainty.
For that reason, risk management remains considerably more important than indicator selection.
Before considering any trade, traders should define:
Entry conditions.
Protective stop placement.
Position size.
Exit methodology.
Acceptable reward-to-risk profile.
Planning each of these components before entering a position helps reduce emotional decision-making while encouraging consistency across different market environments.
Final Thoughts
Mean reversion is often presented as a discussion about entries.
Yet this case study highlights a different perspective.
Bollinger Bands® can help identify statistical extremes.
CCI may provide additional momentum confirmation before considering a potential entry.
But perhaps the greatest opportunity for refinement lies elsewhere.
Rather than automatically assuming the moving average represents the ideal destination, traders may benefit from examining whether broader market structure offers a more efficient objective.
Sometimes it will.
Sometimes it won't.
Either way, treating exit selection as an analytical decision rather than an automatic assumption can encourage more thoughtful trade planning and may meaningfully influence the overall reward-to-risk characteristics of a trading strategy.
Data Consideration
When charting futures, the data provided could be delayed. Traders working with the ticker symbols discussed in this idea may prefer to use CME Group real-time data plan on TradingView: www.tradingview.com - This consideration is particularly important for shorter-term traders, whereas it may be less critical for those focused on longer-term trading strategies.
General Disclaimer
The trade ideas presented herein are solely for illustrative purposes forming a part of a case study intended to demonstrate key principles in risk management within the context of the specific market scenarios discussed. These ideas are not to be interpreted as investment recommendations or financial advice. They do not endorse or promote any specific trading strategies, financial products, or services. The information provided is based on data believed to be reliable; however, its accuracy or completeness cannot be guaranteed. Trading in financial markets involves risks, including the potential loss of principal. Each individual should conduct their own research and consult with professional financial advisors before making any investment decisions. The author or publisher of this content bears no responsibility for any actions taken based on the information provided or for any resultant financial or other losses.
Crude loses 89.50; 85.50 is the recovery testCL1! lost the rising 89.50 trend stop with a fast repricing into the 84.50–85.25 volume area. Chasing the first flush offers poor location, so I am neutral while price builds acceptance here. A sustained reclaim of 85.50 would favor a rebound toward 86.50 and 87.50. Failure below 84.20 would keep the breakdown active and expose 83.00–82.50. Invalidation for the bearish continuation case is an hourly close back above 86.00. Educational analysis only.
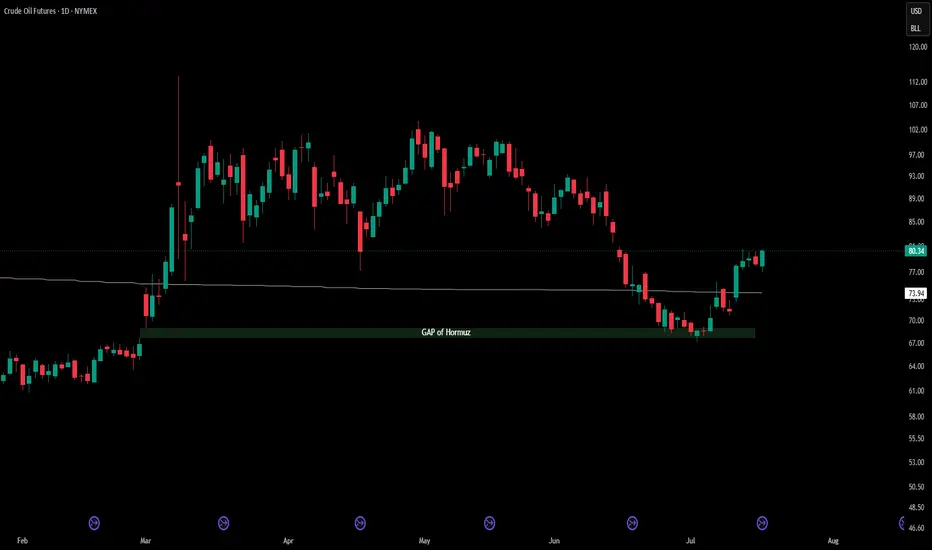
Crude Oil (WTI) | Buyers Are Defending a Critical Monthly ZoneAfter several months of selling pressure, WTI Crude Oil has finally reached an area where higher time frame buyers are beginning to react. While many traders remain focused on the recent bearish momentum, I believe the current technical picture deserves much closer attention.
On the monthly chart, price is testing a confluence of institutional factors:
Major Monthly Demand Zone
Unfilled Monthly Gap
Rising long-term trendline support
Previous breakout area now acting as support
This combination creates a high-interest zone where a medium-term reversal could develop.
Technical Perspective
Although the broader trend remains corrective, I don't see an attractive location to initiate fresh shorts after such an extended decline.
Instead, I'm watching whether buyers can continue defending the 68–74 USD area.
The first key obstacle sits around 84–85 USD.
A confirmed monthly close above this level would significantly improve the bullish structure and could open the path toward:
92 USD
100 USD
105 USD
COT Report
The latest Commitment of Traders report suggests a relatively neutral positioning.
Non-Commercial traders have reduced both long and short exposure, while Commercial participants remain net short, which is fairly typical for the crude oil market.
Open Interest has declined by more than 30,000 contracts, indicating that recent price action has been driven more by position liquidation than aggressive institutional accumulation.
In my opinion, the COT data is not yet confirming a strong bullish trend, but it also doesn't support the continuation of an aggressive bearish move.
Seasonality
Seasonality provides another interesting piece of the puzzle.
Historically, July has not been one of the strongest months for crude oil, with most long-term datasets showing either flat or slightly negative average performance.
This suggests that even if my long-term bullish thesis remains valid, price could still experience short-term volatility or another retracement before a larger directional move develops.
My Trading Plan
At this stage I'm monitoring two possible scenarios.
Scenario 1 (Preferred)
Price extends higher into the 84–85 USD resistance before retracing back toward 74–76 USD, where I would look for fresh buying opportunities if price confirms institutional demand.
Scenario 2
If buyers manage to reclaim and close decisively above 84–85 USD, I will assume that the correction has already ended and begin looking for continuation opportunities toward the next higher-time-frame liquidity targets.
Key Levels
🟢 Support
68–70 USD
72–74 USD
🔴 Resistance
84–85 USD
92 USD
100 USD
105 USD
CRUDEOIL1! — Technical Structure Analysis📈 CRUDEOIL1! — Technical Structure Analysis
Chart Visual & Pattern Layout: ChartsSpecialist (via TradingView)
🔍 Technical Observations
Rounding Bottom / Cup Structure: The chart illustrates a multi-week curved recovery formation (rounding bottom), representing a gradual shift from a sustained sell-off to persistent buying pressure.
Horizontal Supply Ceiling: Dual horizontal red lines annotated as "Major Resistance" outline a key overhead supply barrier, marking previous structural swing high levels.
Compression Below Resistance: Price action has rallied back up to directly test this major horizontal resistance zone, with candle bodies compressing right beneath the supply overhead.
📚 Technical Analysis Concepts Demonstrated
Rounding Bottom Patterns: Observing long-term u-shaped consolidation structures that highlight underlying trend reversals.
Testing Major Horizontal Resistance: Analyzing price reaction, volatility, and volume behavior as price approaches multi-month peak supply zones.
Market Structure & Curve Formations: Visualizing gradual accumulation dynamics across extended timeframes.
📌 SEBI Compliant Educational Disclaimer
Regulatory Disclaimer & Disclosures:
Educational Purpose Only: This post analyzes chart patterns and technical concepts strictly for learning and educational purposes.
No Recommendation: This content does NOT contain target levels, stop-loss triggers, entry calls, or buy/sell/hold recommendations.
SEBI Registration Status: ChartsSpecialist and the publisher are NOT SEBI-registered Research Analysts or Investment Advisors.
Risk Warning: Securities and commodities trading involves market risk. Past patterns do not guarantee future price movements. Please consult a qualified financial advisor before taking any market positions.
#ChartsSpecialist #CrudeOil #Commodities #TechnicalAnalysis #ChartReading #StockMarketEducation #SEBICompliant #PriceAction #TradingView #FinancialLiteracy #RoundingBottom #SupportAndResistance
Markets Mixed off PPI ReportYesterday’s CPI report brought some volatility across asset classes as there was a lot of back and forth price action where the equities and precious were able to finish the day higher, but did see aa finish significantly off of the high of the day. Looking across the board today, PPI came in similar to CPI where it was lower than expected, and today is showing a lot less volatility and more steady price action. The S&P, Russell and Dow all traded marginally higher while the Nasdaq slipped due to some AI equities feeling selling pressure today. Along with that, Gold, Platinum and Copper saw gains today while Silver had a slight decline, also in line with some of the AI equities slipping due to Silver’s connection to the general AI story.
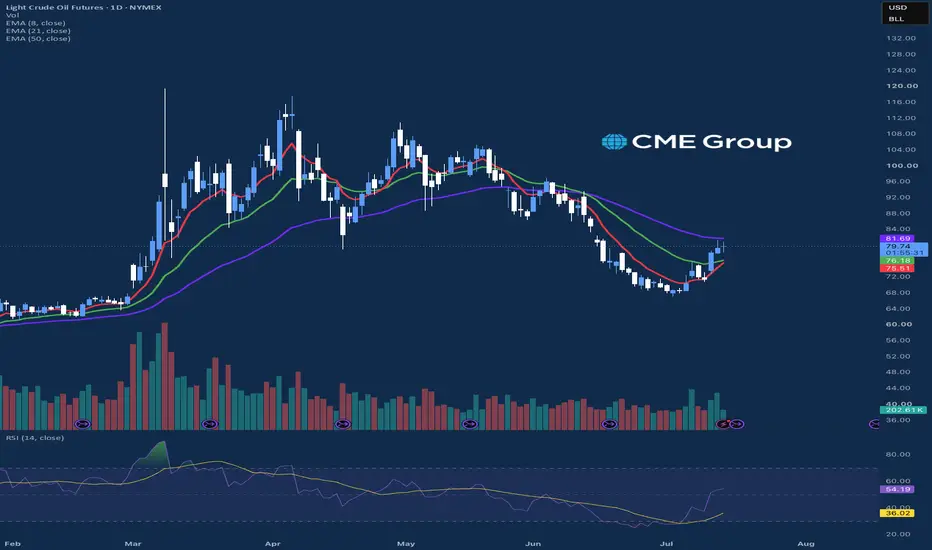
The Crude Oil market is now trading at a very interesting level since seeing a recovery from the recent low prices near $67/barrel. The prices have been moving higher from more escalation talks from the Middle East along with seeing a rebound from technically “oversold” levels, but is now facing some overhead congestion. The 50-day exponential moving average has been acting as a near term “ceiling” since prices broke below that level in May, and continues to be a bottleneck that prices will need to climb through to see any more upside momentum moving forward. Looking ahead, tomorrow we will see the Retail Sales report along with Initial Jobless Claims, wrapping up the week of economic data that could help paint a better picture of inflation and employment.
If you have futures in your trading portfolio, you can check out on CME Group data plans available that suit your trading needs tradingview.com/cme/
*CME Group futures are not suitable for all investors and involve the risk of loss. Copyright © 2023 CME Group Inc.
**All examples in this report are hypothetical interpretations of situations and are used for explanation purposes only. The views in this report reflect solely those of the author and not necessarily those of CME Group or its affiliated institutions. This report and the information herein should not be considered investment advice or the results of actual market experience.
CL Daily, in a down trend, with a bear target -3,852 ticks belowCL Daily time frame is in a down trend. The market
is making lower lows and lower highs. There is a
down Fibonacci with an extension price point 42.38
about -3,852 ticks below the market. As long as the
market does not take out the one boundary price
point 110.93 it is expected the market to fall towards
the Fibonacci target.
Entry: Counter trend line break bearish in the sell zone.
STOP: 113.05
LIMIT: 42.38
Another entry idea: If the risk is too large off the daily
time frame. It will be a good idea to turn to the smaller
time frames and look for selling ideas with less risk.
TEDS MCX Crude Oil Analysis | 3H Short Setup | 14 July 26TEDS Commodity Analysis | A Plan Is More Valuable Than a Prediction
Commodity markets can move rapidly, but successful trading is built on preparation—not reaction.
The TEDS (Trend Exhaustion Detection System) follows a structured process that helps traders wait for confirmation before planning a trade.
Chart Observation
🔹 The previous TEDS Sell Signal demonstrated how a structured setup develops when predefined conditions are met.
🔹 After the recent upward move, the framework has identified another TEDS Sell Signal, accompanied by a predefined Entry Zone for objective trade planning.
🔹 Before any trade is considered, the framework also defines the Stop Loss Area and Target Level, allowing traders to evaluate risk and reward before execution.
A disciplined trader should always ask:
• Has the setup been confirmed?
• Is my entry based on a predefined framework?
• Is the potential risk clearly defined before taking the trade?
• Am I following my trading plan instead of reacting to price?
Markets will continue to create opportunities, but long-term consistency comes from following a repeatable process—not from predicting every price swing.
Trade with a Framework. Not with Emotions.
Disclaimer: This chart is shared for educational purposes only to explain a structured trading framework and market behaviour. It is not investment advice or a recommendation to buy or sell any commodity or financial instrument. Please conduct your own analysis and apply appropriate risk management before making any trading decisions.
CL1! Analysis Confirmation - weeks of predictions + new rangesThe Fibonacci grid did its job.
The 61.8% level at $74.38 was the first pause on the way down.
The 78.6% zone near $65.78 was the real floor.
Price found it, turned, and has rallied 37% in three weeks.
But here's the thing: this is almost entirely a geopolitical trade.
Every dollar of this rally represents fear about supply disruption, not genuine demand growth.
The IEA was still projecting a 3.7 million bpd global surplus heading into July.
The fundamentals below the geopolitical layer haven't changed dramatically.
That means $96.66 is the critical test. If price breaks above it with real volume and no ceasefire signal, the $100 level is in play and the RBC worst-case scenario becomes a real conversation.
If we get any diplomatic development — even a rumour — this move unwinds toward $74 fast.
Respect the level. Don't chase the spike.
🟢 Bull Case
Target: $96.66 → $100+
Houthi-Bab al-Mandeb blockade expands. Bab al-Mandeb + Hormuz both disrupted = full choke on global oil routing. RBC Capital Markets flagging potential Brent $128–146 in worst-case regional war scenario. $96.66 breaks → $100 mental level is next test.
🔴 Bear Case
Target: $74.38 retest
Any credible ceasefire or MOU revival strips the war premium fast. This entire rally (from $67 → $92) was built on geopolitical fear. Remove the fear, remove the move. Gasoline at $4.09/gal creates political pressure on Trump to de-escalate.
CRUDE OIL |Major Channel Resistance in Focus,Bearish Bias IntactCRUDE OIL ANALYSIS
Price has rallied sharply into a major descending channel resistance, a zone that has repeatedly triggered selling pressure in the past.
Bearish view remains valid as long as the channel resistance holds.
A sustained move below 8,500 could accelerate the downside towards:
Target 1: 8,000
Target 2: 7,800
Invalidation: If price manages to break and sustain above the channel resistance, the bearish outlook will no longer remain valid.
Expected Reversal Zone: 9,300 – 9,500
Trade with proper risk management.
crude crucial update mcx or spotcrude mcx as per chart showing bull move still if sustain above 8820 than next up side 8900--9000-9120+++++ where support 8500 closing base .
spot oil eyes on 90$ if sustain above than next up side move 91--93$ soon support find 87$ on closing base --- still looks buy on dips with tight sl as support consider
Crude Oil MCX Fut Intraday Technical Analysis 23 July, 26MCX:CRUDEOIL1!
Crude Oil Futures (MCX) | Intraday Structure | July 23, 2026
Crude Oil is trading around 8,412, hovering directly above the 8,410 Zero Line. The contract has experienced a volatile corrective phase following its sharp rally toward the 8,570 peak, now compressing inside its central value block as market participants seek a clear directional catalyst.
Price enters the session locked tight around its primary benchmark. Buyers are defending the immediate support cluster to maintain structural continuity toward higher expansion targets, while bears are attempting to push price below the Zero Line to unlock deeper liquidation legs. Wait for a high-volume 15-minute candle breakout before committing capital.
Bullish Triggers
Long Entry: Above 8,441 (strongly validated while price holds structural footing above the 8,400 Add Long Pos. band).
Targets: 8,629 - 8,765
Risk Control: Structure weakens below 8,400. Hard exit below 8,323.
Bearish Triggers
Short Entry: Below 8,358 (validated if liquidity pushes fail to hold the 8,410 Zero Line, converting it into a firm distribution ceiling).
Targets: 8,191 - 8,055
Risk Control: Cover immediately above 8,476. Day Bias remains structurally protected above 8,222.
No-Trade Chop Zone: 8,323 - 8,441
Expect rotational, choppy price action inside this decision block as commercial participants balance risk. Avoid over-trading early whipsaws inside this zone; let a clean 15-minute structural candle breakout provide true execution validation.
Execution Rule: Structure first, confirmation next. Zero anticipation.
Hit Boost and drop your view in the comments if you're tracking these levels today.
#CrudeOil
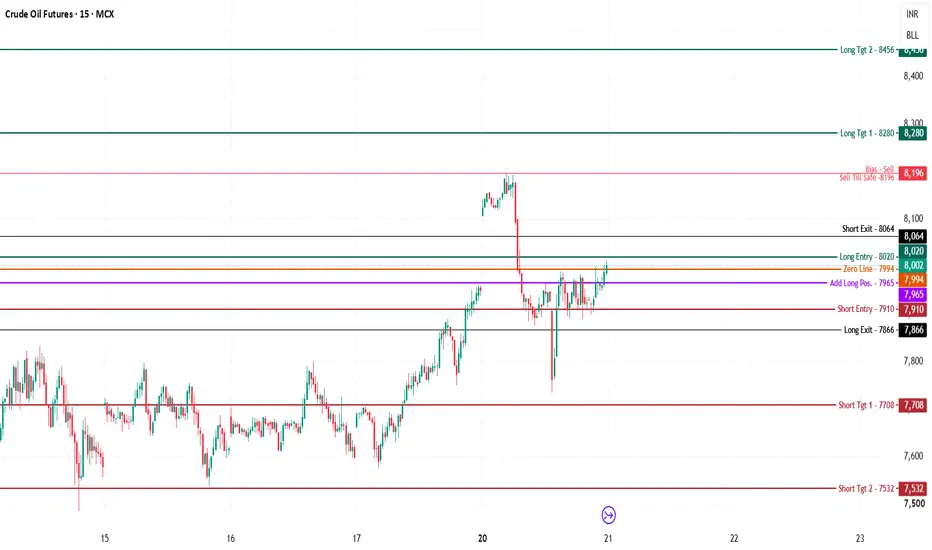
Crude Oil MCX Fut Intraday Technical Analysis for 21st July, 26MCX:CRUDEOIL1!
Crude Oil Futures (MCX) | Intraday Structure | July 21, 2026
Crude Oil is trading around 8,002, holding slightly above the 7,994 Zero Line after stabilizing following a sharp pullback from the 8,196 high. The contract has reclaimed its central inflection zone and is building a tight base as buyers attempt to regain control.
Price action enters the new session compressed near its primary pivot. Institutional desks are watching closely to see if price can hold above the Zero Line and build acceptance toward the higher targets, or if resistance cap pressure triggers another leg down. Wait for a high-volume 15-minute candle to break away from this cluster before committing capital.
Bullish Triggers
Long Entry: Above 8,020 (strongly validated if price holds structural footing above the 7,965 Add Long Pos. band).
Targets: 8,280 - 8,456
Risk Control: Structure weakens below 7,965. Hard exit below 7,866.
Bearish Triggers
Short Entry: Below 7,910 (validated if liquidity pushes fail to maintain the 7,994 Zero Line, turning it into a rigid distribution ceiling).
Targets: 7,708 - 7,532
Risk Control: Cover immediately above 8,064. Bias remains structurally protected below 8,196.
No-Trade Chop Zone: 7,866 - 8,020
Expect rotational, choppy price action within this decision range as commercial participants balance risk. Avoid chasing early morning whipsaws inside this block; let a clean 15-minute structural candle breakout provide execution confirmation.
Execution Rule: Structure first, confirmation next. Zero anticipation.
Hit Boost and drop your view in the comments if you're tracking these levels today.
#CrudeOil
CRUDE OIL Short
CRUDE OIL SELL LIMIT ORDER : 84.01
Stop Loss: 87.17
Remove risk/Partials @ : 81.18
Take profit: 80.06
Trade Plan: Short
Bias: BEARISH short term.
Entry reason: Price will most likely test key TPO area. The short-term valuation tool also shows temporarily overvalued against the competing index
Stop Loss: Above nearest high.
First target: 81.18
Please refer to WTI for CFDs symbols
CL Long — Crude's pullback looks like a gift as geopolitical risThe pullback long strategy is perfectly aligned with strong bullish catalysts surrounding geopolitical risks and potential supply constraints. Even without an explicit 1h trigger, the underlying 4h uptrend and ample room to the resistance target present a highly compelling case. The fundamental tailwind makes this an immediate take.
📍 Entry: 81.22
🛑 Stop: 79.39
🎯 Target: 84.60
⚖️ R:R: 1.85