Peers for comparison
Contract highlights
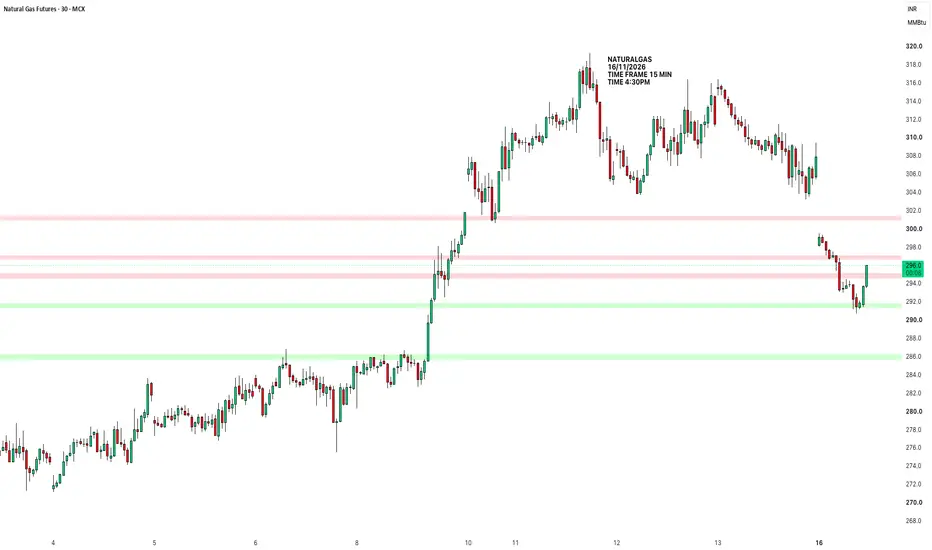
NATURALGASMCX:NATURALGAS1! The Short term structure is sideways range between 290.5-292.8. Wait for confirm breakout 292.8 confirm breakout could move price to selling zone 297.4 while lower breakdown of 289.5 could move the price to 288, 287.5, 285.8.
key resistance levels are 295, 297.5, 300.
key support
Natural Gas Futures (MCX) | Intraday Structure | November 16, 26Natural Gas Futures (MCX) | Intraday Structure | November 16, 2026
MCX:NATURALGAS1!
Please reciprocate your love by boosting this post, that motivates me to share further.
Natural Gas is trading around 307.9, hovering directly against the 308.00 Zero Line and just below the 308.24 Short Ent
Natural Gas Futures (MCX) | Intraday Structure | November 17, 26Natural Gas Futures (MCX) | Intraday Structure | November 17, 2026
MCX:NATURALGAS1!
Natural Gas is trading around 294.4, sitting directly on the 294.40 Zero Line and just underneath the 295.02 Short Entry trigger. The contract has experienced two-way volatility following a gap-down open and su
Natural Gas Futures (MCX) | Intraday Structure | November 20, 26Natural Gas Futures (MCX) | Intraday Structure | November 20, 2026
Please don't forget to boost the idea, just a minor efforts fuels me to share further.
MCX:NATURALGAS1!
Natural Gas is trading around 309.7, holding directly above the 308.50 Zero Line and the 309.17 Long Exit line. The contr
Can AI Power Demand Rescue Natural Gas Futures?Natural gas futures staged a dramatic technical reversal in November 2026. December NYMEX contracts bounced off their 20-day moving average, trapping aggressive short sellers. Mild autumn weather initially crushed eastern cash markets, sending regional hubs plunging over 25 percent. However, a sudde
Gas, silver, oil out-moved Bitcoin: 4.5% a day against 3.4%Does Bitcoin move more in a day than oil, gas or silver? Over the last year it moved less: natural gas, silver and WTI oil all had wider normal days.
What we measured
We took TradingView daily candles for 8 markets, from 16 October 2025 to 15 October 2026: gold, silver, WTI oil, natural gas, EUR
See all ideas
A representation of what an asset is worth today and what the market thinks it will be worth in the future.
Displays a symbol's price movements over previous years to identify recurring trends.
Frequently asked questions
One way to gain exposure to NGF2020 is through a broker that offers futures. Before trading, make sure you understand how the product works and the risks involved.
You can trade NGF2020 directly from TradingView:
– Choose a broker: Explore our supported trading partners and pick one that fits your needs
– Compare options: View available brokers side by side to evaluate fees and features
– Connect your account: Open Supercharts, click "Trade", select your broker, and log in
– Start trading: Place orders directly from the chart
Tip: If you're new to trading, try paper trading first — it lets you practice strategies in real market conditions without risking funds.
You can trade NGF2020 directly from TradingView:
– Choose a broker: Explore our supported trading partners and pick one that fits your needs
– Compare options: View available brokers side by side to evaluate fees and features
– Connect your account: Open Supercharts, click "Trade", select your broker, and log in
– Start trading: Place orders directly from the chart
Tip: If you're new to trading, try paper trading first — it lets you practice strategies in real market conditions without risking funds.
The nearest expiration date for NGF2020 is Dec 27, 2019.
Futures contracts expire on predetermined dates. As expiration approaches, many traders roll positions into the next contract to maintain exposure to the market.
Key metrics to watch near expiration:
• Volume and liquidity: Trading activity often shifts to the next contract month
• Open interest: Falling open interest may signal positions being closed or rolled forward
• Forward curve: Differences between contract prices can help identify market structure, including contango and backwardation
Explore the NGF2020 chart to monitor active contracts and contract-month activity.
Futures contracts expire on predetermined dates. As expiration approaches, many traders roll positions into the next contract to maintain exposure to the market.
Key metrics to watch near expiration:
• Volume and liquidity: Trading activity often shifts to the next contract month
• Open interest: Falling open interest may signal positions being closed or rolled forward
• Forward curve: Differences between contract prices can help identify market structure, including contango and backwardation
Explore the NGF2020 chart to monitor active contracts and contract-month activity.