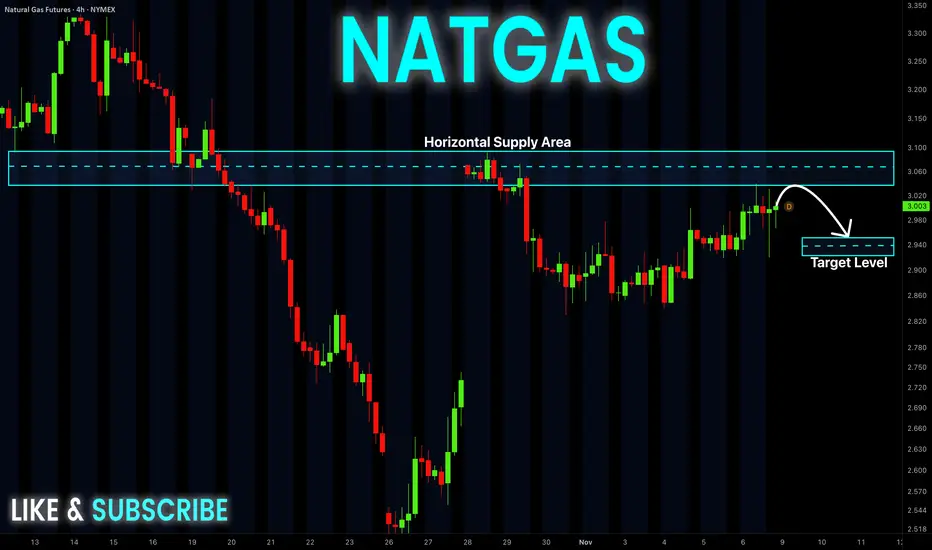
NATURAL GAS: Selling rallies is heavily favored.Natural Gas marginally turned bearish on its 1D technical outlook (RSI = 43.341, MACD = -0.070, ADX = 28.622) as after yesterday's massive gap up, it's on a 2 day losing streak. Since March, the price action has been ranged within the R1 and S1 Zones. Any rallies towards the R1 Zone are prime techni
Peers for comparison
Contract highlights
Natural Gas: Elliott Wave Structure Meets Global Energy Risks# Natural Gas | Approaching a Major Move: Elliott Wave Structure, Supply Risks, and Winter Demand
**Market: Natural Gas Futures (MCX) | Timeframe: Daily (1D)**
The global energy market is facing a period in which technical developments, geopolitical conditions, and seasonal changes in supply and d
Can Natural Gas Survive Global Chaos?Macroeconomics And Market Volatility
Natural gas futures face unprecedented macroeconomic pressure globally. US natural gas futures recently fell to a six-month low. Record short positions from hedge funds dominate the market. Economics dictate that abundant supply crushes immediate price momentum.
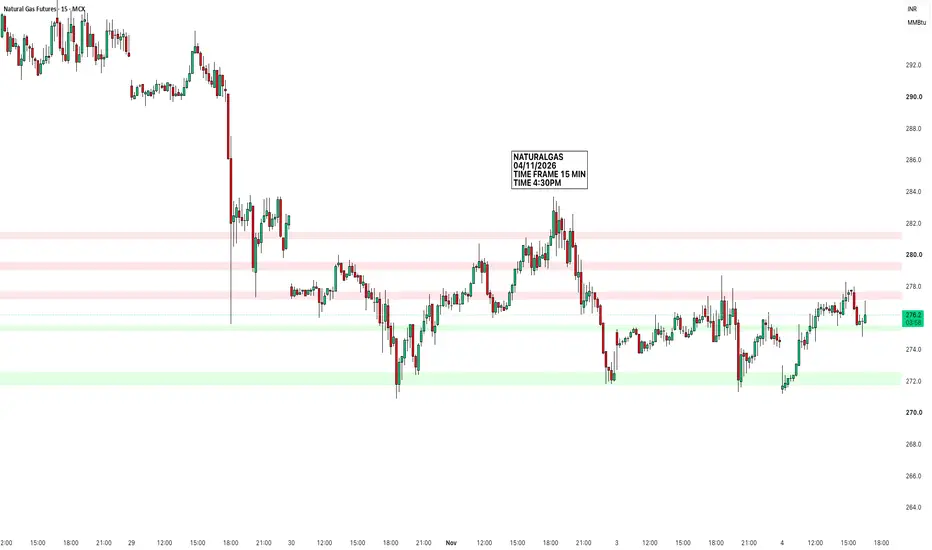
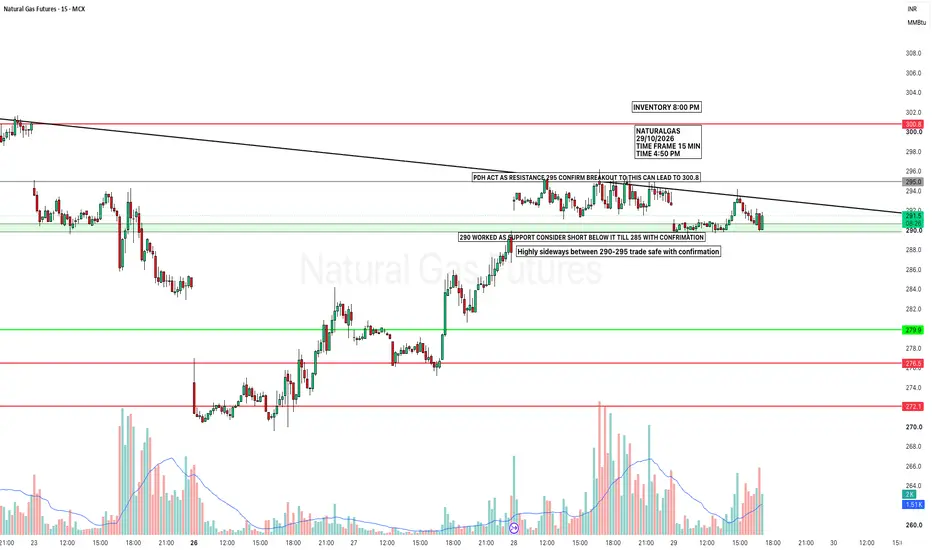
NATURALGASMCX:NATURALGAS1! The short-term structure is remain range-bound with a support of 277.9 immediate resistance is 280.3 sustained breakout above this level could trigger bullish momentum towards 283 and beyond, while a sustained breakdown towards 277.9 could slip the price upto 275.
Thank you
Trade
Natural Gas Futures (MCX) | Intraday Structure | November 02, 26Natural Gas Futures (MCX) | Intraday Structure | November 02, 2026
MCX:NATURALGAS1!
Natural Gas is trading around 276.9, hovering directly against the 277.10 Zero Line. The contract has experienced an aggressive recovery drive following a sharp liquidity sweep down near 271.0, pushing straight
Tools of the Trade 4:Capture, Document & Organize Trading IdeasTools of the Trade | Session 4: Capturing and Organizing Trading Ideas
One of the most valuable habits a trader can develop is documenting what they see in the market, why it matters, and what they expect might happen next.
In Session 4 of Tools of the Trade, we explore several built-in TradingVie
Non Commercial Profit ReleaseNon-commercials have added roughly 50k contracts since August 1st.
While nat gas was trending up, the gap between price and actual positioning kept getting wider.
Profit-taking started in mid-October, and I expect the bearish pressure to continue as the market works off the inefficient price act
See all ideas
A representation of what an asset is worth today and what the market thinks it will be worth in the future.
Displays a symbol's price movements over previous years to identify recurring trends.
Frequently asked questions
One way to gain exposure to NGH2026 is through a broker that offers futures. Before trading, make sure you understand how the product works and the risks involved.
You can trade NGH2026 directly from TradingView:
– Choose a broker: Explore our supported trading partners and pick one that fits your needs
– Compare options: View available brokers side by side to evaluate fees and features
– Connect your account: Open Supercharts, click "Trade", select your broker, and log in
– Start trading: Place orders directly from the chart
Tip: If you're new to trading, try paper trading first — it lets you practice strategies in real market conditions without risking funds.
You can trade NGH2026 directly from TradingView:
– Choose a broker: Explore our supported trading partners and pick one that fits your needs
– Compare options: View available brokers side by side to evaluate fees and features
– Connect your account: Open Supercharts, click "Trade", select your broker, and log in
– Start trading: Place orders directly from the chart
Tip: If you're new to trading, try paper trading first — it lets you practice strategies in real market conditions without risking funds.
The nearest expiration date for NGH2026 is Feb 25, 2026.
Futures contracts expire on predetermined dates. As expiration approaches, many traders roll positions into the next contract to maintain exposure to the market.
Key metrics to watch near expiration:
• Volume and liquidity: Trading activity often shifts to the next contract month
• Open interest: Falling open interest may signal positions being closed or rolled forward
• Forward curve: Differences between contract prices can help identify market structure, including contango and backwardation
Explore the NGH2026 chart to monitor active contracts and contract-month activity.
Futures contracts expire on predetermined dates. As expiration approaches, many traders roll positions into the next contract to maintain exposure to the market.
Key metrics to watch near expiration:
• Volume and liquidity: Trading activity often shifts to the next contract month
• Open interest: Falling open interest may signal positions being closed or rolled forward
• Forward curve: Differences between contract prices can help identify market structure, including contango and backwardation
Explore the NGH2026 chart to monitor active contracts and contract-month activity.