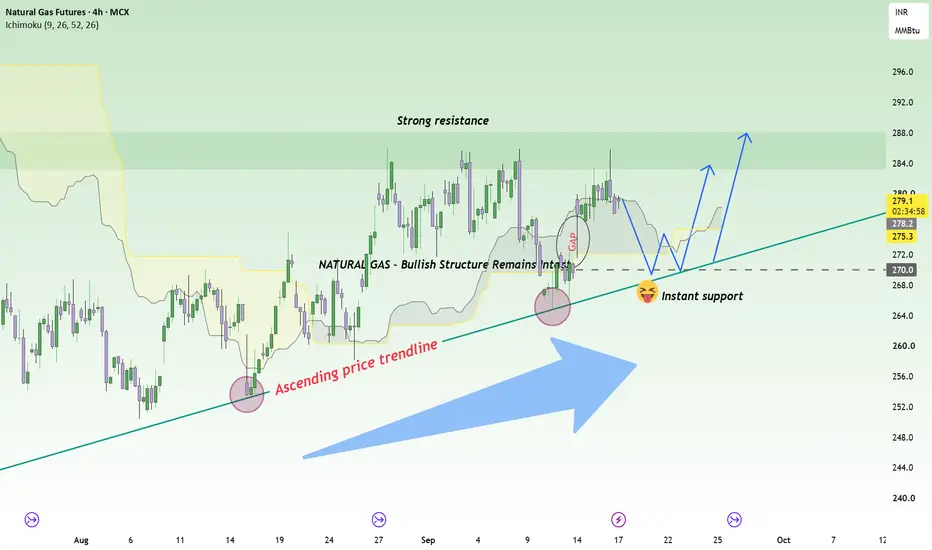
NATURAL GAS – Bullish Momentum Still Has Room to RunNatural Gas is entering an interesting phase as the longer-term fundamental outlook remains supportive while the technical structure continues to favor buyers. Growing demand for U.S. LNG exports is providing a stronger foundation for the market, even as high domestic production and comfortable inventories remain short-term headwinds.
From a fundamental perspective, rising U.S. LNG export demand and tighter conditions across the global LNG market are the main factors supporting the longer-term outlook. As more U.S. natural gas is directed toward overseas markets, stronger export demand could gradually tighten the domestic supply-demand balance. This keeps the broader picture constructive despite temporary pressure from storage and production.
On the H4 chart, Natural Gas continues to respect its ascending trendline, with 270 standing out as the key support area. This level also sits near the unfilled gap below, making it an important zone to watch if another pullback develops. As long as buyers continue to defend this structure, I expect the market to maintain its bullish path and gradually work its way back toward 283–288.
In the short term, 270 remains the line buyers need to protect. If it holds, 283–288 stays in focus as the next upside target zone.
In-depth trading ideas
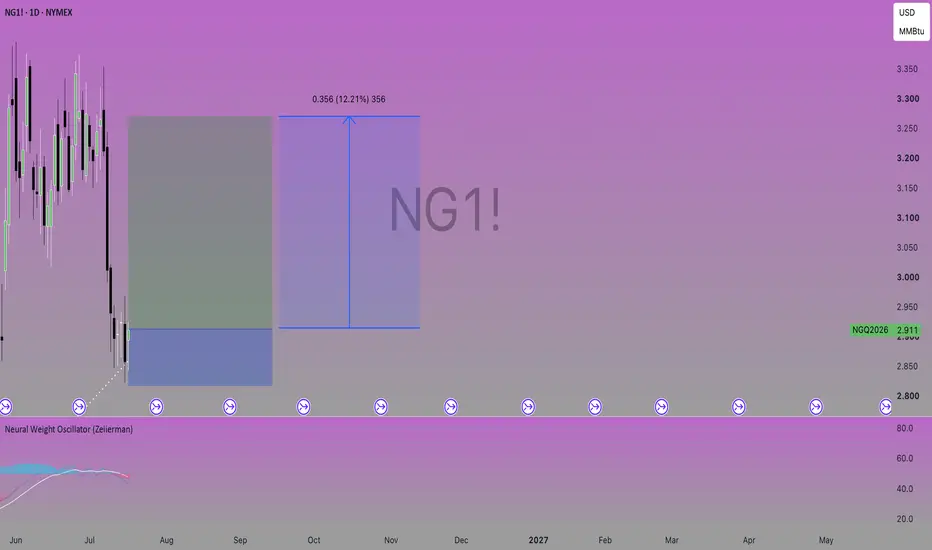
Super El Niño 2026–27: What Commodity Markets to Watch?Trade idea on NYMEX Henry Hub Natural Gas (NG); Also discussed: CBOT Wheat (ZW), Soybean Oil (ZL), Corn (ZC), Soybeans (ZS); COMEX Copper (HG)
A potentially historic El Niño is developing in the tropical Pacific. For commodity traders, however, knowing that El Niño is strengthening is only the beginning. The more important questions are: Which commodity markets are most exposed? Which expected impacts may already be reflected in futures prices? And where could the climate outlook still challenge the current market curve?
After comparing the major markets, I believe Henry Hub Natural Gas currently offers the cleanest way to express the El Niño thesis — not through a simple outright short, but through the winter-versus-spring calendar spread.
1. Latest NOAA Readings: El Niño Is Strengthening Rapidly
NOAA’s Climate Prediction Center (CPC) upgraded its assessment on September 10th: El Niño is strengthening, with 90% chance of a very strong event during the fall and winter of 2026–27.
By August, sea temperatures across the tropical Pacific were far above normal. The central Pacific was about 1.8°C warmer than average, while waters closer to Peru and Ecuador were more than 3°C warmer. NOAA found a large pool of warm water below surface, suggesting substantial heat supporting the El Niño.
NOAA’s September Relative Oceanic Niño Index (RONI) outlook is striking. For October–December 2026, the median forecast is +2.67°C, with the 25th–75th percentile range at +2.44°C to +2.90°C. CPC assigns a 98% probability that the OND RONI will be at least +2.0°C — its “very strong” category.
That does not guarantee any particular winter-weather outcome, but it does put the current event in the same conversation as the strongest El Niño in the modern record.
2. El Niño Basics — and What Makes One “Super”?
El Niño is the warm phase of the El Niño–Southern Oscillation (ENSO). Under normal conditions, tropical Pacific trade winds push warm surface water westward toward Asia. During El Niño, those trade winds weaken and warm water shifts eastward across the central and eastern equatorial Pacific.
That oceanic shift can reorganize tropical rainfall and the jet stream. During a typical El Niño winter, NOAA says the northern U.S. and Canada tend to be warmer and drier, while the southern U.S. is more likely to be wetter. El Niño can also increase drought risk in Australia and Indonesia and heavy-rain risk along parts of the west coast of South America.
What is a “Super El Niño”? The term is informal; NOAA Climate.gov has described ONI anomalies of about +1.5°C as strong and +2.0°C or higher as “very strong” or “historically strong.”
The strongest modern events include 1982–83, 1997–98 and 2015–16. NOAA lists peak ONI values of roughly +2.2°C, +2.4°C and +2.6°C, respectively, using the historical ONI series.
The 2026 event is notable not only for its projected strength but also for the speed of its transition. Niño-3.4 was still around +0.4°C in May, rose to about +1.2°C by July, and reached +1.8°C in August. The rapid development makes 1997–98 a useful historical analogue: NOAA documented that the 1997 event developed very rapidly during April–May and had already reached strong intensity by June.
The comparison is not a forecast that 2026–27 will reproduce 1997–98. Even the strong 2015–16 event produced a different atmospheric response from 1997–98. The lesson for traders is simple: use El Niño as a probability shift, not as a deterministic weather map.
3. Commodities With High El Niño Exposure
I screened the most plausible El Niño transmission channels, then compared them with current futures prices. The table below summarizes the markets that deserve the closest attention.
4. What Looks Already Priced In?
Wheat: December 2026 Chicago Wheat is near $7.33/bushel and roughly 30% higher year-to-date. Australian spring weather can still surprise, but a trader is no longer buying the drought story from a depressed price level. I would not make wheat the primary El Niño trade at this point.
Soybean Oil: December 2026 Soybean Oil is around 70.8 cents/lb, about 44% higher year-to-date and only modestly below its 2026 high. A delayed palm-oil production hit remains plausible, but the market has already moved a long way. I would not chase it as the main trade.
Copper: December COMEX Copper is around $6.48/lb and roughly one-third above year-ago levels. Peru-related flood disruption could add a weather premium, but electrification, grid investment, mine supply and macro factors are more important drivers. I would treat El Niño as a tail risk, not the core copper thesis.
Corn and Soybeans: El Niño can favor wetter growing conditions in Argentina and southern Brazil, which may pressure prices if yields improve. But planting progress, regional rainfall, U.S. crop conditions, biofuel policy and China demand are all large competing variables.
Natural Gas: The futures curve is already pricing substantial winter risk — January 2027 is about $1.09/MMBtu above April 2027. That is precisely why I prefer the calendar spread. The thesis is not that natural gas must fall; it is that a very strong El Niño could reduce the amount of winter premium ultimately required if the northern-U.S. winter is warmer than normal.
5. Trade Setup: Sell January 2027 / Buy April 2027 Henry Hub Natural Gas
Market snapshot used for this case study (September 16, 2026):
- Winter leg: January 2027 Henry Hub Natural Gas (NGF27), $3.843/MMBtu. SELL 1
- Spring leg: April 2027 Henry Hub Natural Gas (NGJ27), $2.752/MMBtu. BUY 1
- Calendar spread: January minus April, +$1.091/MMBtu. SELL the spread at +$1.09 or higher
The standard NYMEX Henry Hub Natural Gas futures contract represents 10,000 MMBtu. The minimum tick is $0.001/MMBtu, or $10 per contract. Because both legs have the same contract size, every $0.01/MMBtu change in the Jan/Apr spread is worth $100 per spread.
Illustrative order: Enter the two legs as one calendar-spread order where supported: SELL January 2027 / BUY April 2027 at a Jan-minus-Apr spread of +$1.09/MMBtu or higher. A spread order is preferable to legging into the two contracts separately because it reduces execution risk between the legs.
Why January versus April? January sits near the center of the U.S. heating season. April is after the peak winter demand period. If El Niño produces the typical warmer northern-U.S. winter pattern, storage withdrawals may disappoint relative to the winter risk currently embedded in January prices. The spread can narrow even if the entire natural-gas market does not fall.
Three Hypothetical Pricing Outcomes
Gas lower / warm-winter thesis works: $3.20(F7), $2.80(J7),+$0.40(S), +$6,910 (P/L)
Outright market broadly sideways: $3.80(F7), $2.85(J7), +$0.95(S), +$1,410 (P/L)
Gas higher / winter risk dominates: $5.25(F7), $3.20(J7), +$2.05(S), −$9,590 (P/L)
The examples above exclude commissions, exchange fees, bid/ask spread, margin effects and daily mark-to-market cash flows. They illustrate the economics of the calendar spread, not expected returns.
6. How I Would Hedge and Manage the Risks
First exposure: the April long leg. An outright January short is exposed to bullish natural-gas shock: production losses, LNG demand, geopolitics and broad changes in Natgas. Buying April against January short offsets a meaningful portion of that flat-price exposure and focuses the trade on winter seasonality.
Price stop: I would use a spread-based risk limit rather than a stop on either leg. From a +$1.09 entry, a close above roughly +$1.35/MMBtu would represent adverse widening of about $0.26/MMBtu, or $2,600 per standard spread before costs. That would be my initial level for reassessing or exiting the position.
Climate-thesis stop: The position should be reviewed if NOAA materially reduces the expected strength of El Niño or if U.S. seasonal temperature outlook stops favoring warmth across the northern tier. A climate trade should be reconsidered when the climate premise changes, even before the price stop is reached.
Cold-snap risk: A strong El Niño does not eliminate Arctic outbreaks. One severe January cold event can cause nearby gas to reprice violently. Traders who want a defined cap on that tail risk could add an out-of-the-money January call, or replace part of the futures exposure with options; the strike and premium should be selected from the live options chain at execution.
Position size: The standard NG contract is large. CME also lists Micro Henry Hub Natural Gas futures at 1,000 MMBtu — one-tenth the standard contract size — for traders who want to scale the same market view with smaller notional exposure.
Conclusion
A Super El Niño does not translate into one universal “buy commodities” or “sell commodities” rule. The transmission mechanism differs by region and market: Australia can face crop stress while parts of South America receive beneficial rainfall; Peru can face flood risk while a warmer northern-U.S. winter can reduce heating demand.
The more useful trading question is: where does the climate probability differ from what the futures market is already charging? Wheat and soybean oil have already rallied sharply. Copper has too many dominant non-weather drivers. Corn and soybeans have a less direct and more regionally complex ENSO relationship.
Henry Hub Natural Gas has the cleanest first-order link to U.S. winter temperatures. Rather than simply shorting gas, I prefer expressing the thesis through the winter curve: short January 2027 and long April 2027 around a +$1.09/MMBtu spread. The position is a bet that an exceptionally strong El Niño ultimately reduces the winter risk premium embedded in January gas.
Happy Trading.
Disclaimers
*Trade ideas cited above are for illustration only, as an integral part of a case study to demonstrate the fundamental concepts in risk management under the market scenarios being discussed. They shall not be construed as investment recommendations or advice. Nor are they used to promote any specific products, or services.
Sources and Data Notes
• NOAA Climate Prediction Center, ENSO Diagnostic Discussion, September 10, 2026: www.cpc.ncep.noaa.gov
• NOAA CPC, Official RONI Outlook and ENSO Strength Probabilities, September 2026: www.cpc.ncep.noaa.gov and www.cpc.ncep.noaa.gov
• NOAA Ocean Service / Climate.gov explanations of El Niño impacts and historical strength: oceanservice.noaa.gov and www.climate.gov
• NOAA CPC historical 1997–98 El Niño summary: www.cpc.ncep.noaa.gov
• CME Group Henry Hub Natural Gas contract specifications: www.cmegroup.com
• September 16, 2026 futures-price snapshots: Barchart and TradingView. Market prices are intraday/delayed snapshots and should be refreshed immediately before publication or execution.
TTF, the natural gas contract to watch!What are the best market indicators for determining the real state of maritime traffic and energy transportation through the Strait of Hormuz?
I imagine that most of you thought of the oil price on the stock market, and you are right. The oil price and the technical signals it provides are the best way to assess the actual maritime traffic through the Strait of Hormuz and also the Bab-el-Mandeb Strait.
On the subject of oil, I invite you to look again at the technical map that I have presented to you several times by clicking on the chart below.
But you will not have a complete picture of the situation if you overlook natural gas and LNG exports through the Strait of Hormuz, particularly Qatari exports.
Qatar exports a significant share of its LNG to Europe, which is why the benchmark natural gas contract in Europe can help us properly assess the actual state of LNG exports from the Middle East to Europe.
The benchmark contract in Europe is called TTF.
The chart below shows weekly Japanese candlesticks for TTF, the benchmark natural gas contract in Europe, which is directly influenced by LNG exports through the Strait of Hormuz. The price would need to fall back below €60/65 to speak of a return to normality, meaning a non-inflationary situation.
But what exactly is TTF?
TTF, short for “Title Transfer Facility”, is essentially the benchmark price for natural gas in Europe. It is a virtual wholesale market based in the Netherlands, where natural gas contracts, particularly futures contracts, are traded.
TTF has become the main European benchmark for determining the price of natural gas, somewhat like Brent for oil. Its importance in the current geopolitical context is therefore major: if LNG exports from Qatar or other Middle Eastern producers were severely disrupted by a closure or slowdown in traffic through the Strait of Hormuz, the European gas market would quickly price in the risk of shortages, and TTF contracts could then rise sharply.
Conversely, a geopolitical easing and confirmation of normal maritime traffic through Hormuz should reduce the risk premium embedded in gas prices. TTF is therefore an excellent financial barometer, complementary to oil, for monitoring the real impact of geopolitical tensions on energy flows between the Middle East and Europe.
This second chart adds the Ichimoku system to the weekly chart of the TTF contract.
DISCLAIMER:
This content is intended for individuals who are familiar with financial markets and instruments and is for information purposes only. The presented idea (including market commentary, market data and observations) is not a work product of any research department of Swissquote or its affiliates. This material is intended to highlight market action and does not constitute investment, legal or tax advice. If you are a retail investor or lack experience in trading complex financial products, it is advisable to seek professional advice from licensed advisor before making any financial decisions.
This content is not intended to manipulate the market or encourage any specific financial behavior.
Swissquote makes no representation or warranty as to the quality, completeness, accuracy, comprehensiveness or non-infringement of such content. The views expressed are those of the consultant and are provided for educational purposes only. Any information provided relating to a product or market should not be construed as recommending an investment strategy or transaction. Past performance is not a guarantee of future results.
Swissquote and its employees and representatives shall in no event be held liable for any damages or losses arising directly or indirectly from decisions made on the basis of this content.
The use of any third-party brands or trademarks is for information only and does not imply endorsement by Swissquote, or that the trademark owner has authorised Swissquote to promote its products or services.
Swissquote is the marketing brand for the activities of Swissquote Bank Ltd (Switzerland) regulated by FINMA, Swissquote Capital Markets Limited regulated by CySEC (Cyprus), Swissquote Bank Europe SA (Luxembourg) regulated by the CSSF, Swissquote Ltd (UK) regulated by the FCA, Swissquote Financial Services (Malta) Ltd regulated by the Malta Financial Services Authority, Swissquote MEA Ltd. (UAE) regulated by the Dubai Financial Services Authority, Swissquote Pte Ltd (Singapore) regulated by the Monetary Authority of Singapore, Swissquote Asia Limited (Hong Kong) licensed by the Hong Kong Securities and Futures Commission (SFC) and Swissquote South Africa (Pty) Ltd supervised by the FSCA.
Products and services of Swissquote are only intended for those permitted to receive them under local law.
All investments carry a degree of risk. The risk of loss in trading or holding financial instruments can be substantial. The value of financial instruments, including but not limited to stocks, bonds, cryptocurrencies, and other assets, can fluctuate both upwards and downwards. There is a significant risk of financial loss when buying, selling, holding, staking, or investing in these instruments. SQBE makes no recommendations regarding any specific investment, transaction, or the use of any particular investment strategy.
CFDs are complex instruments and come with a high risk of losing money rapidly due to leverage. The vast majority of retail client accounts suffer capital losses when trading in CFDs. You should consider whether you understand how CFDs work and whether you can afford to take the high risk of losing your money.
Digital Assets are unregulated in most countries and consumer protection rules may not apply. As highly volatile speculative investments, Digital Assets are not suitable for investors without a high-risk tolerance. Make sure you understand each Digital Asset before you trade.
Cryptocurrencies are not considered legal tender in some jurisdictions and are subject to regulatory uncertainties.
The use of Internet-based systems can involve high risks, including, but not limited to, fraud, cyber-attacks, network and communication failures, as well as identity theft and phishing attacks related to crypto-assets.
MCX Natural Gas Price Forecast 2026–2027🟢 2020–2022: Five-Wave Impulse
From the 2020 low near 110.5 , Natural Gas developed a clear five-wave advance into the 2022 high near 801 . Wave I advanced from 110.5 to approximately 251.3, followed by Wave II correcting to around 165. Wave III then extended strongly from 165 to approximately 485, followed by Wave IV, which declined to around 265.5. Finally, Wave V advanced from 265.5 to the major 2022 peak near 801, completing the larger 5-wave impulse .
🟢 2022–2026: Development of Wave B
Following the completion of the five-wave advance at the 2022 high near 801 , Natural Gas began a larger corrective phase. Wave A declined from approximately 801 to 128.5 , followed by Wave B , which recovered from 128.5 to approximately 632 by 2026. Within this Wave B, the advance is interpreted as a W-X-Y corrective structure , rather than a conventional five-wave impulse. Wave W advanced from around 128.5 to approximately 410, Wave X corrected back toward the 250–260 area, and Wave Y then advanced toward 632. This gives the larger structure as A(5) → B(W-X-Y) , with the 632 high potentially marking the completion of the main Wave B.
🔴 2026–2027: The Potential Wave C Decline
With the larger Wave B potentially completing near 632 in 2026 , Natural Gas may now be developing the next major Wave C of the larger correction. The current working count treats the decline from 632 as a potential five-wave impulse , but the internal structure is still developing and needs further confirmation. Using the larger A-B-C structure, the 61.8% of Wave A gives a potential Wave C termination near 216.4 , making this an important longer-term level to monitor for the 2026–2027 scenario.
🎯 Key Long-Term Level: 216.4 — Potential Wave C termination
For intraday and day traders, the next step is to break this developing Wave C down into its daily Elliott Wave structure . I will update the daily count soon to identify the potential internal impulse structure and calculate more precise Wave 3, Wave 5, and targets for shorter-term analysis. The daily count will also help determine whether the larger Wave C toward 216.4 is developing as expected.
👉 What do you think: Can Wave C reach 216.4 by 2027?
Gold Price Forecast | Oil | Dollar | Silver | Natural Gas.Gold Price Forecast | Oil | Dollar | Silver | Natural Gas.
0:00 Market Overview & Macro Context
0:28 Natural Gas Analysis (NG / UNG) NYMEX:NG1!
3:32 Crude Oil Analysis (CL / USO) NYMEX:CL1!
5:10 US Dollar Index Analysis (DXY / UUP)
6:55 Gold Analysis (GC / GLD) COMEX:GC1!
9:05 Silver & Precious Metals Analysis (SI / SLV) COMEX:SI1!
Gold Price Forecast | Oil | Dollar | Silver | Natural Gas.
0:00 Introduction & Overview
0:26 Natural Gas Technical Analysis & Trend Dynamics NYMEX:NG1!
1:20 Natural Gas Key Support & Resistance Levels
3:28 Crude Oil Dark Pool Activity & Peak Fear Analysis NYMEX:CL1!
5:21 US Dollar & FOMC Rate Hike Expectations
7:25 Gold Technical Analysis & Inverted Dollar Correlation COMEX:GC1!
9:15 Silver Outlook & Potential Liquidity Grab COMEX:SI1!
10:01 Outro & FOMC Risk Warning
NATURAL GAS: 1M Death Cross eyes 1.900.Natural Gas is marginally bearish on its 1D technical outlook (RSI = 44.132, MACD = 0.726, ADX = 25.369) with 1W neutral (RSI = 46.527) as the long term trend remains bearish. The pattern is similar to the 3 major Tops that formed since the 2009 bear market and on top of that it just formed a Death Cross on the 1M timeframe. The multiyear Support has been 1.900 and in 3 cases the bottom was formed even lower, so that gives us a fair long term Target for 2027 (TP = 1.900).
## If you like our free content follow our profile to get more daily ideas. ##
## Comments and likes are greatly appreciated. ##
BTR Pro Indicator I Natural Gas Mini — Daily Chart StudyA clear example of how patience and structured price-action analysis can help a trader stay focused on the larger market move.
On the Natural Gas Mini Futures 1D chart, BTR Pro highlighted:
🔹 BTR Buy Signal — earlier in the chart
🔹 BTR Sell Signal — around July
🔹 BTR Buy Signal — again around late August
The latest BTR Buy setup shows:
SL Reference: 253.5
T1: 309.8
T2: 337.9
T3: 366.1
Current price on the chart: 292.6
The important lesson isn't simply the signal.
It's the process:
Signal → Risk Reference → Targets → Patience → Discipline
A trader doesn't need to react to every candle.
Sometimes the biggest advantage is simply having a defined framework and allowing the market to develop.
No Fear. No Greed. No Emotional Decisions.
Only Discipline.
📌 This chart is shared for educational and technical-analysis purposes. The levels shown are indicator-generated chart references, not a guarantee of future performance or a trading recommendation.
Natural Gas: Decoding the Next Major Move — 3M | 1M | 1D | 4HNatural Gas: Decoding the Structural Architecture Behind the Next Major Move
An Integrated Time–Price Analysis of NG1! Across 3M, 1M, 1D and 4H Timeframes
1. Structural Thesis
Natural Gas Futures (NG1!) currently present a long-term structural configuration extending from the earliest available price data in April 1990 to the latest recorded price of $2.881 on 30 August 2026. Across the 3M, 1M, 1D and 4H timeframes, the market develops through a hierarchical structural sequence in which each lower timeframe decomposes the most recent structurally meaningful segment identified at the higher degree.
The analysis begins with the 3-month timeframe to establish the primary structural architecture. The monthly timeframe then isolates the internal development of the terminal macro phase, while the daily and 4H timeframes progressively resolve the declining structure currently associated with the unresolved ? phase.
The central question is therefore no longer the existence of the broader structure, but whether the most recent decline has completed the current phase and activated the next structural expansion, .
That determination remains conditional upon the interaction of Price, Time, and Structural Confirmation. The current low is therefore treated as a structural hypothesis rather than a confirmed terminal point until the required reversal conditions are satisfied.
2. Analytical Framework and Structural Notation
The analytical sequence follows a strict top-down hierarchy:
3M → 1M → 1D → 4H
The 3M timeframe establishes the primary long-term structure. The 1M timeframe decomposes the current last phase.The 1D timeframe decomposes the current , which is the fourth phase of , at the fourth degree, And the 4H timeframe analyzes and examines the fifth phase of , labeled (ω).
The Weekly timeframe is intentionally excluded. The structurally meaningful segment identified at that level does not contain sufficient wave development to justify a further decomposition, so the analysis transitions directly from Monthly to Daily.
Structural Notation
To preserve the identity of each structural degree, the labels are intentionally maintained and are not treated as interchangeable:
3M | Fifth Minuette | → → → →
1M | Fourth Subminuette | → → → ? →
1D | Third Micro | (α) → (β) → (γ) → (δ) → (ω)
4H | Second Submicro | α → β → γ → δ → ω
The similarity of the names across degrees is intentional. The distinction is established by the structural degree and timeframe in which each label is used.
Accordingly, , , and (δ) should not be interpreted as the same structural object. Each belongs to a different degree within the hierarchy.
3. Historical Structural Architecture — 3M
The long-term Natural Gas structure is defined by four major structural turning points, which establish the framework for a fifth and final phase. From the beginning of the recorded price series to the present, the 3M timeframe identifies two major highs and two major lows.
— $4.61 | October 1996
The first major structural high was established at $4.61. From the beginning of the recorded price series, 26 quarterly bars elapsed, corresponding to approximately 6 years and 6 months.
This establishes the first major phase of the long-term structure at the fifth Minuette degree.
— $2.12 | January 2000
The first major structural low was established at $2.12. The interval from Alpha to Beta contains 13 quarterly bars, equivalent to approximately 3 years and 3 months.
— $13.694 | July 2008
The second major structural high was established at $13.694. From Beta to Gamma, 34 quarterly bars elapsed, corresponding to approximately 8 years and 6 months.
— $1.44 | April 2020
The second major structural low was established at $1.44. From Gamma to Delta, 47 quarterly bars elapsed, equivalent to approximately 11 years and 9 months.
These four structural vectors establish the long-term standard neutral five-phase configuration:
→ → → →
The current market position therefore represents the development of the fifth and final phase, .
4. Long-Term Structural Boundaries — 3M
The macro structure is contained between two principal structural boundaries.
Alpha–Omega Resistance
The upper structural boundary is defined by the relationship between the high and the recorded peak of the phase. This line represents the principal long-term resistance boundary of the formation.
Beta–Delta Support
The lower structural boundary is defined by the low and the absolute low. This line represents the principal long-term support boundary.
Together, these two boundaries define the structural range within which is developing. The broader configuration remains consistent with a five-phase neutral structure, with representing its terminal phase.
The next level of analysis therefore shifts from the macro structure to the internal architecture of .
5. Time–Price Architecture of the Long-Term Structure — 3M
The 3M structure provides a Time–Price framework for comparing the established phases in both duration and price development. The principal relationships include β/α, γ/α, δ/β, δ/γ, projected γ/α timing, and the hypothetical ω/γ relationship.
These relationships are used to evaluate how the duration and magnitude of each structural phase compare with structurally related phases. Their purpose is not to generate an independent forecast, but to establish proportional references against which the development of the contracting phase can be evaluated.
6. Structural Decomposition — 1M
The monthly timeframe isolates the internal architecture of the long-term phase.
At the fourth Subminuette degree, develops as a contracting five-phase structure:
→ → → ? →
— $9.39
September 2022
The first major high of the contracting structure was established at $9.39.
— $2.50
November 2024
The first major low followed at $2.50.
— $7.40
January 2026
The second major high was established at $7.40.
? — approximately $2.80
The current phase has declined toward approximately $2.80. Its completion, however, has not yet been conclusively confirmed. It therefore remains designated ?.
The unresolved structural question at this degree is whether the current decline represents the completed fourth phase of the contracting formation and consequently opens the path toward the final phase.
Contracting Structural Boundaries
The contracting formation is defined by two converging boundaries:
Upper Boundary — –
A descending resistance line connecting the highs of and .
Lower Boundary — –
A sloping support line connecting the low of with the current low region.
These two boundaries define the contracting architecture in which the unresolved ? phase is developing.
7. Time–Price Structure of — 1M
The projected phase is constrained by both price and time. The model incorporates Fibonacci price references and a critical Non-Violation Zone, whose violation would invalidate the current contracting interpretation. The temporal framework is defined by the 0.382, 0.50, 0.618, 0.786, and 1.000 ratios, with 1.618 representing the upper permissible temporal boundary for the projected wave.
This establishes the conditions under which the monthly ? can either mature into a confirmed terminal phase or be invalidated by structural violation.
8. Structural Decomposition — 1D
The daily timeframe decomposes the current structure, which is the fourth phase of Vector Omega at the fourth degree, into a five-phase reversal structure at the third Micro degree.
The internal sequence is:
(α) → (β) → (γ) → (δ) → (ω)
(α) — approximately $2.77
February 2026
The initial declining leg from the high completed at approximately $2.77.
(β) — approximately $3.31
March 2026
The first corrective advance reached approximately $3.31.
(γ) — approximately $2.50
April 2026
The principal low of the declining sequence formed at approximately $2.50.
(δ) — approximately $3.35
July 2026
The second corrective advance reached approximately $3.35.
(ω) — approximately $2.69
August 2026
The final declining leg reached approximately $2.69.
This sequence is interpreted as a potential completion of the broader structure, which constitutes the fourth phase of Vector Omega at the fourth degree, through a five-phase reversal structure at the third Micro degree. However, confirmation has not yet been achieved, so the higher-degree structure remains designated ?.
The daily configuration is bounded by two structural lines:
Upper Boundary — (β)–(δ)
A descending resistance line connecting the two corrective highs.
Lower Boundary — (α)–(ω)
A descending support line connecting the structural lows.
Together, these lines define the internal reversal channel of the Micro-degree structure.
9. Time–Price Relationships Within — 1D
The daily timeframe provides seven internal Time–Price relationships:
β/α, γ/α, δ/β, δ/γ, ω/α, ω/γ, and ω/δ.
These relationships compare the duration and price development of the Micro-degree phases and help evaluate how the final (ω) leg relates proportionally to the preceding structure. No individual ratio is treated as an independent confirmation of the contracting low; rather, the combined proportional relationships provide additional structural context for assessing whether the observed decline is consistent with a completed reversal sequence.
10. (ω) Structural Decomposition — 4H
The 4H timeframe provides the most immediate structural resolution of the current market position.
At the second Submicro degree, the structure under examination is the internal Omega sequence:
α → β → γ → δ → ω
α — $2.85
14 July 2026
The first declining leg from the high of the Delta phase at the Micro degree completed at $2.85.
β — $2.99
23 July 2026
The first corrective upward leg reached $2.99.
γ — $2.62
6 August 2026
The principal price low within the declining sequence formed at $2.62.
δ — $2.87
19 August 2026
The second corrective upward leg reached $2.87.
ω — $2.69
25 August 2026
The final declining leg completed at $2.69.
The sequence presents a complete-looking five-phase decline. However, the importance of the final low extends beyond the Submicro structure itself.
Its confirmation would imply:
completion of the Micro-degree (ω) → completion of the broader Subminuette
For that reason, the 4H structure remains marked ? until the higher-degree reversal condition is activated.
The internal configuration remains contained within a descending reversal channel:
Upper Boundary — β–δ
Lower Boundary — α–ω
These boundaries define the Submicro-degree reversal structure under observation.
11. Time–Price Relationships — 4H
The 4H structure provides the immediate Time–Price framework for evaluating the maturity of ?. Its principal relationships are β/α, γ/α, δ/β, δ/γ, ω/α, and ω/γ.
These relationships describe the temporal and price proportions of the Submicro-degree reversal sequence and provide additional evidence for evaluating the development and maturity of the current structure. The analysis then shifts from proportional assessment to the explicit structural confirmation and invalidation conditions defined by Price and Time.
The analysis now shifts from structural identification to structural confirmation.
12. Structural Confirmation and Invalidation — 4H
The current structural hypothesis remains conditional upon the joint validation of Price and Time.
Price Confirmation
The critical structural boundary is:
$3.35
A confirmed upside break above $3.35 would retrace the entire Micro-degree Omega decline and provide the structural evidence required to confirm completion of .
Until this level is decisively reclaimed, the current $2.69 low remains a structural hypothesis rather than a confirmed terminal point.
Temporal Confirmation
The reversal must also develop within the established temporal boundaries:
0.5 Temporal Boundary — 17 September 2026
1.0 Temporal Boundary — 12 October 2026
These boundaries define the expected temporal maturity of the current structure. The confirmation condition is therefore:
Price > $3.35 + Upside Break Before 12 October 2026
When this condition is satisfied, the low of is confirmed and the next structural phase is activated:
→
Conversely, if the reversal fails to establish itself before the final temporal boundary of 12 October 2026, the present reversal hypothesis loses validity and the second-degree structure must be reassessed or redefined.
The two components therefore serve different functions:
$3.35 determines structural confirmation.
The temporal boundaries determine whether that confirmation occurs within the expected structural maturity.
13. Time–Price Convergence and Conditional Scenario
Once is confirmed, the subsequent development of is governed not only by the price breakout itself, but also by the timing of that breakout.
An earlier recovery through $3.35 implies greater temporal acceleration and therefore a greater potential for expansion toward higher price horizons. A later recovery leaves less temporal capacity for the subsequent structure and correspondingly reduces its potential range.
The relationship can therefore be expressed as:
Earlier Breakout
→ Greater Temporal Acceleration
→ Greater Upside Potential
Later Breakout
→ Lower Temporal Acceleration
→ More Limited Upside Potential
The activation of therefore depends on both whether $3.35 is reclaimed and when that recovery occurs within the established temporal window.
Once the structural and temporal conditions are satisfied, the conditional Fibonacci objectives associated with become active:
0.382 — approximately $3.90
First Structural Objective
The initial upside station following confirmation.
0.618 — Primary Hypothetical Objective
The principal projected objective. Its relevance depends directly on the temporal acceleration of the breakout.
0.786 — approximately $5.90
Secondary Expansion Objective
A higher structural horizon that becomes relevant if the reversal develops with sufficient momentum and temporal efficiency.
1.000 — approximately $7.30
Terminal Price Boundary
The upper boundary of the current hypothetical upside model.
These levels are conditional structural objectives, not fixed forecasts. Their activation requires confirmation of together with a valid upside break above $3.35.
[FIGURE 8 — Conditional Upside Objectives]
14. Integrated Structural Sequence
The entire analysis can now be represented as a continuous structural hierarchy:
3M — Macro Architecture
→ → → →
↓
1M — Internal Architecture of
→ → → ? →
↓
1D — Internal Architecture of ?
(α) → (β) → (γ) → (δ) → (ω)
↓
4H — Immediate Internal Architecture
α → β → γ → δ → ω
↓
Confirmation Mechanism
$3.35 + Temporal Validation
↓
Conditional Activation
→
This hierarchy is important because the lower-degree structures do not independently confirm the higher-degree terminal point. Instead, they progressively establish the structural evidence required for a higher-degree confirmation. The final confirmation therefore occurs only when the lower-degree reversal develops sufficiently to reclaim the decisive higher-degree boundary.
15. Final Structural Assessment
Natural Gas is currently positioned at a critical decision point within its long-term structural architecture.
The 3M chart identifies a five-phase neutral configuration, with representing the fifth and final macro phase.
Within , the 1M timeframe presents a contracting five-phase configuration whose fourth phase, ?, has reached a potentially terminal region.
The 1D and 4H structures both resolve into declining five-phase sequences, with the latest low established around $2.69. These lower-degree structures provide the basis for considering the current decline potentially complete, but they do not independently confirm the higher-degree termination.
The decisive confirmation level remains:$3.35
A successful recovery and breakout above this level, within the established temporal boundaries, would confirm the completion of and activate the next structural phase:
The principal temporal boundaries are:
17 September 2026 — 0.5
12 October 2026 — 1.0
Following confirmation, the conditional upside structure extends through the projected Fibonacci price horizons of approximately:
$3.90 → $5.90 → $7.30
with the magnitude of the move conditioned by the temporal speed of the initial breakout.
The market therefore remains in a conditional transition state: ? → Confirmation above $3.35 → Activation → Time-Dependent Upside Expansion
Until that confirmation occurs, the current low remains a structural hypothesis rather than a confirmed terminal point.The analytical framework therefore does not define a fixed directional forecast. Instead, it defines a conditional structural pathway in which Price determines confirmation, Time determines structural maturity, and the convergence of both determines the potential development of the next phase.
Gold Price Forecast | Oil | Dollar | Silver | Natural Gas.Gold Price Forecast | Oil | Dollar | Silver | Natural Gas.
0:00 Introduction & Overview
0:28 Natural Gas (NG) Technical Analysis NYMEX:NG1!
3:30 Crude Oil (WTI) Technical Analysis NYMEX:CL1!
6:02 US Dollar Index (DXY) Outlook
7:02 Gold (XAU) Technical Analysis COMEX:GC1!
9:22 Silver (XAG) Technical Analysis COMEX:SI1!
Natural Gas 1H — Mixed Signals: Long Exit and Early Short RotateNatural Gas Futures (1H) has delivered a strong and clean long trend starting on August 26, with price maintaining momentum for several sessions.
However, the current structure may be entering a potential slowdown phase, with early signs of exhaustion appearing near the recent highs.
Our advanced invite‑only indicator shows mixed signals across its three operational modes:
Reactive — currently detecting a possible short rotation, suggesting early momentum reversal.
Balanced — also signaling potential short‑side pressure, aligning with Reactive.
Conservative — has already printed an exit from the long, but is still waiting for stronger confirmation before validating a full short cycle.
This divergence between modes highlights a phase of uncertainty:
Reactive and Balanced are leaning toward early short rotation, while Conservative remains cautious and confirmation‑driven.
Monitoring the alignment between 1H, 4H, and 1D timeframes will be essential in the coming sessions.
A confirmed short rotation on 1H could extend into 4H, while failure to follow through may simply result in a temporary pause within the broader trend.
For now, Natural Gas remains at a decision point:
• Continuation of the long trend if momentum rebuilds
• Start of a new short cycle if early signals gain confirmation
The next few candles will likely define the direction for the upcoming days.
HHNGAS:Profit target hit. The Freeport Pin was pulled.This video consists of an update of the Henry Hub Natural Gas trade strategy that was presented on 25 August 2026 when a bull flag pattern with the flag pole from $3.20 to $2.60, three weeks of tight consolidation within the range and freeport LNG maintenance, being a pin and forcing prices below equilibrium, were spotted. The pin was broken early-cycle LNG feedgas demand nominations reached 6-week highs as freeport was recovering and Corpus Christi's train 7 was pushing record flows at the same time. The bull flag pattern broke out exactly as expected, prices rose from $2.74 to $2.946 and the first target of $2.976 was achieved. This video describes the updates of the trailing stop, why the TEMA 9 at $3.073 is the next level to be cleared and what the second target of $3.20 and the extended target of $3.44 require in this situation. If you are trading energy commodities or just trying to learn how a bull flag pattern and LNG catalysts work in the market environment, you may find this video useful.
Gold Price Forecast | Oil | Dollar | Silver | Natural Gas. Gold Price Forecast | Oil | Dollar | Silver | Natural Gas.
0:00 Introduction & Overview
0:20 Natural Gas (NG) Technical Analysis NYMEX:NG1!
3:47 Crude Oil (WTI) Range & Catalyst Outlook NYMEX:CL1!
4:48 US Dollar Index (DXY) & Fed Hawkishness
6:01 Gold (XAU) Chart Setup & Key Support COMEX:GC1!
8:11 Silver (XAG) Levels & Final Thoughts COMEX:SI1!
NG1! SELLERS WILL DOMINATE THE MARKET|SHORT
NG1! SIGNAL
Trade Direction: short
Entry Level: 2.881
Target Level: 2.780
Stop Loss: 2.947
RISK PROFILE
Risk level: medium
Suggested risk: 1%
Timeframe: 1h
Disclosure: I am part of Trade Nation's Influencer program and receive a monthly fee for using their TradingView charts in my analysis.
✅LIKE AND COMMENT MY IDEAS✅
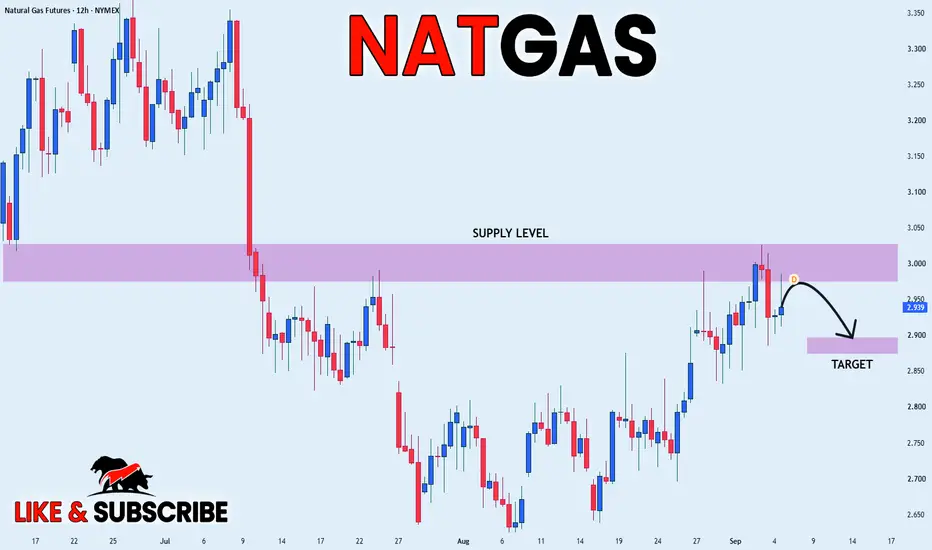
NATGAS Risky Short! Sell!
Hello,Traders!
NATGAS is failing to reclaim the horizontal supply area after a liquidity grab, while renewed distribution and bearish pressure favor continuation toward the lower demand area.Time Frame 2H.
Sell!
Comment and subscribe to help us grow!
Check out other forecasts below too!
HHubNatGas: Bull flag, $12 spread with europe here is the tradeThis video has an analysis on Henry Hub Natural Gas as well as the trade setup that I have created as of 25 August 2026, the week prior to Freeport LNG which is one of the biggest US LNG export terminals to have completed their maintenance process where they have taken away 2 Bcf a day of feedgas requirement from the domestic market from mid-August, hence keeping the price of Henry Hub at $2.74 while TTF gas from Europe is at $14.80 – that’s a $12 spread making every additional Bcf of US LNG export capacity extremely profitable. The chart has formed a classic bull flag pattern in the last 3 weeks flagpole formation from $3.20 to $2.60, consolidation pattern holding the same range, positive bars showing on the MACD histogram and RSI at 45 level. In this video, I go through the pattern, the Freeport catalyst, entry area, 3 targets and the stop loss. If you trade energy commodities or just want to learn about the combination of bull flag patterns and fundamental catalysts, you will enjoy this video.
HHNGAS at $2.74 while Europe pays $14.80.Why this is the trade?The most fundamentally divided energy commodity right now is Henry Hub natural gas — and that fundamental split is the trade. US production and inventories forecasted to reach an unprecedented 3,985 billion cubic feet at the end of October;5% above the five-year average;have forced the EIA to slash its forecast for Henry Hub prices in 2026 by more than 6% to $3.44 per MMBtu. That is the bearish narrative. But beneath it lies a catalyst that the market has priced only marginally. The Freeport LNG plant has been shut down since mid-August, reducing daily US feedgas demand by around 2 billion cubic feet and pushing Henry Hub prices below their natural equilibrium. However, the EIA is forecasting the shutdown to end in late August, which will instantly bring US natural gas into the international market where TTF in Europe trades at $14.80 per MMBtu and Asian JKM prices are even higher. A price difference of close to $12 per MMBtu makes any extra US LNG export capacity incredibly valuable to terminal operators. The market is trading at $2.739 because of bearish fundamentals. It is there because Freeport's maintenance has temporarily severed the transmission mechanism between the European supply crisis and US prices. When that restarts;the equilibrium shifts materially.
Meanwhile, a southern heat dome is driving robust cooling demand, keeping power On the other hand, the south heat dome has pushed up the cooling demand and thus pushed up the power production by 15%. The price is not bearish at $2.739; it only marks the Freeport’s maintenance period that has reduced the usual demand push linking the supply shortage problem in Europe to the price in the US market.Equilibrium-wise, the market is not in a downward movement but a coiling movement. Over the last six weeks, there has been a bull flag formation. The formation starts with a sharp drop from $3.20 on July to $2.60 in August and then a consolidation of three weeks between $2.60 and $2.95. Technical indicators wise, the equilibrium is set at $2.876 while the key resistance levels for a breakout will be at the 50 EMA ($3.082) and 200 EMA ($3.447).
Trade recommendation
Direction : Long,buy the bull flag breakout
Entry horizon : $2.739 – $2.80
Primary target : $2.976
Secondary target : $3.20
Stop loss : Daily close below $2.60
Key catalyst : Freeport LNG maintenance conclusion;late August
Technical scenarios
Freeport restart triggers bull flag breakout : Freeport’s late-August maintenance conclusion restores ~2 Bcf/day of demand. With European TTF/Henry Hub spreads highly attractive, a catalyst-driven break above the $2.95 flag channel is expected. Target: $3.20 (retest) and $3.44 (200 EMA).
Persistent heat yields slow grind : An extended southern heat dome through September supports demand and curbs storage injections. Expect a gradual rise toward $2.976, lacking the immediate volatility of a Freeport-led breakout.
Storage overhang invalidates trade : Failure of the Freeport catalyst or premature heat relief leaves the market vulnerable to the EIA’s projected storage surplus. A daily close below $2.60 breaks the flag, signaling distribution and invalidating the long setup.
The 3 Steps To Short SellingI am feeling very sad because
i am falling for the wrong
type of ideas..
Have you ever had an idea
and then you know you are right
but doubt creeps?
When you are trading you should
not allow any space for doubt you
need to know what you are doing
Remember the steps?
Price below the 13 EMA
Roc(2) above zero
bearish candle stick pattern -in this case it looks like the evening star
Remember to trade safe
Rocket boost this content to learn more
Disclaimer:Please use a simulation trading account
first before you trade with real money
because trading is risky
Gold Price Forecast | Oil | Dollar | Silver | Natural Gas.Gold Price Forecast | Oil | Dollar | Silver | Natural Gas.
0:00 - Introduction & Video Overview
0:20 - Natural Gas Technical Analysis & Key Support Levels NYMEX:NG1!
3:05 - Crude Oil (USO) & Dark Pool Activity NYMEX:CL1!
4:56 - US Dollar Index (DXY) & Fed Intervention
6:05 - Gold Breakout & Price Targets COMEX:GC1!
8:05 - Silver Analysis & Major Resistance Levels COMEX:SI1!