RB Long — RB shrugs off a failed breakdown and reclaims structurThis is a structural pullback play showing resilience, highlighted by a failed breakdown on the 1h trigger. Undeterred by the lack of fresh fundamental catalysts, the setup leans on clean price action and a favorable 1.5R profile to target overhead resistance. We will take this on pure structure given the manageable extension and supportive underlying intraday momentum.
📍 Entry: 3.1008
🛑 Stop: 3.0546
🎯 Target: 3.1700
⚖️ R:R: 1.50
RBOB Gasoline Futures (Nov 2027)
No trades
No trades
In-depth trading ideas
Why Are RBOB Gasoline Futures Surging Despite EPA Waivers?Regulatory Waivers Fail to Tame Prices
U.S. gasoline spot prices climbed 87 to 119 cents per gallon across major regional benchmarks in 2026. Environmental Protection Agency waivers expanded butane blending limits to lower pump costs. Yet market fundamentals completely overrode federal regulatory intervention. Shrinking national inventories and elevated crude costs pushed New York Harbor RBOB futures significantly higher. Traders now focus on fundamental supply constraints rather than policy announcements.
Geopolitics and Global Supply Disruption
Middle East tensions severely disrupt global oil shipping routes. Concerns around the Strait of Hormuz restrict crude supplies from overseas producers. U.S. Gulf Coast refiners aggressively export gasoline to meet booming European and Latin American demand. Elevating exports drains domestic Atlantic Coast reserves. Geopolitical friction firmly anchors a bullish risk premium into RBOB futures pricing.
Refining Trends and Yield Optimizations
Modern refiners face unprecedented operational friction during summer driving months. High ambient heat strains cracking units and reduces refining yield efficiency. Refiners balance production between reformulated blendstock and aviation fuels. Facilities favor high-margin distillates over basic gasoline blends during global supply panics. These operational trade-offs create localized supply bottlenecks in key consumption hubs.
High-Tech Patents and Molecular Blending
Energy companies secure patents for advanced molecular blending algorithms. Modern refining software calculates real-time vapor pressure metrics for summer RBOB compliance. High-tech catalysts maximize octane yields while minimizing carbon emissions during catalytic cracking. Digital twin models predict refinery component fatigue before mechanical failures occur. Advanced patent estates protect proprietary chemical formulations across global energy conglomerates.
Cybersecurity and Critical Energy Defense
Refining infrastructure represents a high-priority target for hostile cyber actors. Operators integrate automated intrusion detection into industrial control systems. Ransomware attacks on fuel pipelines can freeze regional distribution within hours. Robust cybersecurity architectures defend SCADA networks against remote state-sponsored sabotage. Secure digital systems ensure reliable physical flow from refinery gates to pipeline terminals.
Macroeconomic Inflation and Federal Policy
RBOB gasoline futures serve as a key leading indicator for broader inflation metrics. Elevated transport fuel costs increase shipping expenses across every physical supply chain. The Federal Reserve closely monitors energy price spikes during monetary policy evaluation. High gasoline prices reduce consumer discretionary spending power across domestic retail sectors. Persistent fuel inflation complicates central bank efforts to stabilize interest rates.
Science, Petrochemicals, and Pharmaceutical Links
Gasoline refining generates essential chemical byproducts for secondary industrial manufacturing. Catalytic reforming yields aromatic hydrocarbons like benzene, toluene, and xylene. The pharmaceutical industry relies on these chemical feedstocks to synthesize active drug ingredients. Medical device manufacturers use refined polymers to produce sterile diagnostic equipment. Stable RBOB refining economics directly support critical pharmaceutical supply chains.
Strategic Leadership in Energy Markets
Refinery executives must navigate strict regulatory shifts and volatile input costs. Forward-thinking management teams invest heavily in AI-driven algorithmic trading desks. These platforms hedged futures contracts effectively against extreme volatility spikes in 2026. Strategic leadership balances immediate shareholder distributions with long-term refining decarbonization goals. Flexible operational models separate market leaders from struggling legacy refiners.
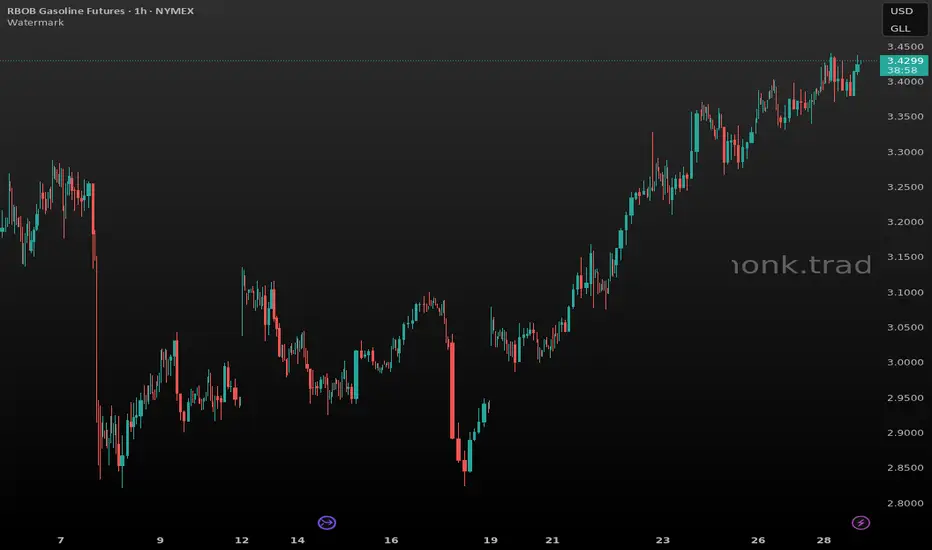
RB Long — Failed breakdown on the 1H flips this pullback into a…A pristine 4-hour bullish structure meets fundamental seasonal tailwinds as energy markets price in spring demand. The textbook 1-hour failed-breakdown trigger and robust 2.64R profile provide a high-quality entry for this structural long. We are taking this as the technical geometry and macro seasonality align perfectly.
📍 Entry: 3.4031
🛑 Stop: 3.3535
🎯 Target: 3.5340
⚖️ R:R: 2.64
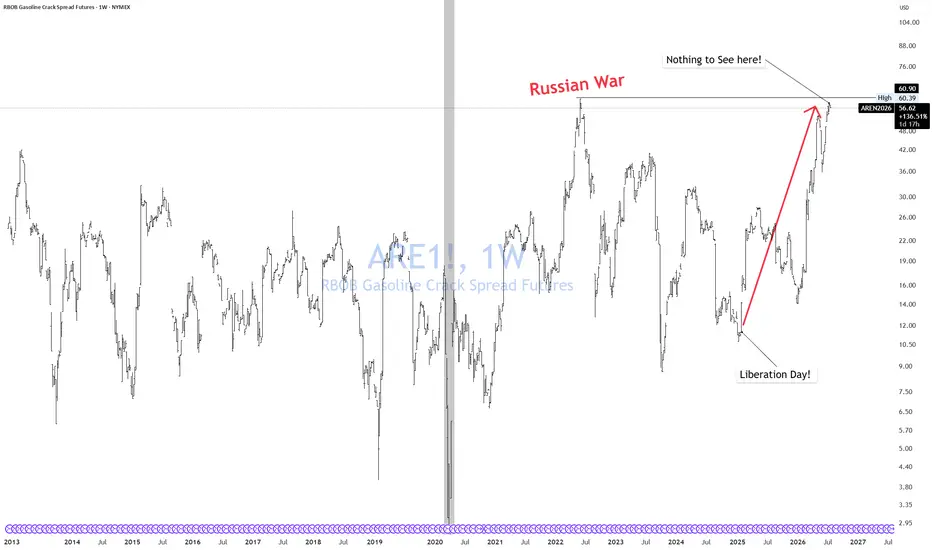
CRACK! Spread.The gasoline crack spread is approaching the same level reached after Russia invaded Ukraine—even though the disruption from Iran is far worse.
This isn’t booming demand. Refineries are already running near full capacity while war, damaged infrastructure and disrupted shipping have created a shortage of finished fuel.
Yet crude oil remains strangely disconnected from the fuels consumers actually use. The Trump regime’s manipulation of the headline oil price is now front and center.
The world doesn’t run on crude oil. It runs on gasoline, diesel and jet fuel—and that is where the real shortage is showing up.
If crude oil is genuinely bearish, why are refiners being paid nearly $60 a barrel to turn it into gasoline? 😆
Ticking Time bomb!
If you enjoy the work: 👉 Drop a solid comment. Let’s push it to 7,000 and keep building a community grounded in raw truth, not hype.
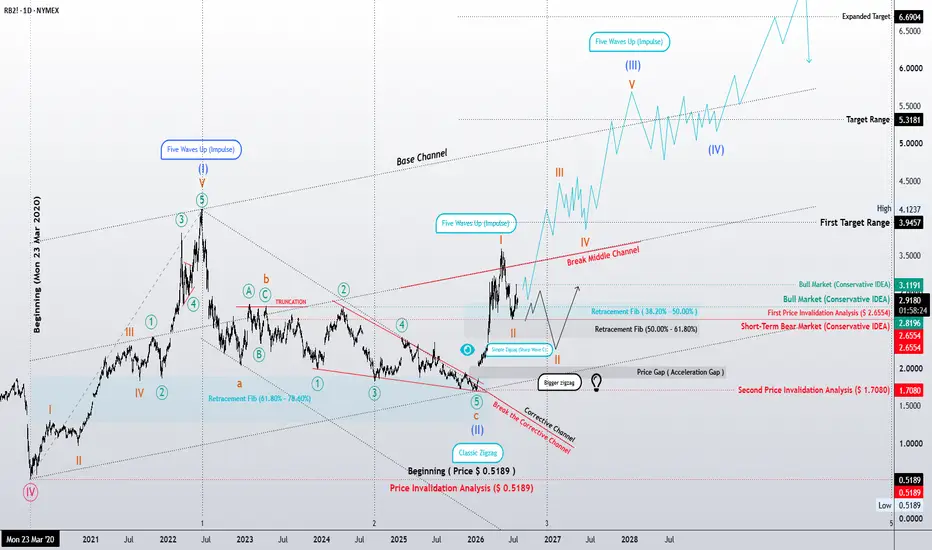
Elliott Wave Analysis | Preparing for Wave (III)?RBOB Gasoline (RB2!) Daily Chart
Following the completion of a Classic Zigzag correction, RBOB Gasoline appears to have broken above its corrective channel, suggesting that the larger bullish trend may have resumed.
My preferred wave count considers Wave (II) complete, with the current advance representing the early stages of Wave (III). If this interpretation is correct, the market may currently be developing Waves 1 and 2 before the strongest portion of the trend begins.
The initial impulsive rally has already demonstrated encouraging strength. However, before the next major advance unfolds, a temporary pullback would remain entirely consistent with Elliott Wave guidelines. The ideal retracement zone for Wave 2 lies between the 38.2% and 50.0% Fibonacci retracement levels, while a deeper correction toward 50.0%–61.8% would still preserve the bullish structure.
An additional technical factor supporting this scenario is the presence of what may become an Acceleration Gap. If this gap continues to hold, it would reinforce the view that bullish momentum is strengthening rather than fading.
From this point forward, maintaining price above the first invalidation level keeps the primary bullish scenario intact. As long as that level remains respected, the market could continue building the foundation for a much larger impulsive advance.
If Wave (III) develops as expected, the first objective would be the initial target zone, followed by higher Fibonacci expansion levels as the impulse matures. While the exact path will depend on future price action, the overall structure continues to favor the bullish scenario.
As always, this is a probability-based Elliott Wave interpretation rather than a prediction. The market itself will determine whether this wave count continues to validate or whether an alternative structure begins to emerge.
Patterns whisper. I listen.
— Mr. Nobody
No Lead Gasoline
Jun 15
NOLEADGASOLINE (4H) | Updated Elliott Wave Roadmap
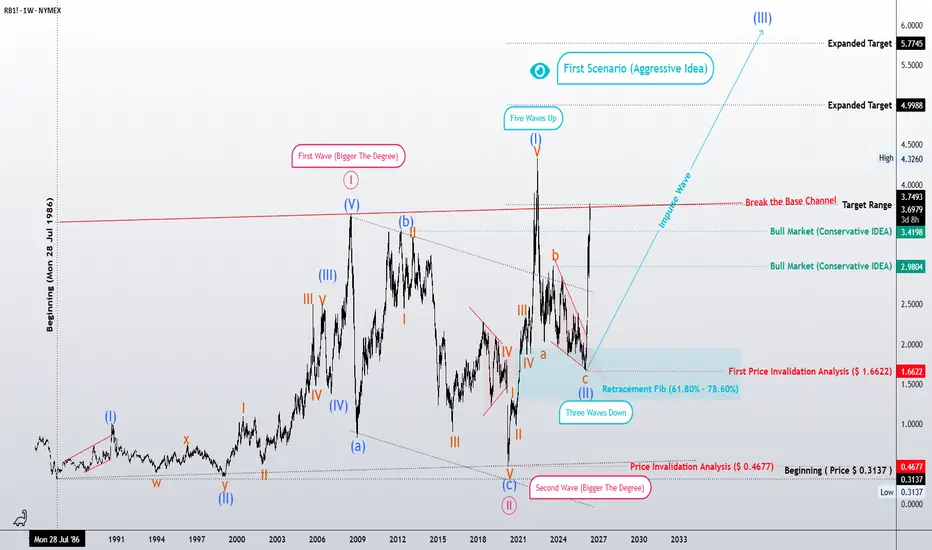
Weekly Chart – Elliott Wave Analysis | Final Supercycle Advance?RBOB Gasoline (RB1!) Weekly Chart – Elliott Wave Analysis | Final Supercycle Advance?
As one of crude oil's primary refined products, RBOB Gasoline has historically maintained a strong structural relationship with the broader oil market. Although its long-term historical data is less complete than crude oil itself, the existing price structure still provides a meaningful Elliott Wave framework.
My primary interpretation suggests that the market is currently developing the final motive wave of a larger Supercycle advance. Under this wave count, Waves (I) and (II) of Primary Wave V appear to be complete, while the current advance is likely forming Waves 1 and 2 of the larger Wave (III). If this interpretation proves correct, the market could be entering the strongest portion of the bullish trend, where momentum typically accelerates and price expansion becomes more pronounced.
One noteworthy characteristic is the strength of Wave (I), which advanced with exceptional momentum. The subsequent Wave (II) completed its correction almost precisely near the territory of the previous impulse's internal Wave 4, a behavior that aligns well with one of Elliott Wave's well-known guidelines and may indicate that the dominant trend remains intact.
From a Fibonacci perspective, I remain open to the possibility that Wave (III) may extend only to approximately 61.8% of the length projected from the previous motive sequence. If so, the final Wave (V) could terminate near the 78.6% Fibonacci extension relative to the completed (I)-(II) structure. While this would represent a more conservative bullish outcome than many extended fifth-wave scenarios, it would still be fully consistent with a valid impulsive structure.
Another important technical observation is the structure of Wave (II) itself. It appears to have unfolded as a Classic Zigzag, with Wave C terminating in an Ending Diagonal. Once this terminal pattern was completed, price quickly resumed its impulsive advance. Within Elliott Wave Principle, this type of transition is often viewed as a strong indication that the correction has likely ended and that the broader bull market is resuming with renewed strength.
As always, this remains a probability-based Elliott Wave scenario rather than a prediction. The market will ultimately determine whether this wave count continues to validate itself or whether an alternative structure begins to emerge.
Patterns whisper. I listen.
— Mr. Nobody
CFDs on Brent Crude Oil
Jun 6
Crude Oil: The Long-Term Elliott Wave Projection
Crack spread and crude oil priceHistorically, we have seen crack spreads drop without a recession in two specific ways:
The "Supply Shock" Reversal: If geopolitical bottlenecks ease—such as a resolution to the Strait of Hormuz tensions that heavily impacted 2026 energy markets—or if sanctioned Russian/Iranian products flow more efficiently via secondary markets, product supply surges.
The Crude-Led Squeeze: Ironically, if crude oil prices skyrocket too fast due to tight upstream supply (e.g., OPEC+ cuts), refiners often cannot pass the cost onto consumers quickly enough. This causes the crack spread to collapse because crude rises faster than gasoline/diesel, leading to negative margins without a drop in fuel consumption.
The Demand Destruct Scenario
Your thesis focuses on a demand-driven collapse. If crack spreads drop because consumers stop buying gasoline and factories stop using diesel, that is an unmitigated recessionary signal.
When a recession hits, absolute crude prices drop, but product prices drop faster, crushing the crack spread.
This forces the central bank into emergency mode, cutting interest rates to save the economy.
As real yields plunge during those rate cuts, gold typically enters a massive secular bull market.
Can RBOB Gasoline Futures Predict the Next Recession?RBOB gasoline futures serve as a critical economic pulse. Refiners, traders, and policymakers watch this CME Group benchmark closely. Sudden price shifts reverberate across the global financial system.
The Macroeconomic Illusion of Cheap Fuel
Falling pump prices often signal financial relief for consumers. However, central banks look much deeper.
The Federal Reserve focuses primarily on core inflation. This metric deliberately excludes volatile food and energy costs. Therefore, tumbling RBOB futures do not guarantee immediate interest rate cuts.
Cheap gasoline can boost discretionary spending elsewhere. This shifts inflationary pressures to services and sticky goods. Investors must not mistake cheaper fuel for guaranteed monetary easing.
Geopolitical Chokepoints and Sovereign Strategy
Global friction continuously threatens energy markets. RBOB futures react instantly to geopolitical updates.
Conflict in the Middle East threatens vital shipping lanes. Cartels like OPEC+ manipulate crude supply to control global prices. Meanwhile, nations weaponize refining capacity as strategic leverage.
Western economies must secure domestic refining infrastructure. Dependency on foreign energy infrastructure creates systemic economic vulnerabilities.
Disrupting Retail and Corporate Business Models
Gasoline acts as a powerful customer acquisition tool. Retail giants like Costco use cheap fuel to drive foot traffic. This strategy historically boosts membership renewals and inside-store sales.
However, this secret growth engine faces immediate headwinds. Shifting consumer habits and electric vehicles alter traditional volume trends. Companies must reinvent their fuel-dependent business models to survive.
High-Tech Trading and the Cybersecurity Threat
Technology dominates modern energy trading. Algorithms execute RBOB futures trades in milliseconds on CME platforms. High-tech infrastructure also optimizes pipeline distribution systems.
Yet, this digital transformation invites severe cybersecurity risks. Hackers regularly target energy grids and critical pipelines. A single breach can freeze regional supplies and spike futures prices. Robust cyber defense remains an absolute commercial necessity.
Leadership and Culture in Transition
Energy executives face unprecedented structural disruption. Corporate leaders must foster an innovative culture. Traditional oil firms are transitioning into diversified energy providers.
Forward-thinking management prioritizes operational agility and sustainability. Cultivating tech-savvy talent accelerates this vital corporate evolution. Leaders who resist change risk obsolescence in a decarbonizing world.
Chemical Science and the Pharmaceutical Nexus
RBOB stands for Reformulated Blendstock for Oxygenate Blending. The underlying science requires precise chemical engineering. Refiners continuously patent new additive blends to reduce emissions.
Interestingly, gasoline refining shares a deep connection with pharmaceuticals. Refining byproducts provide essential chemical precursors like benzene. Drug manufacturers utilize these components to synthesize vital medications. Patent analysis reveals increasing cross-industry collaboration in chemical synthesis.
DINO carrying temporary idiosyncratic discountmarket temporarily treated DINO as:
a company-specific risk story,
not:
a pure refining-margin proxy.
So even though:
diesel strong,
crack spreads strong,
refining macro supportive,
DINO had:
refinery fire concerns,
CEO departure,
CFO uncertainty,
governance overhang.
sector economics are stronger than DINO stock action
Betrakon: Weekly Diesel Elliott Wave BreakdownAlright—here’s the weekly diesel story, and yeah… it’s got teeth. 😄🌊
This whole move starts back on July 28, 1986 at about
0.3137
0.3137∗∗.From there, the market build sanearly∗∗5−waveimpulse∗∗,pushing the price to the∗∗
3.6481 area by June 14, 2008—clean, textbook, no questions asked. 🚀
Then the bigger picture gets more serious: we see a higher-degree complex correction, the kind that doesn’t just “pull back”… it resets the structure.
Next, the key invalidation level shows up around $0.4677 (from March 20, 2020)—and real talk? It’s very unlikely we’ll come back to that. That level is basically the market’s “don’t even try it” line. 🚦
After that, the market puts in another motive 5-wave run, climbing to the historic high near $4.3280 on May 31, 2022. And just when you think it’s done flexing… the correction arrives.
The recent pullback was a classic 3-wave zigzag, landing into the $1.6641 zone around January 5, 2026, finishing right inside the 61.8%–78.6% Fibonacci retracement pocket. That’s not luck—that’s structure doing its job. 🎯
Now the current setup? The motive wave in motion is strong, and it’s getting confirmation. This isn’t just a “maybe” move—price is behaving like it’s already passing through deeper corrective territory. The wave count is demanding respect. 🔥
Targets (Arithmetic Chart):
First resistance target at $3.7493 — already broken ✅
Next: $4.9988 (Expanded Target)
Then: $5.7745
And if you’re going for the longer-distance dream targets? Do yourself a favor and use the logarithmic chart—weekly long-term structure tends to make way more sense there. 🧠📈
So yeah… I’m “Mr. Nobody.”
But the market has a language—and the waves are whispering. I’m just listening… one step at a time. 😉🌊
Hey man, just wanted to give you a heads-up! Because of the internet situation here in Iran, I can’t always hop on TradingView. So while I can read all your awesome comments on the charts your friends share, sometimes my replies don’t send out. Just wanted you to know what’s up! 😉
RB Long — $RBM26 pullback into breakout shelf as energy complex Setup: HTF (4h) shows a powerful impulsive leg from the ~2.80 April lows through 3.40+, making higher highs and higher lows — clear uptrend. The April 28 session opened with a spike to 3.44 then pulled back intraday to the 3.37-3.38 zone, which aligns with the prior day's consolidation shelf and the 1h breakout base from Apr 27 morning. Current price at 3.4307 is recovering from that intraday dip with green candles reasserting. Volume on the Apr 22-23 breakout leg was the strongest in the window (~4-6k contracts/hour), confirming institutional participation in the trend.
Flow: Energy complex is broadly bid — RBOB +1.85% with crack spreads supporting. Risk-off commodity divergence (energy/ags up, metals/equities down) is a strong macro tailwind. The energy bid is not a single-session spike; it's building over multiple days with corroborating crude strength. This is the sector to be long, and RBOB is the leading contract.
Plan: Stop is placed below the intraday pullback low and the Apr 27 consolidation zone — a close below there invalidates the bullish continuation structure and suggests a deeper retracement toward 3.30. Target is the next psychological and technical extension level — the trend has been adding roughly 6-8 cents per leg, and 3.48 represents the next clean measured move. Thesis fails if price breaks and closes below the 3.34 shelf on a 1h basis.
📍 Entry: 3.372
🛑 Stop: 3.348
🎯 Target: 3.48
⚖️ R:R: 4.50
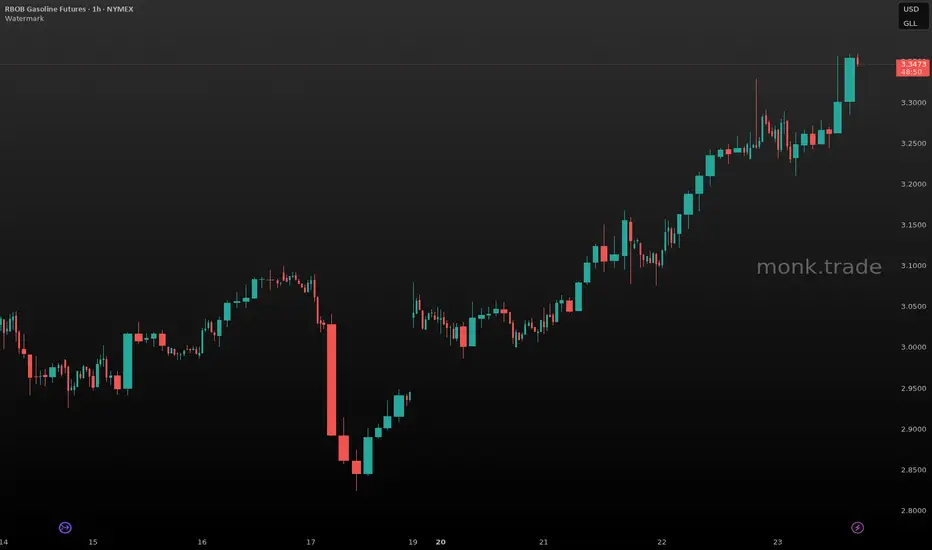
RB Long — RB breaking out to new multi-week highs on energy-specSetup: On the 4h, RB has been in a clear uptrend since the Apr 17 spike low near 2.84, printing higher lows and higher highs through the 3.00, 3.10, and 3.20 levels. The 1h shows an impulsive leg launching from the 3.10 consolidation zone on Apr 22, with successive breakout candles through 3.20, 3.25, and now pushing toward 3.35+. The Apr 23 session has seen multiple strong green closes with expanding volume — the 11:00 and 12:00 bars printed the highest volume of the recent run (~4100 and ~6000 contracts) with closes well above opens, confirming buyer conviction at the breakout. Price is currently pressing against the recent session high with no exhaustion wicks visible yet.
Flow: Energy-specific strength is the dominant driver — RB and CL ripping +3%+ while broader macro (equities, crypto) trades risk-off suggests crack spread expansion or seasonal demand dynamics rather than a macro bid. This kind of divergence from the tape typically reflects real commodity demand flow rather than risk-on positioning, giving the move more durability. The volume surge on today's breakout bars aligns with institutional participation.
Plan: Stop is placed below the breakout shelf from the Apr 22-23 consolidation band — a close back into that range would invalidate the breakout thesis. Target is the next clean psychological and structural level above, where the HTF chart shows no prior congestion. Given the extended intraday run, entry is at market with a short TTL — if price fades materially before fill, the setup loses its edge.
📍 Entry: 3.3447
🛑 Stop: 3.31
🎯 Target: 3.42
⚖️ R:R: 2.17
GASOLINE targeting its 1W MA100. Buy.Gasoline (RB1!) has been trading within a 3-year Channel Down and is currently on the latest Bullish Leg that is about to test the 1W MA50 (blue trend-line). All previous Bullish Legs have hit at least the 0.618 Fibonacci retracement level and the 1W MA100 (green trend-line) at the same time.
As a result, we expect this Bullish Leg to continue rising towards the 1W MA100 - 0.618 Fib, targeting 2.0845. If the 1W RSI hits its 60.20 Resistance though first, it will be a signal to sell regardless of the price.
---
** Please LIKE 👍, FOLLOW ✅, SHARE 🙌 and COMMENT ✍ if you enjoy this idea! Also share your ideas and charts in the comments section below! This is best way to keep it relevant, support us, keep the content here free and allow the idea to reach as many people as possible. **
---
💸💸💸💸💸💸
👇 👇 👇 👇 👇 👇
downtrend might be continuing : tight entry opportunity1->3 : number 2 proven sellers
3->4 : return to proven sellers
next ?
*downtrend continuation idea
* rsi 2nd degree h.divergence
*mfi 3rd degree h.divergence
* obv BB band upper 2nd standard
deviation predicting selling interest
*1st standard dev. vwap auto anchord on local high
RB - US Gasoline Futures to Decline due to Lower ConsumptionNYMEX: RBOB Gasoline Futures ( NYMEX:RB1! )
WTI crude oil futures declined 13.4% since the beginning of the year. It dropped as much as $20 from the mid-January peak of $80 a barrel, before recovering to $64 last week.
In my commentary on February 11th, “Reversal of US Energy Policy Could Push Crude Oil Lower”, I described the main reasons behind the oil market correction:
• US oil production will rise, benefiting from the new energy policy by President Trump as “Drill Baby Drill”
• OPEC+ to increase crude oil production, ending its voluntary production cuts
• Threats of Tariffs could curtail global oil demand
First, on March 31st, the U.S. Energy Information Administration (“EIA”) reported that U.S. field production of crude oil reached 13.146 million barrels per day (mb/pd), up 592 mb/pd or +4.7% from the year-ago level. This is the highest January production level since 1920!
Second, on April 3rd, the OPEC+ members met and decided to end the voluntary production cuts, gradually bringing back 2.2 mb/pd additional supply to the oil market.
Third, Reciprocal Tariff has brought the container shipping industry to its knees. MSC, Maersk, CMA CGM, and Hapag-Lloyd, which ferry goods for retail giants like Walmart, Target, and Home Depot, have seen sharp declines in booking. The tariff uncertainty caused many importers to cancel their orders. This could cause major consequences.
According to Statista, about 71% of the items sold on Amazon were sourced from China. The procurement for Christmas-season products has already begun. Without a US-China trade deal, US consumers could expect fewer gift options at higher prices. Inflation could rebound sooner, as merchants deplete their inventory and face a supply shortage.
This could hurt gasoline demand. On the one hand, higher shopping costs cut into consumer spending budget; on the other, fewer deals at retailers discourage shoppers from taking a trip.
On April 18th, American Automotive Association (“AAA”) reported that national average price for regular gas was $3.182 per gallon, down 14% from the year-ago level.
On April 19th, RBOB gasoline futures quoted $2.0839 per gallon, up 1.8% year-to-date. This contrasts sharply with the down trends in the spot market and the oil futures market.
The April EIA Short-Term Energy Outlook (“STEO”) report states that U.S. retail price for regular gasoline averages $3.10 per gallon in its forecast for this summer (April–September), about 20 cents less than the previous forecast in March. The lower price forecast mostly reflects the expectation of lower crude oil prices. If realized, the forecast gasoline price would be the lowest inflation adjusted summer average price since 2020.
In my opinion, gasoline prices could stay relatively high during the peak summer driving season. After that, Gas prices could turn significantly lower through the end of the year.
Commitment of Traders shows bearish sentiment
The CFTC Commitments of Traders report shows that on April 15th, total Open Interest (OI) for NYMEX RBOB Futures is 418,277 contracts. “Managed Money” (i.e., hedge funds) own 52,114 in Long, 36,615 in Short and 47,628 in Spreading positions.
• While they maintain a long-short ratio of 1.4:1, hedge funds have reduced long positions by 5,198 (-9%) while increasing short positions by 6,021 (+14%).
• This indicates that “Smart Money” is becoming less bullish on gasoline.
Trade Setup with RBOB Futures
If a trader shares a similar view, he could express his opinion by shorting the NYMEX RBOB Gasoline Futures ( CSE:RB ).
RB contracts have a notional value of 42,000 gallons of gasoline oil. With Friday settlement price of $2.0149, each September contract (RBU5) has a notional value of $84,626. Buying or selling one contract requires an initial margin of $5,840.
Hypothetically, a trader shorts September RB contract and RBOB prices drop to $1.90. A short futures position would gain $4,826 (= (2.0149 – 1.90) x $42000). Using the initial margin as a cost base, a theoretical return would be +82.6% (= 4826 / 5840).
The risk of shorting gasoline futures is rising oil and gas prices. Investors could lose part of or all their initial margin. A trader could set a stop loss while establishing his short position. In the above example, the trader could set stop-loss at $2.10 when entering the short order at $2.0149. If gasoline price continues to rise, the maximum loss would be $3,574 ( = (2.10 – 2.0149) *42000).
Happy Trading.
Disclaimers
*Trade ideas cited above are for illustration only, as an integral part of a case study to demonstrate the fundamental concepts in risk management under the market scenarios being discussed. They shall not be construed as investment recommendations or advice. Nor are they used to promote any specific products, or services.
CME Real-time Market Data help identify trading set-ups and express my market views. If you have futures in your trading portfolio, you can check out on CME Group data plans available that suit your trading needs www.tradingview.com
Gasoline Inventories Fall Despite Weak DemandDeclining Gasoline Stockpiles and Market Adjustments
U.S. gasoline inventories decreased by 1.4 million barrels last week, bringing total stockpiles 1% above the five-year seasonal average. This decline occurred despite relatively weak demand growth, indicating that refiners are actively adjusting supply to prevent excessive buildup.
Over the past four weeks, gasoline consumption has averaged 8.4 million barrels per day (bpd), reflecting a modest 0.9% increase year-over-year. While this suggests a slight recovery in demand, the overall pace of consumption remains subdued compared to historical seasonal trends. Consumers have yet to show a strong rebound in gasoline purchases, possibly due to economic uncertainty, shifts in commuting patterns, or improving vehicle fuel efficiency.
Refinery Output and Pricing Trends
Refinery production of gasoline rose to 9.6 million bpd, signaling refiners' efforts to maintain a stable supply balance. Despite this, retail gasoline prices continued their downward trend, falling to $3.078 per gallon, marking a decline both on a weekly and yearly basis. The drop in prices reflects a combination of steady production levels, lower crude costs, and moderate demand growth.
While gasoline inventories are currently declining, their position above the five-year average suggests that refiners have room to adjust supply if consumption remains weak. The seasonal transition to summer-grade gasoline may introduce additional fluctuations in pricing and availability, making upcoming refinery utilization rates a key factor to monitor.
Market Outlook and Investment Considerations
Refinery stocks such as Marathon Petroleum ( NYSE:MPC ) and Phillips 66 ( NYSE:PSX ) may experience margin adjustments as gasoline demand evolves. Meanwhile, RBOB gasoline futures ( NYMEX:RB1! ) could remain under pressure unless demand picks up or crude prices provide upward momentum.
The decline in gasoline inventories, coupled with weak demand growth and falling prices, suggests a period of relative stability in the market. However, seasonal factors and refinery adjustments could introduce new price movements in the coming weeks.
RBOB Gasoline has broken the Trend-BarrierSince the TB is broken, we go a little sideways. Looks like someone is loading the Boat.
However, if we break the red resistance, chances are very good we start to move to the North.
To me this looks like a fantastic Risk/Reward.
So, if it looks like a valid Trade, and it smells and behave like one, it probably IS one I should take.
Let's stalk this for a break of Resistance.
GASOLINE Huge rebound expected on the 1D MA50.Gasoline (RB1!) is on a corrective sequence in the past 2 weeks as it got rejected on the 1D MA200 (orange trend-line) and is about to test the 1D MA50 (blue trend-line) as Support.
Having a previously overbought 1D RSI (>70.00), this pull-back is similar to January 29 - February 02 2024. The buy signal will be given once the price breaks above the 1D MA200.
Since the previous fractal peaked marginally above the 0.786 Fibonacci retracement level, we will target this time marginally below it at 2.600.
-------------------------------------------------------------------------------
** Please LIKE 👍, FOLLOW ✅, SHARE 🙌 and COMMENT ✍ if you enjoy this idea! Also share your ideas and charts in the comments section below! This is best way to keep it relevant, support us, keep the content here free and allow the idea to reach as many people as possible. **
-------------------------------------------------------------------------------
💸💸💸💸💸💸
👇 👇 👇 👇 👇 👇
Gasoline - Continuing the up-trend as following!Hi guys , we are looking into today RBOB or Gasoline, the price formulated an amazing up-trend since we last posted about it, so we are looking to re-test the upper levels again.
After the price consolidates around the 2.19-2.20 mark we will analyse again and see what would be the next move!
Entry: 2.12
Target: 2.15
Target: 2.19
As always my friends happy trading!
P.S. If you have questions or inquiries about one of my existing set-ups or personal questions / 1 on 1 sessions consider joining my community so you can follow up with me in private!
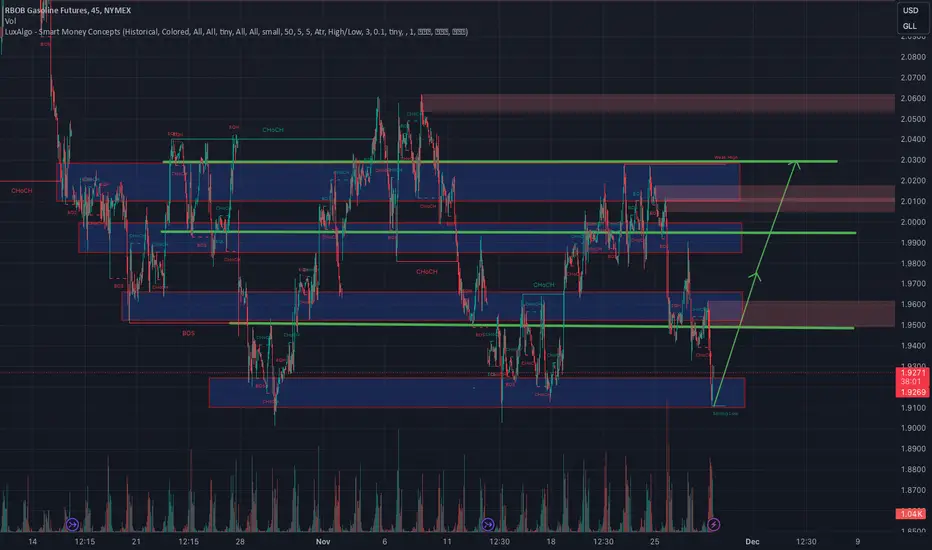
RBOB post tariff structure and range to take advantage of!Hi guys today we are starting off with RBOB , which has been quiet for the past month and it has been trading in a structured range between 2.05 as a high resistance and 1.92 / 1.94 as strong support. As of today we are currently sitting at the given support line of 1.92 and the latest news which came from President Trump that he will impose tariffs on Canadian and Mexican Imports , which would probably impact and touch the Oil Industry. The U.S. imports 4M barrels of Crude Oil every single day from Canada and around 900-1M barrels of Oil Crude Oil from Mexico. These tariffs would definitely touch the consumer as a long term which would give us a boost into the overall demand / supply play around the prices of Petroleum Products.
Current entry RBOB (Gasoline)
1.9300 entry level, with two separate targets.
Target 1: 1.9755
Target 2: 2.0310
The strategy can be repeated after the targets are touched with a patient retracement of the lower support line and input similar targets.