NG1! Will Go Down From Resistance! Sell!
Take a look at our analysis for NG1!.
Time Frame: 9h
Current Trend: Bearish
Sentiment: Overbought (based on 7-period RSI)
Forecast: Bearish
The market is trading around a solid horizontal structure 3.204.
The above observations make me that the market will inevitably achieve 3.049 level.
P.S
We determine oversold/overbought condition with RSI indicator.
When it drops below 30 - the market is considered to be oversold.
When it bounces above 70 - the market is considered to be overbought.
In-depth trading ideas
NG1! | Bearish Correction Outlook -EIA Storage Report Catalyst Natural Gas has experienced a recovery from its August lows, with price now approaching a significant resistance region between 3.25 and 3.30. This area combines the September high with the daily 800 EMA, which has repeatedly acted as resistance throughout the summer. The daily TDI has demonstrated strengthening bullish momentum during the recent advance, although a bearish reversal signal has yet to develop. I am therefore watching for a rejection from this resistance region, accompanied by det
Natural Gas Futures (MCX) | Intraday Structure | October 13, 202Natural Gas Futures (MCX) | Intraday Structure | October 13, 2026
MCX:NATURALGAS1!
Natural Gas is trading around 302.3, hovering right against the 302.11 Short Entry boundary after a sharp pullback from its local rejection spike near 307.0. The contract has slipped back under its central value area, compressing near the lower baseline of its multi-session consolidation range.
Price action enters the session locked inside a tight decision zone. Institutional market participants are balanci
NATURAL GAS Multi-month Resistance hit. Rejection or break-out?Natural Gas (NG1!) hit its long-term Resistance Zone that started after its March 09 High and is so far pulling back. As long as it holds, this should be a technical rejection transitioning into a Bearish Leg towards the Support Zone. In this case, out Target is the top of that Zone at 2.650.
If NG breaks and closes above the Resistance Zone however, it will be a long-term technical bullish break-out so taking the loss is preferable and reversing into a long aimed at the 2.0 Fibonacci extension
Natural Gas Futures (MCX) | Technical Structure | October 14, 20Natural Gas Futures (MCX) | Technical Structure | October 14, 2026
MCX:NATURALGAS1!
Natural Gas is trading around 313.2, holding directly above the 313.00 Zero Line after breaking above an intermediate descending trendline. The contract has completed a strong multi-session recovery off its lower demand base near 297.30, driving straight into overhead supply resistance and testing its primary central inflection pivot.
Price action enters the session locked against the central benchmark. In
NATURAL GAS 1H | Rounded Bottom Breakout SetupNatural Gas has formed a rounded-bottom recovery from the 285–288 zone, followed by higher highs and higher lows. Price has reclaimed both EMAs and is now pressing the 312 resistance.
A clean break with volume can release the next momentum leg toward 320–325.
313.2 - 314.4 - 315.6 - 316.8
If Natural Gas loses 305, the breakout thesis weakens significantly.
Fundamentally, today's bullish backdrop came from production curtailments, recovering LNG feedgas flows and tighter-than-average storage
Naturalgas analysis This is a 4-hour Natural Gas Futures chart, and the structure is quite interesting.
📊 What the chart is showing
* Current price: ~316.2
* Major resistance: 318–320
* Price has rallied strongly from around 270 and is now retesting the previous swing high near 318–320.
* The green rising trendlines show that the medium-term structure is still bullish.
* However, price is now at a very important resistance zone.
🔴 The key area: 318–320
The previous high was around 318–319, and the current pric
NATGAS Free Signal! Sell!
Hello,Traders!
NATGAS is rejecting the horizontal supply area after a buy-side liquidity sweep, while distribution around the mitigation block supports a bearish rotation toward the lower target.
------------------
Stop Loss: 3.383$
Take Profit: 3.153$
Entry: 3.283$
Time Frame: 8H
------------------
Sell!
Comment and subscribe to help us grow!
Check out other forecasts below too!
Silver | Natural Gas | Gold Price Forecast | Oil | Dollar | Silver | Natural Gas | Gold Price Forecast | Oil | Dollar |
0:00 Introduction & Commodities Overview
0:21 Natural Gas (NG / UNG) Technical Analysis NYMEX:NG1!
4:21 Crude Oil (CL / USO) Technical Analysis NYMEX:CL1!
6:05 US Dollar Index (DXY / UUP) Analysis
7:42 Gold (GC / GLD) Technical Analysis COMEX:GC1!
10:01 Silver (SI / SLV) Technical Analysis COMEX:SI1!
A Multi-Year Triangle Is Nearing CompletionNatural Gas may be approaching an important long-term turning point. On the daily chart, price has been developing a large multi-year contracting triangle in wave , with the structure unfolding as (A)-(B)-(C)-(D)-(E).
Waves (A), (B), (C) and (D) appear to be complete. This means that the market may now be developing the final wave (E) of the entire triangle.
The internal structure of wave (E) is also particularly interesting.
I currently see wave (E) unfolding as a W-X-Y double zigzag. Wave
Will Rising LNG Demand Ignite Natural Gas Futures?U.S. natural gas futures remain in focus despite recent choppy trading. Henry Hub slipped to $3.04 today, but the NYMEX chart reveals consistent higher lows since April 2026. Global demand drives this bullish momentum. U.K. and Dutch gas prices climbed this week as hopes for a quick Strait of Hormuz reopening faded. This international price spike increases demand for U.S. LNG. Flows to major U.S. export plants averaged 18 bcfd in September, up from 17.3 bcfd in August. Traders are positioning fo
$4Not investment advice. I publish my own analysis of Martin Armstrong’s Socrates outputs combined with my own execution rules, for educational purposes. Futures trading carries substantial risk of loss and is not suitable for every investor. Levels, dates and scores are my reading of computer-generated models and can be wrong. Do your own work or work with a licensed advisor. I hold or may initiate positions in the instruments discussed.
BTR Pro Indicator I Natural Gas Mini — Daily Chart StudyA clear example of how patience and structured price-action analysis can help a trader stay focused on the larger market move.
On the Natural Gas Mini Futures 1D chart, BTR Pro highlighted:
🔹 BTR Buy Signal — earlier in the chart
🔹 BTR Sell Signal — around July
🔹 BTR Buy Signal — again around late August
The latest BTR Buy setup shows:
SL Reference: 253.5
T1: 309.8
T2: 337.9
T3: 366.1
Current price on the chart: 292.6
The important lesson isn't simply the signal.
It's the process:
Signal
MCX Natural Gas Price Forecast 2026–2027🟢 2020–2022: Five-Wave Impulse
From the 2020 low near 110.5 , Natural Gas developed a clear five-wave advance into the 2022 high near 801 . Wave I advanced from 110.5 to approximately 251.3, followed by Wave II correcting to around 165. Wave III then extended strongly from 165 to approximately 485, followed by Wave IV, which declined to around 265.5. Finally, Wave V advanced from 265.5 to the major 2022 peak near 801, completing the larger 5-wave impulse .
🟢 2022–2026: Developm
TTF, the natural gas contract to watch!What are the best market indicators for determining the real state of maritime traffic and energy transportation through the Strait of Hormuz?
I imagine that most of you thought of the oil price on the stock market, and you are right. The oil price and the technical signals it provides are the best way to assess the actual maritime traffic through the Strait of Hormuz and also the Bab-el-Mandeb Strait.
On the subject of oil, I invite you to look again at the technical map that I have presented
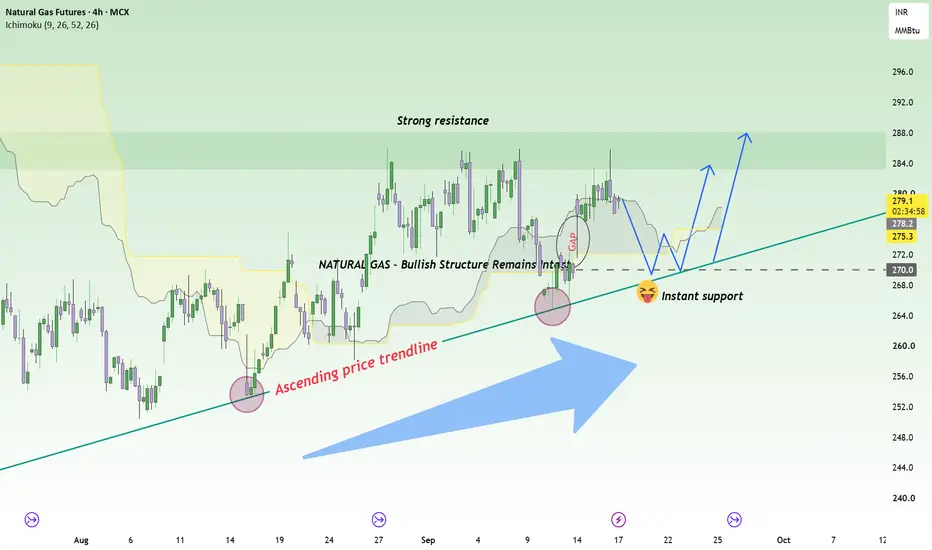
NATURAL GAS – Bullish Momentum Still Has Room to RunNatural Gas is entering an interesting phase as the longer-term fundamental outlook remains supportive while the technical structure continues to favor buyers. Growing demand for U.S. LNG exports is providing a stronger foundation for the market, even as high domestic production and comfortable inventories remain short-term headwinds.
From a fundamental perspective, rising U.S. LNG export demand and tighter conditions across the global LNG market are the main factors supporting the longer-term
Gold Price Forecast | Oil | Dollar | Silver | Natural Gas.Gold Price Forecast | Oil | Dollar | Silver | Natural Gas.
0:00 Market Overview & Macro Context
0:28 Natural Gas Analysis (NG / UNG) NYMEX:NG1!
3:32 Crude Oil Analysis (CL / USO) NYMEX:CL1!
5:10 US Dollar Index Analysis (DXY / UUP)
6:55 Gold Analysis (GC / GLD) COMEX:GC1!
9:05 Silver & Precious Metals Analysis (SI / SLV) COMEX:SI1!
Super El Niño 2026–27: What Commodity Markets to Watch?Trade idea on NYMEX Henry Hub Natural Gas (NG); Also discussed: CBOT Wheat (ZW), Soybean Oil (ZL), Corn (ZC), Soybeans (ZS); COMEX Copper (HG)
A potentially historic El Niño is developing in the tropical Pacific. For commodity traders, however, knowing that El Niño is strengthening is only the beginning. The more important questions are: Which commodity markets are most exposed? Which expected impacts may already be reflected in futures prices? And where could the climate outlook still challeng
Gold Price Forecast | Oil | Dollar | Silver | Natural Gas.
0:00 Introduction & Overview
0:26 Natural Gas Technical Analysis & Trend Dynamics NYMEX:NG1!
1:20 Natural Gas Key Support & Resistance Levels
3:28 Crude Oil Dark Pool Activity & Peak Fear Analysis NYMEX:CL1!
5:21 US Dollar & FOMC Rate Hike Expectations
7:25 Gold Technical Analysis & Inverted Dollar Correlation COMEX:GC1!
9:15 Silver Outlook & Potential Liquidity Grab COMEX:SI1!
10:01 Outro & FOMC Risk Warning
NATURAL GAS: 1M Death Cross eyes 1.900.Natural Gas is marginally bearish on its 1D technical outlook (RSI = 44.132, MACD = 0.726, ADX = 25.369) with 1W neutral (RSI = 46.527) as the long term trend remains bearish. The pattern is similar to the 3 major Tops that formed since the 2009 bear market and on top of that it just formed a Death Cross on the 1M timeframe. The multiyear Support has been 1.900 and in 3 cases the bottom was formed even lower, so that gives us a fair long term Target for 2027 (TP = 1.900).
## If you like our fr