C Citigroup Options Ahead of EarningsIf you haven`t bought C Citigroup before the rally:
Now analyzing the options chain and the chart patterns of C Citigroup prior to the earnings report this week,
I would consider purchasing the 138usd strike price Puts with
an expiration date of 2026-7-17,
for a premium of approximately $2.08.
If
Compare with Citigroup Inc
9.43 USD
14.13 B USD
86.08 B USD
Next report date
—
Report period
—
EPS estimate
—
Revenue estimate
—
Details
Sector
Industry
CEO
Jane Nind Fraser
Website
Headquarters
New York
Founded
1812
IPO date
Oct 30, 1986
ISIN
US1729674242
CUSIP
172967424
FIGI
BBG000FY4S11
Identifiers
ISIN US1729674242
Citigroup Inc. (Citi) is a financial services holding company. The Company's whose businesses provide consumers, corporations, governments and institutions with a range of financial products and services, including consumer banking and credit, corporate and investment banking, securities brokerage, trade and securities services and wealth management. The Company operates through two segments: Citicorp and Citi Holdings. Citicorp is the Company's global bank for consumers and businesses and represents its core franchises. Citicorp is focused on providing products and services to customers and leveraging the Company's global network, including various economies. As of December 31, 2016, Citicorp was present in 97 countries and jurisdictions, and offered services in over 160 countries and jurisdictions. Global Consumer Banking (GCB) provides traditional banking services to retail customers through retail banking, including Citi-branded cards and Citi retail services.
Citigroup | Continued stock growth- Timeframe: Weekly
- Trade type: Buy stop order
- Price: 144.71
- Take Profit: Open
- Stop Loss: 137.15 (-5.20 %)
Idea: Long on a breakout above last week's high - bullish momentum continuation.
Entry: Buy stop above last week’s high.
Stop-loss: Below the low of the same candle.
If the weekly cand
Citigroup $C: The Restructuring Wall | Target $116.19Technical Breakdown: The Breakdown Level
The 2-hour chart shows Citigroup losing its primary horizontal support, signalling a potential trend reversal.
Resistance: The prior support at $125.88 is now likely to act as a "ceiling" for any relief rallies.
Targets: * T1 ($121.84): Immediate horizontal
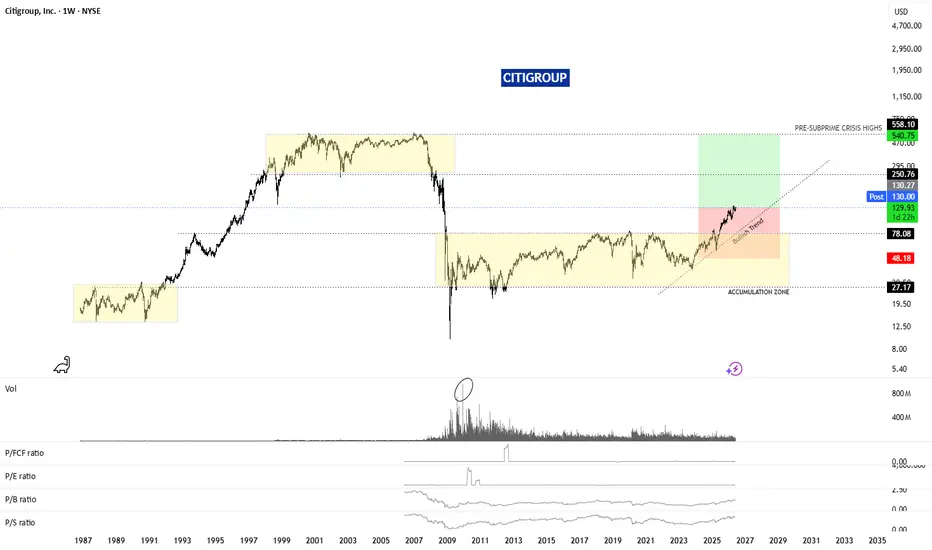
Citi Come BackCitigroup NYSE:C has broken out of the consolidation range it had been trapped in since 2009, following the collapse triggered by the subprime crisis.
It is currently within a bullish continuation trend, connecting the lows of 2023 and 2025. Holding this trendline will be key to recovering pre-su
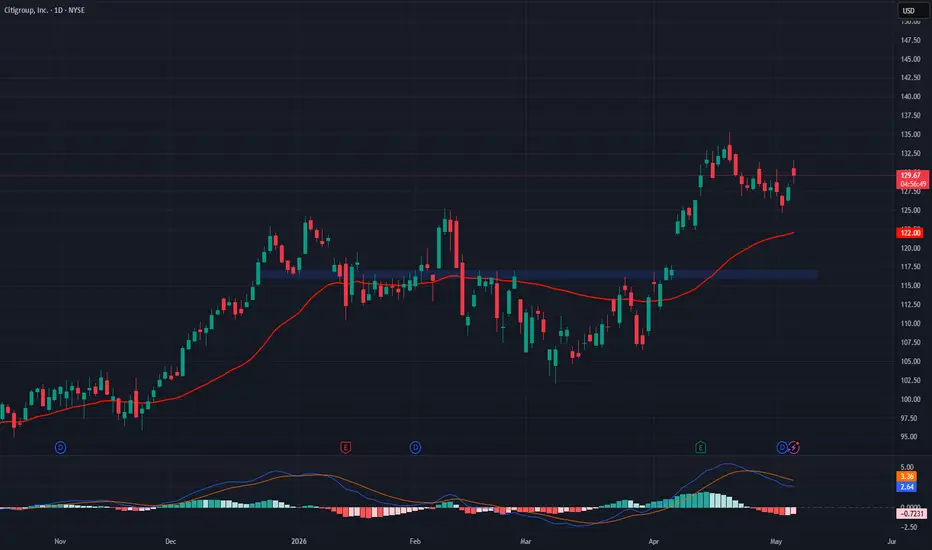
Citigroup Momentum Building Above $125 – Traders Eye Upside MoveCurrent Price: 125.55 (Analysis was generated on Monday Morning)
Direction: LONG
Confidence level: 46%(Professional trader discussions lean bullish due to institutional blockchain adoption and macro trade stability. X sentiment also shows more bullish than bearish posts, though data volume and exp
Citibank Wave Analysis – 12 May 2026
- Citibank reversed from support level 124.15
- Likely to rise to resistance level 131.65
Citibank recently reversed from the support zone between the key support level 124.15(former monthly high from January and February) and the lower daily Bollinger Band.
The upward reversal from the level 124
Citigroup — Transformation Momentum Driving Profitability GrowthCitigroup $C is one of the world’s largest financial institutions, operating across investment banking, markets, wealth management, and consumer banking in more than 160 countries.
Key Catalysts:
Transformation nearing completion:
Under CEO Jane Fraser, Citigroup’s restructuring is now ~90% comple
See all ideas
Summarizing what the indicators are suggesting.
Neutral
SellBuy
Strong sellStrong buy
Strong sellSellNeutralBuyStrong buy
Neutral
SellBuy
Strong sellStrong buy
Strong sellSellNeutralBuyStrong buy
Neutral
SellBuy
Strong sellStrong buy
Strong sellSellNeutralBuyStrong buy
An aggregate view of professional's ratings.
Neutral
SellBuy
Strong sellStrong buy
Strong sellSellNeutralBuyStrong buy
Neutral
SellBuy
Strong sellStrong buy
Strong sellSellNeutralBuyStrong buy
Neutral
SellBuy
Strong sellStrong buy
Strong sellSellNeutralBuyStrong buy
Displays a symbol's price movements over previous years to identify recurring trends.
Maturity dateDec 4, 2026
Coupon17.50% (Fixed)
Maturity dateApr 28, 2031
Coupon15.75% (Fixed)
Maturity dateMar 12, 2038
Coupon0% (Zero)
Maturity dateSep 29, 2026
Coupon1.30% (Fixed)
Maturity dateSep 22, 2027
Coupon11.00% (Fixed)
Maturity dateMar 17, 2056
Coupon6.20% (Fixed)
Maturity dateJun 29, 2028
Coupon8.10% (Fixed)
Maturity dateNov 21, 2032
Coupon7.32% (Fixed)
Maturity dateApr 28, 2045
Coupon6.25% (Fixed)
Maturity dateAug 7, 2056
Coupon0% (Zero)
Maturity dateJun 19, 2030
Coupon2.25% (Fixed)
See all C bonds
Frequently asked questions
The current price of C is 134.55 USD — it has decreased by −2.78% in the past 24 hours. Watch Citigroup, Inc. stock price performance more closely on the chart.
Depending on the exchange, the stock ticker may vary. For instance, on NYSE exchange Citigroup, Inc. stocks are traded under the ticker C.
C stock has risen by 3.76% compared to the previous week, the month change is a −7.11% fall, over the last year Citigroup, Inc. has showed a 44.31% increase.
We've gathered analysts' opinions on Citigroup, Inc. future price: according to them, C price has a max estimate of 176.00 USD and a min estimate of 135.00 USD. Watch C chart and read a more detailed Citigroup, Inc. stock forecast: see what analysts think of Citigroup, Inc. and suggest that you do with its stocks.
C stock is 1.68% volatile and has beta coefficient of 1.15. Track Citigroup, Inc. stock price on the chart and check out the list of the most volatile stocks — is Citigroup, Inc. there?
Today Citigroup, Inc. has the market capitalization of 229.49 B, it has increased by 0.17% over the last week.
Yes, you can track Citigroup, Inc. financials in yearly and quarterly reports right on TradingView.
Citigroup, Inc. is going to release the next earnings report on Oct 13, 2026. Keep track of upcoming events with our Earnings Calendar.
C earnings for the last quarter are 3.15 USD per share, whereas the estimation was 2.74 USD resulting in a 15.01% surprise. The estimated earnings for the next quarter are 2.68 USD per share. See more details about Citigroup, Inc. earnings.
Citigroup, Inc. revenue for the last quarter amounts to 24.77 B USD, despite the estimated figure of 23.74 B USD. In the next quarter, revenue is expected to reach 23.75 B USD.
C net income for the last quarter is 5.78 B USD, while the quarter before that showed 5.73 B USD of net income which accounts for 0.00% change. Track more Citigroup, Inc. financial stats to get the full picture.
Yes, C dividends are paid quarterly. The last dividend per share was 0.67 USD. As of today, Dividend Yield (TTM)% is 1.79%. Tracking Citigroup, Inc. dividends might help you take more informed decisions.
Citigroup, Inc. dividend yield was 1.99% in 2025, and payout ratio reached 33.18%. The year before the numbers were 3.10% and 36.68% correspondingly. See high-dividend stocks and find more opportunities for your portfolio.
As of Aug 7, 2026, the company has 226 K employees. See our rating of the largest employees — is Citigroup, Inc. on this list?
Like other stocks, C shares are traded on stock exchanges, e.g. Nasdaq, Nyse, Euronext, and the easiest way to buy them is through an online stock broker. To do this, you need to open an account and follow a broker's procedures, then start trading. You can trade Citigroup, Inc. stock right from TradingView charts — choose your broker and connect to your account.
Investing in stocks requires a comprehensive research: you should carefully study all the available data, e.g. company's financials, related news, and its technical analysis. So Citigroup, Inc. technincal analysis shows the buy rating today, and its 1 week rating is buy. Since market conditions are prone to changes, it's worth looking a bit further into the future — according to the 1 month rating Citigroup, Inc. stock shows the buy signal. See more of Citigroup, Inc. technicals for a more comprehensive analysis.