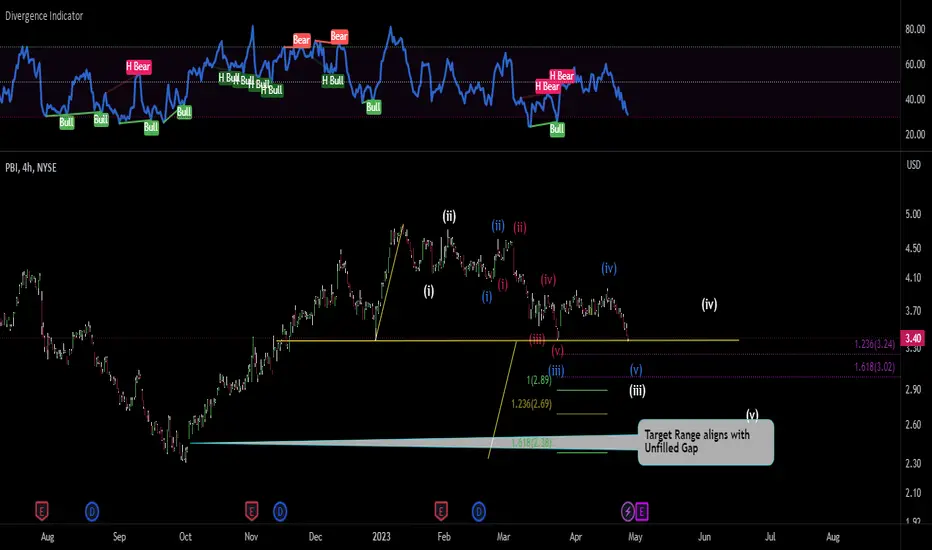
My third eye is activated #PBI is a BUYPBI has been on my watchlist throughout 2025. I already did a great trade on it earlier this year, held for around two months back in April. Now we’ve got some crazy opportunities, and here’s why. I always start with a top down analysis and while I’m hedging for a potential crash, I generally stay m
Compare with Pitney Bowes Inc.
1.24 USD
144.70 M USD
1.89 B USD
134.75 M
Next report date
—
Report period
—
EPS estimate
—
Revenue estimate
—
Company info
Sector
Industry
CEO
Kurtis J. Wolf
Website
Headquarters
Shelton
Founded
1920
IPO date
Sep 18, 1950
ISIN
US7244791007
CUSIP
724479100
FIGI
BBG000BQTMJ9
Identifiers
ISIN US7244791007
Pitney Bowes, Inc. is a global shipping and mailing company, which engages in the provision of technology, logistics, and financial services. It operates through the SendTech Solutions and Presort Services segments. The SendTech Solutions segment includes the revenue and related expenses from physical and digital mailing and shipping technology solutions, financing, services, supplies, and other applications to help simplify and save on the sending, tracking, and receiving of letters, parcels, and flats. The Presort Services segment focuses on the revenue and related expenses from sortation services to qualify large volumes of First-Class Mail, First Class Flats, Marketing Mail, and Marketing Mail Flats and Bound Printed Matter for postal work-sharing discounts. The company was founded by Arthur H. Pitney and Walter Bowes on April 23, 1920 and is headquartered in Shelton, CT.
Buying 69 DTENot the first time I've taken trades in PBI; great momentum.
This time we play the 69 DTE.
I will buy the 17-dollar strike and the 20-dollar strike. Both have implied vol under 50.
Ask for the 17 is 2,25 and for the 20 is 0,75.
This is also a stock in play due to good earnings, undervalued if you l
Long Trade Setup Breakdown for Pitney Bowes Inc. (PBI) - 30-Min 📊
🔹 Asset: Pitney Bowes Inc. (PBI)
🔹 Timeframe: 30-Min Chart
🔹 Setup Type: Symmetrical Triangle Breakout
🚀 Trade Plan (Long Position):
✅ Entry Zone: $10.51 (Breakout Confirmation)
✅ Stop-Loss (SL): $10.02 (Below Support)
🎯 Take Profit Targets (Long Trade):
📌 TP1: $11.26 (First Resistance)
📌 TP2: $
PBI ready for a huge breakout to 12 and 16+This chart reflects a pivotal moment for PBI . A breakout above the $8.79 resistance and the downward trendline would be a strong bullish signal , with the potential to rally toward $9.92 and 12.11 and $16.06 in the mid-term. However, failure to break this level could result in consolidati
$PBI - This could move up short and long termRetraced it's prices from a land before time era. Big buys, big volume, indicators going off, lots of room to run, not over extended yet, USPS tail spinning, FDX and the others set to clean up. If the orange man takes office, kiss USPS all the way good bye.
Not trade advice.
PBI PITNEY BOWES Trading opportunityPBI had great runup off the lows. nearly 14x from the covid lows.
Its been in bearish direction since 1999. Highly unlikely it will return to new ATH, not anytime soon, but market may decide differently.
At the moment, can see a bearish sequence in play, makes for excellent counter trend trading in
Long | PBI | Watch List for break-out | Test StrategyNYSE:PBI
Possible Scenario: LONG
Evidence: Price Action, Break out possibility
This is based my new approach for finding break-outs candidates, I'm testing this strategy, so be cautious, this is different to my ordinary approach. GL
This is my idea and could be wrong 100%
🟢 $PBI Target 11.97 for 27.07% 🟢 $PBI Target 11.97 for 27.07%
Or double position at 6.71
I like this one… I have an open order to add around 9.42 if it comes back down…
—
On the far right of the chart is my Average (Grey) Current Target (Green), and Next Level to add (Red) Percentage to target is from my average.
I start
See all ideas
Summarizing what the indicators are suggesting.
Neutral
Neutral
Neutral
An aggregate view of professional's ratings.
Neutral
Neutral
Neutral
Displays a symbol's price movements over previous years to identify recurring trends.
Maturity dateJan 15, 2037
Coupon5.25% (Fixed)
Maturity dateMar 15, 2029
Coupon7.25% (Fixed)
Maturity dateMar 15, 2029
Coupon7.25% (Fixed)
Maturity dateAug 15, 2030
Coupon1.50% (Fixed)
See all PBI bonds
Frequently asked questions
The current price of PBI is 16.58 USD — it has increased by 0.24% in the past 24 hours. Watch Pitney Bowes Inc. stock price performance more closely on the chart.
Depending on the exchange, the stock ticker may vary. For instance, on NYSE exchange Pitney Bowes Inc. stocks are traded under the ticker PBI.
PBI stock has fallen by −3.88% compared to the previous week, the month change is a 2.09% rise, over the last year Pitney Bowes Inc. has showed a 42.32% increase.
We've gathered analysts' opinions on Pitney Bowes Inc. future price: according to them, PBI price has a max estimate of 22.00 USD and a min estimate of 17.30 USD. Watch PBI chart and read a more detailed Pitney Bowes Inc. stock forecast: see what analysts think of Pitney Bowes Inc. and suggest that you do with its stocks.
PBI stock is 2.04% volatile and has beta coefficient of 0.60. Track Pitney Bowes Inc. stock price on the chart and check out the list of the most volatile stocks — is Pitney Bowes Inc. there?
Today Pitney Bowes Inc. has the market capitalization of 2.27 B, it has decreased by −2.77% over the last week.
Yes, you can track Pitney Bowes Inc. financials in yearly and quarterly reports right on TradingView.
Pitney Bowes Inc. is going to release the next earnings report on Nov 4, 2026. Keep track of upcoming events with our Earnings Calendar.
PBI earnings for the last quarter are 0.43 USD per share, whereas the estimation was 0.34 USD resulting in a 28.36% surprise. The estimated earnings for the next quarter are 0.35 USD per share. See more details about Pitney Bowes Inc. earnings.
Pitney Bowes Inc. revenue for the last quarter amounts to 451.50 M USD, despite the estimated figure of 453.94 M USD. In the next quarter, revenue is expected to reach 452.68 M USD.
PBI net income for the last quarter is 49.91 M USD, while the quarter before that showed 58.14 M USD of net income which accounts for 0.00% change. Track more Pitney Bowes Inc. financial stats to get the full picture.
Yes, PBI dividends are paid quarterly. The last dividend per share was 0.10 USD. As of today, Dividend Yield (TTM)% is 2.30%. Tracking Pitney Bowes Inc. dividends might help you take more informed decisions.
Pitney Bowes Inc. dividend yield was 2.84% in 2025, and payout ratio reached 35.88%. The year before the numbers were 2.76% and 356.51% correspondingly. See high-dividend stocks and find more opportunities for your portfolio.
As of Sep 23, 2026, the company has 6.6 K employees. See our rating of the largest employees — is Pitney Bowes Inc. on this list?
EBITDA measures a company's operating performance, its growth signifies an improvement in the efficiency of a company. Pitney Bowes Inc. EBITDA is 551.77 M USD, and current EBITDA margin is 26.34%. See more stats in Pitney Bowes Inc. financial statements.
Like other stocks, PBI shares are traded on stock exchanges, e.g. Nasdaq, Nyse, Euronext, and the easiest way to buy them is through an online stock broker. To do this, you need to open an account and follow a broker's procedures, then start trading. You can trade Pitney Bowes Inc. stock right from TradingView charts — choose your broker and connect to your account.
Investing in stocks requires a comprehensive research: you should carefully study all the available data, e.g. company's financials, related news, and its technical analysis. So Pitney Bowes Inc. technincal analysis shows the sell today, and its 1 week rating is neutral. Since market conditions are prone to changes, it's worth looking a bit further into the future — according to the 1 month rating Pitney Bowes Inc. stock shows the buy signal. See more of Pitney Bowes Inc. technicals for a more comprehensive analysis.