#NZDCAD: 300+ Pips Intraday Selling Opportunity! ▲ The NZDCAD is currently in a bullish pattern on a daily timeframe and has provided a great area to swing from our analysis point. However, on a smaller timeframe, the next confirmed trend remains unclear. Intense bullish volume is evident on the daily chart but the smaller timeframe is still unc
NEW ZEALAND DOLLAR VS CANADIAN DOLLAR
No trades
No trades
Compare with NZD to CAD
NZDCAD H1 | Could We See A Reversal From Here?The price is rising to our sell entry level at 0.82124, which is a pullback resistance that aligns with the 61.8% Fibonacci retracement.
Our stop loss is set at 0.82264, which is a pullback resistance that aligns with the 50% Fibonacci retracement.
Our take profit is set at 0.81913, which is a pul
NZDCAD - Major Resistance Back in FocusNZDCAD is approaching a high-confluence resistance area, where multiple technical factors are coming together. 📊
Price is currently retesting the intersection of:
• The upper bound of the rising red triangle.
• The previous major highs, which have repeatedly acted as resistance.
📌 As long as this
NZD/CAD Bearish Structure Targets 0.8060 Demand ZoneNZD/CAD remains under strong bearish pressure after failing to hold above the previous Change of Character (CHoCH) zone and rejecting from a key supply area. The recent impulsive decline has broken below the highlighted Order Block, confirming that sellers are in control and increasing the probabili
NZDCAD H4 | Strong Resistance AheadBased on the H4 chart analysis, we could see the price rise to our sell entry level at 0.81754, an overlap resistance that aligns with the 38.2% Fibonacci retracement.
Our stop loss is set at 0.822142, a pullback resistance that aligns with the 61.8% Fibonacci retracement.
Our take profit is set a
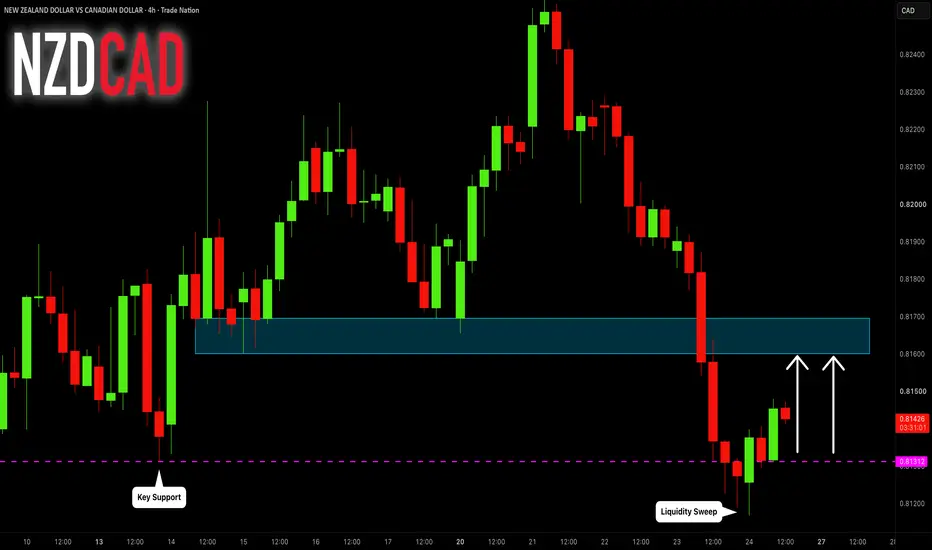
NZDCAD: Confirmed Liquidity Sweep 🇳🇿🇨🇦
NZDCAD will likely bounce from a key support level.
I see a valid liquidity sweep on a 4H time frame.
The price will likely bounce 0.8159 level.
❤️Please, support my work with like, thank you!❤️
I am part of Trade Nation's Influencer program and receive a monthly fee for using their Trading
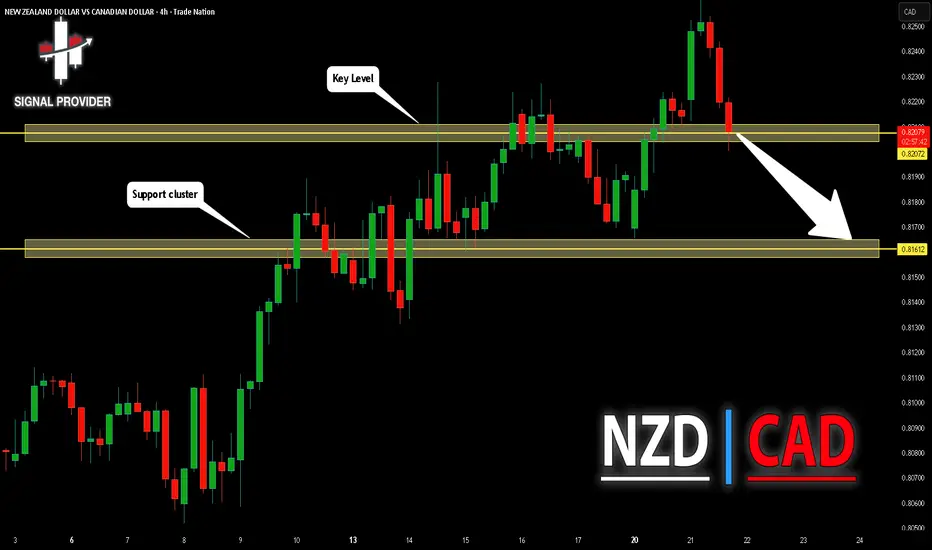
NZDCAD Will Move Lower! Short!
Here is our detailed technical review for NZDCAD.
Time Frame: 4h
Current Trend: Bearish
Sentiment: Overbought (based on 7-period RSI)
Forecast: Bearish
The market is approaching a key horizontal level 0.820.
Considering the today's price action, probabilities will be high to see a movement to 0
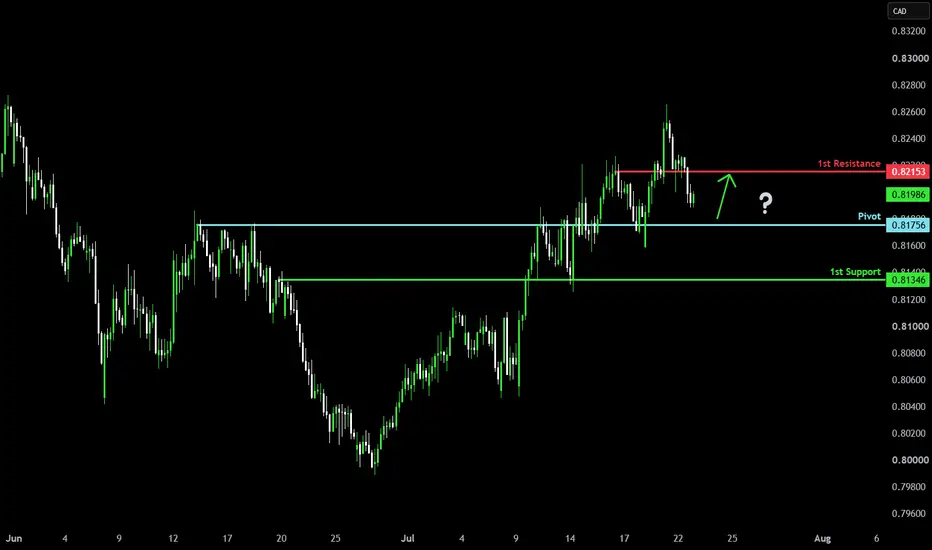
Falling toward strong support?NZD/CAD is falling towards the pivot, which is an overlap support and could bounce toward the 1st resistance, which is also an overlap resistance.
Pivot: 0.81756
1st Support: 0.81346
1st Resistance: 0.82153
Disclaimer:
The opinions given above constitute general market commentary and do not cons
NZDCAD - Wedge Breakdown & Oil Support CAD (17.07.2026)NZD/CAD has confirmed a bearish breakdown from a rising wedge after failing to sustain momentum near the upper trendline. Price is now trading below the broken support trendline, with the recent retest rejecting from the breakout area, indicating sellers remain in control. As long as price stays be
NZDCAD FREE SIGNAL|SHORT|
✅NZDCAD expecting a retracement into the ICT supply zone to mitigate bearish order flow before sellers regain control and extend the decline toward the downside objective. Time Frame: 4H.
—————————
Entry: 0.8168
Stop Loss: 0.8190
Take Profit: 0.8139
Time Frame: 4H
—————————
SHORT🔥
✅Like and sub
See all ideas
Summarizing what the indicators are suggesting.
Oscillators
Neutral
SellBuy
Strong sellStrong buy
Strong sellSellNeutralBuyStrong buy
Oscillators
Neutral
SellBuy
Strong sellStrong buy
Strong sellSellNeutralBuyStrong buy
Summary
Neutral
SellBuy
Strong sellStrong buy
Strong sellSellNeutralBuyStrong buy
Summary
Neutral
SellBuy
Strong sellStrong buy
Strong sellSellNeutralBuyStrong buy
Summary
Neutral
SellBuy
Strong sellStrong buy
Strong sellSellNeutralBuyStrong buy
Moving Averages
Neutral
SellBuy
Strong sellStrong buy
Strong sellSellNeutralBuyStrong buy
Moving Averages
Neutral
SellBuy
Strong sellStrong buy
Strong sellSellNeutralBuyStrong buy
Displays a symbol's price movements over previous years to identify recurring trends.
Frequently asked questions
The current rate of NZDCAD is 0.81603 CAD — it has increased by 0.24% in the past 24 hours. See more of NZDCAD rate dynamics on the detailed chart.
The value of the NZDCAD pair is quoted as 1 NZD per x CAD. For example, if the pair is trading at 1.50, it means it takes 1.5 CAD to buy 1 NZD.
The term volatility describes the risk related to the changes in an asset's value. NZDCAD has the volatility rating of 0.41%. Track all currencies' changes with our live Forex Heatmap and prepare for markets volatility.
The NZDCAD showed a 0.09% rise over the past week, the month change is a 2.03% rise, and over the last year it has decreased by −0.83%. Track live rate changes on the NZDCAD chart.
Learn how you can make money on rate changes in numerous trading ideas created by our community.
NZDCAD is a minor currency pair, i.e. a popular pair that is not associated with USD. Such pairs are also called cross currency pairs.
Currencies are usually traded through forex brokers — choose the one that suits your needs and go ahead. You can trade NZDCAD right from TradingView charts — just log in to you broker account. Check out the list of our integrated brokers and find the best one for your needs and strategy.
When deciding to buy or sell currency one should keep in mind many factors including current geopolitical situation, interest rates, and other. But before plunging into a deep research, you can start with NZDCAD technical analysis. The technical rating for the pair is buy today, but don't forget that markets can be very unstable, so don't stop here. According to our 1 week rating the NZDCAD shows the buy signal, and 1 month rating is neutral. See more of NZDCAD technicals for a more comprehensive analysis.