Bullish rebound?NZD/CHF is falling toward the support level, which is a pullback support, and could bounce from this level to our take profit.
Entry: 0.45958
Why we like it:
There is a pullback support level.
Stop loss: 0.45607
Why we like it:
There is a pullback support level.
Take profit: 0.46401
Why we like i
NZD/CHF
No trades
No trades
Compare with NZD to CHF
NZDCHF Bearish ContinuationNZDCHF has been showing strong bearish momentum, with price making a sharp impulsive move lower.
After such an aggressive move, we're seeing a much quieter market, with neither side making significant progress. Price became more choppy, with smaller candles and some back-and-forth movement as the ma
Pullback resistance ahead?NZD/CHF is rising toward the pivot, which is a pullback resistance that aligns with the 50% Fibonacci retracement and could reverse from this level to the 1st support level, which is a pullback support.
Pivot: 0.46818
1st Support: 0.46335
1st Resistance: 0.47270
Disclaimer:
The opinions given ab
NZDCHF:Bullish Breakout and Retest SetupNZDCHF has broken above a key resistance zone on the 30-minute timeframe. This zone is now expected to act as support, providing a potential opportunity for a bullish continuation if price successfully holds above it.
**Entry:** 0.47122
**Stop Loss:** 0.46878
**Take Profit:** 0.47369
If the form
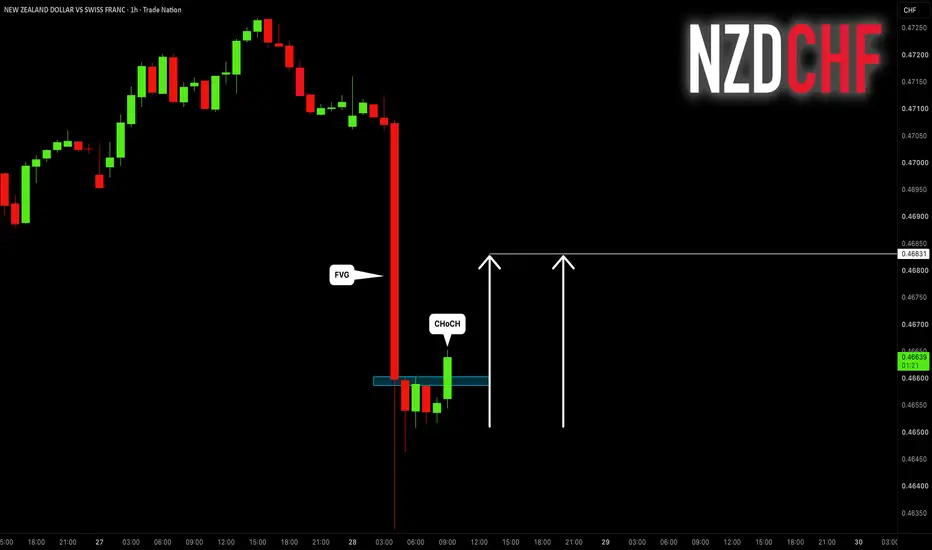
NZDCHF: FVG Trade 🇳🇿🇨🇭
NZDCHF formed a huge Fair Value Gap after NZD Interest Rate Decision very early this morning.
I think that the market will at least partially fill it.
A valid bullish CHoCH on an hourly time frame provides a strong confirmation.
Goal - 0.4683
❤️Please, support my work with like, thank you!❤️
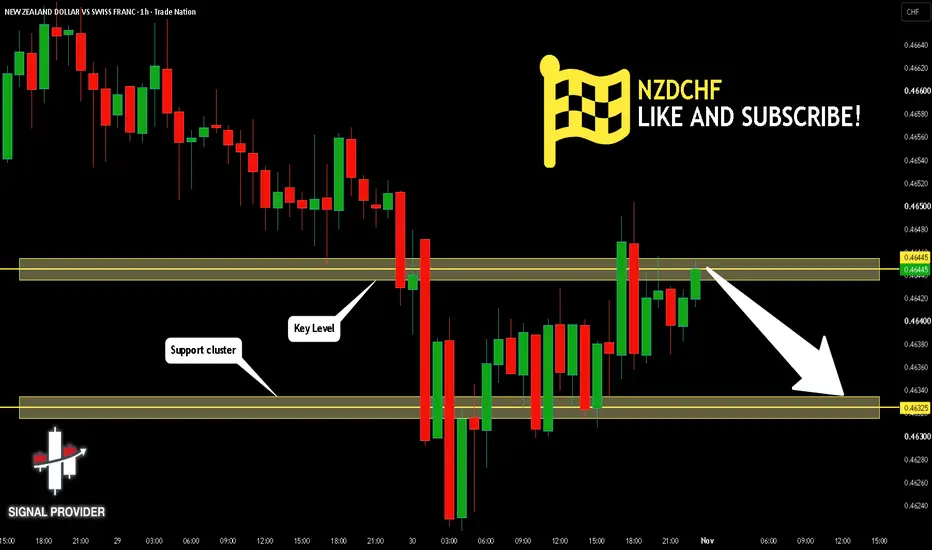
NZDCHF Will Fall! Short!
Please, check our technical outlook for NZDCHF.
Time Frame: 1h
Current Trend: Bearish
Sentiment: Overbought (based on 7-period RSI)
Forecast: Bearish
The market is trading around a solid horizontal structure 0.464.
The above observations make me that the market will inevitably achieve 0.463 lev
Bullish rise?NZD/CHF could fall toward the pivot, which is a pullback support and could bounce toward the 1st resistance, which is a pullback resistance that aligns with the 161.8% Fibonacci extension.
Pivot: 0.47053
1st Support: 0.46753
1st Resistance: 0.47418
Disclaimer:
The opinions given above constitute
NZDCHF FREE SIGNAL|SHORT|
✅NZDCHF is awaiting a tap of a premium supply zone as NZDCHF loses upward momentum. A bearish shift in order flow could drive displacement toward sell-side liquidity at the lower target.
—————————
Entry: 0.4707
Stop Loss: 0.4724
Take Profit: 0.4685
Time Frame: 2H
—————————
SHORT🔥
✅Like and subs
NZD-CHF Supply Level Ahead! Sell!
Hello,Traders!
NZDCHF is approaching the horizontal supply area as bullish momentum fades, NZDCHF could face selling pressure. A rejection from this zone may trigger a pullback toward the next target. Time Frame 2H.
Sell!
Comment and subscribe to help us grow!
Check out other forecasts below to
NZDCHF Will Go Lower! Short!
Take a look at our analysis for NZDCHF.
Time Frame: 4h
Current Trend: Bearish
Sentiment: Overbought (based on 7-period RSI)
Forecast: Bearish
The market is approaching a significant resistance area 0.469.
Due to the fact that we see a positive bearish reaction from the underlined area, I strong
See all ideas
Summarizing what the indicators are suggesting.
Oscillators
Neutral
Oscillators
Neutral
Summary
Neutral
Summary
Neutral
Summary
Neutral
Moving Averages
Neutral
Moving Averages
Neutral
Displays a symbol's price movements over previous years to identify recurring trends.
Frequently asked questions
Today, NZD/CHF rate is 0.45789 CHF.
For broader market analysis, dive into the technicals on the NZDCHF live chart.
The safest way to trade NZDCHF is through a reliable broker. Create an account, fund it, and place a buy order.
You can trade NZDCHF directly from TradingView:
– Choose a broker: Explore our supported trading partners and pick one that fits your needs
– Compare options: View available brokers side by side to evaluate fees and features
– Connect your account: Open Supercharts, click "Trade", select your broker, and log in
– Start trading: Place orders without leaving the chart
Tip: If you're new to trading, try paper trading first — it lets you practice strategies in real market conditions without risking funds.
You can trade NZDCHF directly from TradingView:
– Choose a broker: Explore our supported trading partners and pick one that fits your needs
– Compare options: View available brokers side by side to evaluate fees and features
– Connect your account: Open Supercharts, click "Trade", select your broker, and log in
– Start trading: Place orders without leaving the chart
Tip: If you're new to trading, try paper trading first — it lets you practice strategies in real market conditions without risking funds.
It's worth checking NZDCHF rate change for various periods to get the full picture:
– 1 day — +0.12%
– 1 week — −2.01%
– 1 month — −1.16%
NZDCHF's all-time low was 0.44742 CHF (Nov 13, 2025), and its highest price is 0.97864 CHF (Jul 25, 2007). Track the dynamics with the latest forex news right on TradingView.
– 1 day — +0.12%
– 1 week — −2.01%
– 1 month — −1.16%
NZDCHF's all-time low was 0.44742 CHF (Nov 13, 2025), and its highest price is 0.97864 CHF (Jul 25, 2007). Track the dynamics with the latest forex news right on TradingView.
When trading NZDCHF, one should keep in mind many factors.
First, analyze the fundamentals:
– Macroeconomic data: Inflation, GDP, employment, and other key indicators in the economies behind both currencies
– Central bank policy: Interest rate decisions and monetary policy from the respective central banks
– Market sentiment: Check what other traders anticipate
– News flow: Geopolitical events and economic releases
Then check technical ratings:
– Today — sell
– 1-week — strong sell
– 1-month — sell
Identify the trend, watch key levels (support and resistance), consider volatility and upcoming economic events. Then, you'll be closer to an informed decision.
First, analyze the fundamentals:
– Macroeconomic data: Inflation, GDP, employment, and other key indicators in the economies behind both currencies
– Central bank policy: Interest rate decisions and monetary policy from the respective central banks
– Market sentiment: Check what other traders anticipate
– News flow: Geopolitical events and economic releases
Then check technical ratings:
– Today — sell
– 1-week — strong sell
– 1-month — sell
Identify the trend, watch key levels (support and resistance), consider volatility and upcoming economic events. Then, you'll be closer to an informed decision.
NZDCHF is a minor currency pair (also known as a cross pair), meaning it includes two major currencies but doesn't involve the US dollar.
What it means for traders:
– No USD exposure: Reflects the relative strength of two non-USD economies
– Lower liquidity than major pairs: Generally traded less than major currency pairs, but still widely available
– Potentially wider spreads: Trading costs may be higher than for major pairs
What to keep in mind about cross pairs:
– Region-focused moves: Often influenced by economic data and monetary policy in the two regions involved
– Direct currency comparison: Useful for comparing currencies without the influence of the US dollar
– Different volatility profile: May behave differently from major pairs, especially during regional events
Track rate movements on the NZDCHF chart and follow the latest forex news to stay informed.
What it means for traders:
– No USD exposure: Reflects the relative strength of two non-USD economies
– Lower liquidity than major pairs: Generally traded less than major currency pairs, but still widely available
– Potentially wider spreads: Trading costs may be higher than for major pairs
What to keep in mind about cross pairs:
– Region-focused moves: Often influenced by economic data and monetary policy in the two regions involved
– Direct currency comparison: Useful for comparing currencies without the influence of the US dollar
– Different volatility profile: May behave differently from major pairs, especially during regional events
Track rate movements on the NZDCHF chart and follow the latest forex news to stay informed.
NZDCHF volatility measures how much the exchange rate fluctuates over time, i.e. how quickly and how strongly it moves up or down.
The current volatility rating is 0.87%.
What it means for traders:
– Higher volatility: Larger and faster price swings → higher risk and opportunity
– Lower volatility: More stable price movement → smaller trading ranges
– Market behavior: Volatility often increases during major economic news or central bank decisions
Volatility helps traders estimate risk and position sizing. It's also useful for adapting strategies to market conditions.
How to use volatility:
– Compare volatility across other currency pairs
– Combine with technical analysis (trends, support/resistance)
– Monitor economic events that may increase market movement
The current volatility rating is 0.87%.
What it means for traders:
– Higher volatility: Larger and faster price swings → higher risk and opportunity
– Lower volatility: More stable price movement → smaller trading ranges
– Market behavior: Volatility often increases during major economic news or central bank decisions
Volatility helps traders estimate risk and position sizing. It's also useful for adapting strategies to market conditions.
How to use volatility:
– Compare volatility across other currency pairs
– Combine with technical analysis (trends, support/resistance)
– Monitor economic events that may increase market movement
NZDCHF is quoted as how many CHF (quote currency) it takes to buy one NZD (base currency).
For example, if the pair trades at 1.50, it means 1 NZD = 1.50 CHF.
What can influence the rate:
– Supply and demand: Driven by trade, investment flows, and speculation
– Economic data: Inflation, GDP, employment reports
– Central bank policy: Interest rates and monetary decisions
Follow these and more events in the Economic Calendar.
For example, if the pair trades at 1.50, it means 1 NZD = 1.50 CHF.
What can influence the rate:
– Supply and demand: Driven by trade, investment flows, and speculation
– Economic data: Inflation, GDP, employment reports
– Central bank policy: Interest rates and monetary decisions
Follow these and more events in the Economic Calendar.