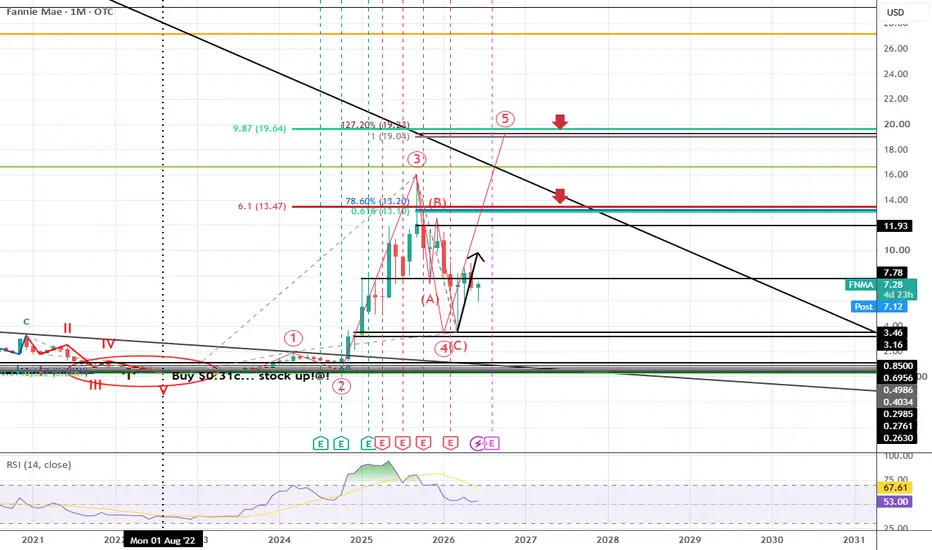
FNMA Monthly Wave 4 appears to be completeFNMA wave 4 appears to be complete, 285%.. which is solid, could buy now, sell half at $15 and let it ride with original cash out of it (that's what I do)...
My original investment in FNMA was returned years ago and if it reaches $20 then there should be a 6 figure profit with no original cash in i
Fannie Mae
No trades
No trades
Compare with Fannie Mae
0.04 USD
14.36 B USD
160.56 B USD
1.16 B
Next report date
—
Report period
—
EPS estimate
—
Revenue estimate
—
Company info
Sector
Industry
CEO
Peter Akwaboah
Website
Headquarters
Washington
Founded
1938
IPO date
Mar 17, 1980
ISIN
US3135867527
CUSIP
313586752
FIGI
BBG000005HY8
Identifiers
ISIN US3135867527
Federal National Mortgage Association is a government-sponsored company, which engages in the provision of liquidity for purchases of homes and financing of multifamily rental housing and refinancing existing mortgages. It operates through the Single-Family and Multifamily segments. The Single-Family segment offers liquidity to the mortgage market and increases the availability and affordability of housing for single families. The Multifamily segment includes guaranty fees on mortgages and on multifamily mortgage loans. The company was founded in 1938 and is headquartered in Washington, DC.
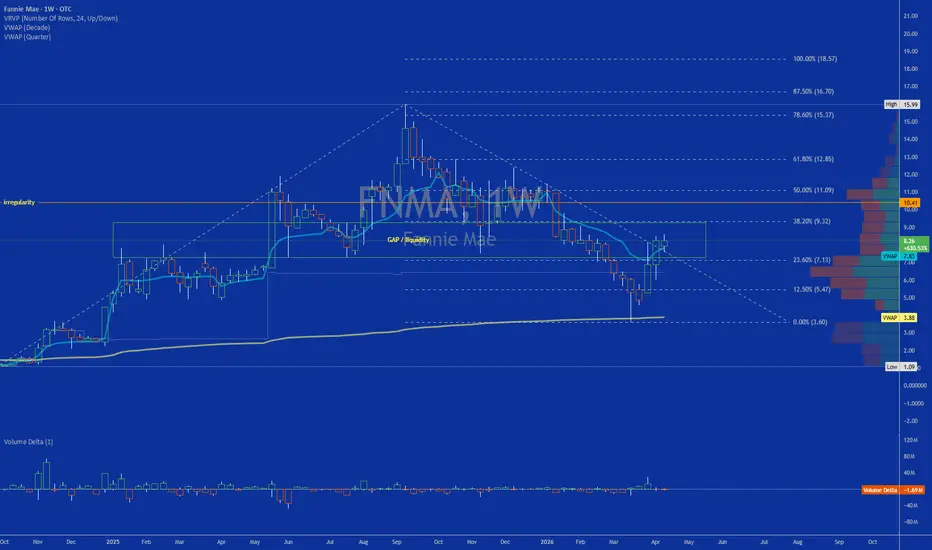
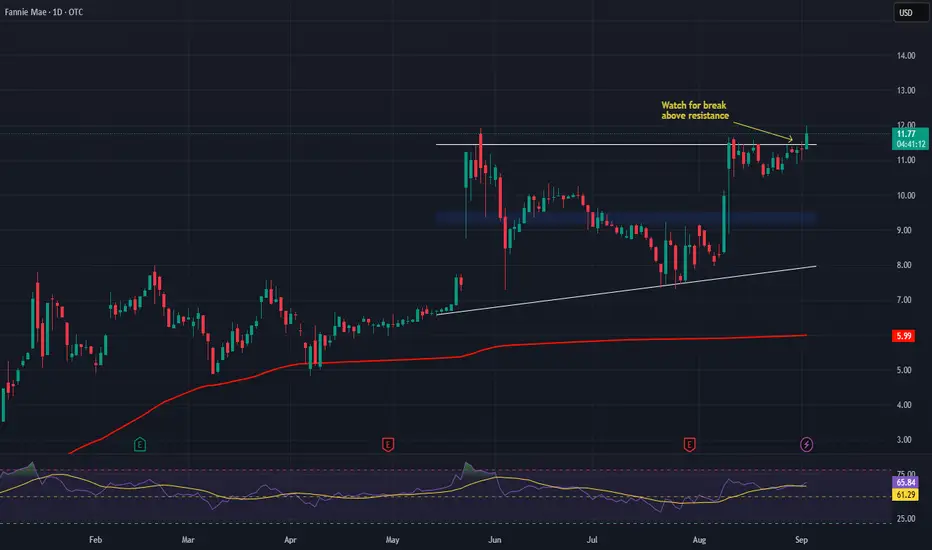
Continuation Setup: Confirmed Breakout Heading to $11OTC:FNMA
### Authors Notes ###
My method of TA relies on Fibonacci retracement and pivot zones, price action, smart money concepts, and wedge pattern. I also use other ancillary tools and indicators as well such as oscillators and MA's.
> Setup Analysis:
- this is a confirmed breakout get
Fannie Mae and Freddie Mac Shares Surge Over 30% Fannie Mae and Freddie Mac Shares Surge Over 30% Following Bill Ackman’s Bullish Endorsement
Shares of government-sponsored mortgage giants Fannie Mae and Freddie Mac experienced dramatic gains on Monday, each soaring more than 30% after billionaire investor Bill Ackman publicly described both stock
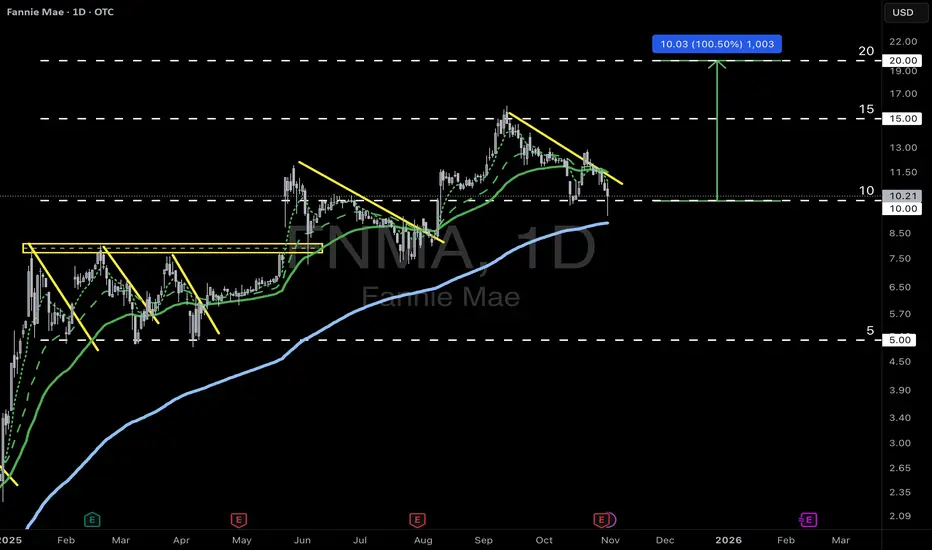
FNMA Daily bouncing off demand levelFNMA bouncing off significant demand level as noted on earlier post
This is an update to an earlier post, where a possible reversal was noted but that pattern failed, however the significant demand level noted then held and is reacting strongly in the last week
Path of least resistance is higher..
FNMA Fannie Mae Daily SupportFNMA Daily Chart
Currently at a technical support area with a daily pin bar,
and weekly pin bar right now but there is still 3 days to go and this could easily change
I actually expect this to get to $17 or so before hitting any long term resistance/ trend lines pre GFC
There is a completed ellio
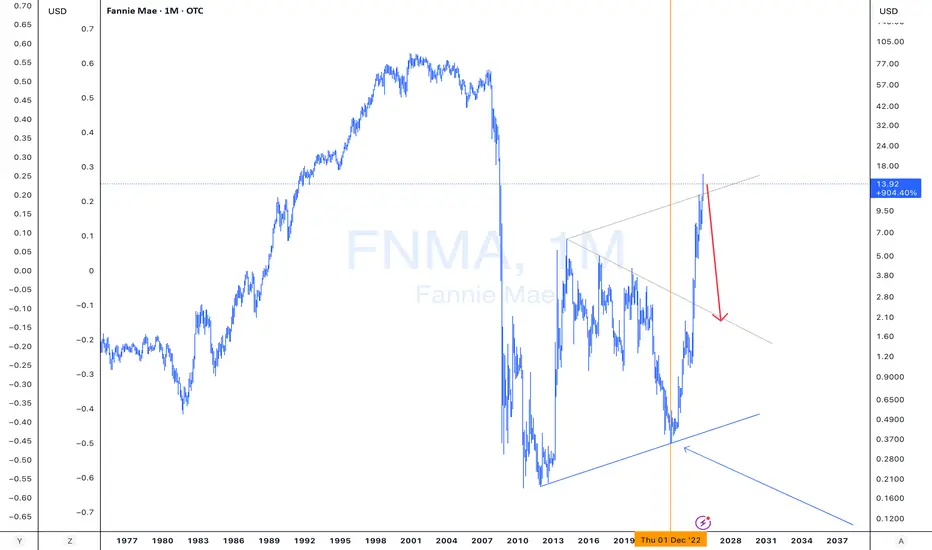
UGLY! FNMA Collapse! We Are in a Recession!The recession began in earnest in late 2022.
Subsequently, in March 2023, Silicone Valley Bank was wiped out; the feds took over and now here we are on the other side of the expansionary cycle. As it currently stands, banks are still sitting on hundreds of billions in unrealized losses.
This can
Fannie Mae (FNMA) AnalysisCompany Overview:
Fannie Mae OTC:FNMA , the government-sponsored enterprise (GSE), plays a critical role in supporting the U.S. housing market through mortgage liquidity and stability.
Key Catalysts:
Q2 2025 support: Provided $102B in liquidity, helping 381,000 households—with over 50% being fir
See all ideas
Summarizing what the indicators are suggesting.
Neutral
Neutral
Neutral
An aggregate view of professional's ratings.
Neutral
Neutral
Neutral
Displays a symbol's price movements over previous years to identify recurring trends.
Maturity dateApr 23, 2029
Coupon4.13% (Fixed)
Maturity dateJun 9, 2031
Coupon4.50% (Fixed)
Maturity dateSep 27, 2027
Coupon6.09% (Fixed)
Maturity dateMay 21, 2029
Coupon4.60% (Fixed)
Maturity dateDec 17, 2030
Coupon3.63% (Fixed)
Maturity dateMar 3, 2031
Coupon4.25% (Fixed)
Maturity dateSep 16, 2031
Coupon5.43% (Fixed)
Maturity dateFeb 13, 2030
Coupon4.00% (Fixed)
Maturity dateAug 27, 2035
Coupon1.50% (Fixed)
Maturity dateJan 21, 2033
Coupon4.20% (Fixed)
Maturity dateMar 18, 2031
Coupon4.25% (Fixed)
See all FNMAS bonds
Frequently asked questions
The current price of FNMAS is 8.25 USD — it has decreased by −1.65% in the past 24 hours. Watch Fannie Mae stock price performance more closely on the chart.
Depending on the exchange, the stock ticker may vary. For instance, on OTC exchange Fannie Mae stocks are traded under the ticker FNMAS.
FNMAS stock has fallen by −13.61% compared to the previous week, the month change is a −17.38% fall, over the last year Fannie Mae has showed a −50.18% decrease.
We've gathered analysts' opinions on Fannie Mae future price: according to them, FNMAS price has a max estimate of 18.00 USD and a min estimate of 6.25 USD. Watch FNMAS chart and read a more detailed Fannie Mae stock forecast: see what analysts think of Fannie Mae and suggest that you do with its stocks.
FNMAS reached its all-time high on Jan 25, 2008 with the price of 32.00 USD, and its all-time low was 0.25 USD and was reached on Aug 6, 2010. View more price dynamics on FNMAS chart.
See other stocks reaching their highest and lowest prices.
FNMAS stock is 6.05% volatile and has beta coefficient of 1.37. Track Fannie Mae stock price on the chart and check out the list of the most volatile stocks — is Fannie Mae there?
Today Fannie Mae has the market capitalization of 5.79 B, it has decreased by −6.67% over the last week.
Yes, you can track Fannie Mae financials in yearly and quarterly reports right on TradingView.
Fannie Mae is going to release the next earnings report on Nov 4, 2026. Keep track of upcoming events with our Earnings Calendar.
FNMAS earnings for the last quarter are 0.68 USD per share, whereas the estimation was 0.63 USD resulting in a 7.68% surprise. The estimated earnings for the next quarter are 0.66 USD per share. See more details about Fannie Mae earnings.
Fannie Mae revenue for the last quarter amounts to 7.57 B USD, despite the estimated figure of 7.25 B USD. In the next quarter, revenue is expected to reach 7.30 B USD.
FNMAS net income for the last quarter is 3.98 B USD, while the quarter before that showed 3.72 B USD of net income which accounts for 0.00% change. Track more Fannie Mae financial stats to get the full picture.
No, FNMAS doesn't pay any dividends to its shareholders. But don't worry, we've prepared a list of high-dividend stocks for you.
As of Sep 23, 2026, the company has 7 K employees. See our rating of the largest employees — is Fannie Mae on this list?
EBITDA measures a company's operating performance, its growth signifies an improvement in the efficiency of a company. Fannie Mae EBITDA is 152.37 B USD, and current EBITDA margin is 93.17%. See more stats in Fannie Mae financial statements.
Like other stocks, FNMAS shares are traded on stock exchanges, e.g. Nasdaq, Nyse, Euronext, and the easiest way to buy them is through an online stock broker. To do this, you need to open an account and follow a broker's procedures, then start trading. You can trade Fannie Mae stock right from TradingView charts — choose your broker and connect to your account.
Investing in stocks requires a comprehensive research: you should carefully study all the available data, e.g. company's financials, related news, and its technical analysis. So Fannie Mae technincal analysis shows the sell today, and its 1 week rating is sell. Since market conditions are prone to changes, it's worth looking a bit further into the future — according to the 1 month rating Fannie Mae stock shows the sell signal. See more of Fannie Mae technicals for a more comprehensive analysis.