 Long
Long
Sony Group Corporation
No trades
No trades
Compare with Sony Group Corporation
Key facts today
−0.22 USD
−2.06 B USD
78.60 B USD
5.77 B
Last report date
Jul 31, 2026
Report period
Q1 2026
EPS
0.36 USD
Revenue
17.45 B USD
Earnings call summary
Q1 saw record sales and profits, with strong performance in gaming, music, and sensors. Tariff impact was reduced to JPY 70 billion, and full-year profit forecasts were raised. Financial Services prepares for a spin-off and listing, while strategic partnerships and production shifts support future growth.
Details
Sector
Industry
CEO
Hiroki Totoki
Website
Headquarters
Tokyo
Founded
1946
IPO date
Dec 1, 1958
ISIN
JP3435000009
FIGI
BBG000KBTZH5
Identifiers
ISIN JP3435000009
Sony Group Corp. engages in the development, design, manufacture, and sale of electronic equipment, instruments, devices, game consoles, and software for consumers, professionals and industrial markets. It operates through the following segments: Game and Network Services, Music, Pictures, Entertainment Technology & Services, Imaging and Sensing Solutions, Financial Services, and Others. The Game and Network Services segment deals with gaming machines, software and network services. The Music segment produces and publishes music and provides image media platforms. The Pictures segment handles film production, television program creation, and media networks. The Home Entertainment and Sound segment offers LCD televisions, home audio, Blu-ray Disc players and recorders, and memory-based portable audio devices. The Imaging and Sensing Solutions segment includes the image sensors business. The Financial Services segment manages the life insurance and non-life insurance operations and banking business. The Others segment consists of various operating activities, including the disc manufacturing and recording media businesses. The company was founded by Akio Morita and Masaru Ibuka on May 7, 1946 and is headquartered in Tokyo, Japan.
Long
Fractal on $TLT/$SONY ComparisonInteresting fractal comparing the similarities of these two price action movements.
Long
Sony has had a good run , now its time. I know with all the drama surrounding the physical-to-digital transition over the next few years, and everybody talking about GTA going fully digital with no physical copies, people are probably going to assume that if Sony's stock starts dropping, it's because of everything that's happening right n
Short
The Asian Technology Sector Is Still UndervaluedWhile U.S. technology stocks have dominated financial markets for several years, can opportunities still be found elsewhere in the world? Valuation data indeed shows that many Asian technology companies remain significantly cheaper than their American counterparts, despite strong market positions an
 Education
$SONY Inverse HS/ Double BottomA simple bullish breakout setting up on SONY. Double bottom and inverse head and shoulders are some of the strongest bullish reversal indicators.
Long
Crazy looking Chart Ik! $Sony Getting Creative :)An obviously messy chart Mapping out of different breakout and flag patterns -
a good way to tell a move is happening soon, by no means is this a common way of going about this. It still does tell something - a big move up or down is coming soon, and I'm projecting up.
PS Don't smoke before charting
Long
Sony Wave Analysis – 29 May 2026- Sony reversed from resistance level 23.00
- Likely to fall to support level 21.00
Sony recently reversed down from the resistance area between the pivotal resistance level 23.00 (which has been reversing the price from February), 50% Fibonacci correction of the downward impulse from January and t
Short
Sony Wave Analysis – 6 March 2026- Sony reversed from support zone
- Likely to rise to resistance level 23.00
Sony recently reversed from the support zone between the pivotal support level 20.40 (which has been reversing the price from the end of 2024) and the support level 21.25 (low of the previous wave A).
The upward reversal
Long
Sony Wave Analysis – 22 January 2026- Sony broke long-term support level 24.00
- Likely to fall to support level 22.00
Sony reopened today with the sharp downward gap – after the price broke below the strong long-term support level 24.00 (former monthly low from June and July of 2025).
The breakout of the support level 24.00 acceler
Short
Sony Primed for Explosive Gains| Are You On Board?📈 SONY Long-Term Outlook: A Powerful Multi-Decade Bullish Setup
Sony’s price history tells the story of a giant evolving through different market cycles, reflecting both fundamental strength and classic price behavior expected in large-cap growth leaders.
🌊 Wave Theory Confluence — Clear Impu
Long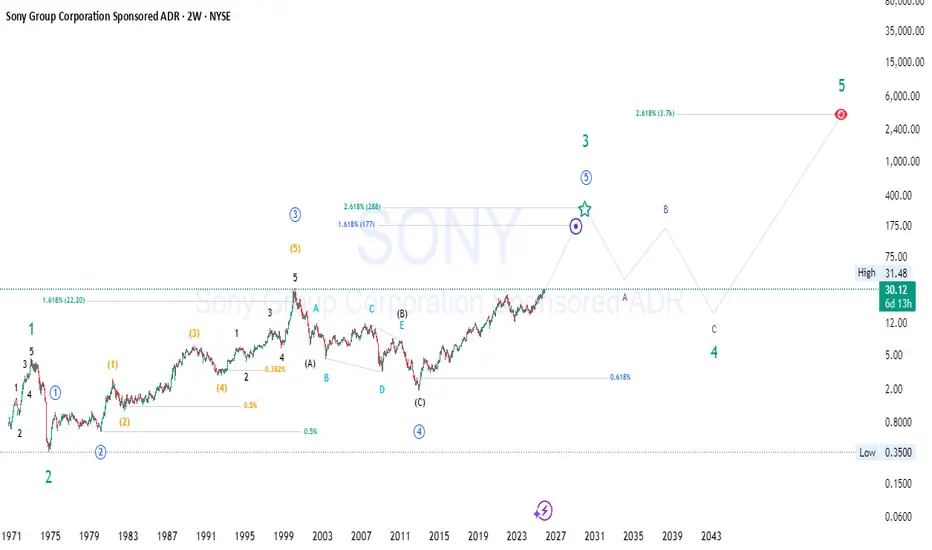
See all ideas
Summarizing what the indicators are suggesting.
Neutral
SellBuy
Strong sellStrong buy
Strong sellSellNeutralBuyStrong buy
Neutral
SellBuy
Strong sellStrong buy
Strong sellSellNeutralBuyStrong buy
Neutral
SellBuy
Strong sellStrong buy
Strong sellSellNeutralBuyStrong buy
An aggregate view of professional's ratings.
Neutral
SellBuy
Strong sellStrong buy
Strong sellSellNeutralBuyStrong buy
Neutral
SellBuy
Strong sellStrong buy
Strong sellSellNeutralBuyStrong buy
Neutral
SellBuy
Strong sellStrong buy
Strong sellSellNeutralBuyStrong buy
Displays a symbol's price movements over previous years to identify recurring trends.
Maturity dateJun 30, 2036
Coupon5.09% (Fixed)
Maturity dateJun 30, 2031
Coupon4.66% (Fixed)
See all SNEJF bonds


Frequently asked questions
The current price of SNEJF is 25.29 USD — it has increased by 1.15% in the past 24 hours. Watch Sony Group Corporation stock price performance more closely on the chart.
Depending on the exchange, the stock ticker may vary. For instance, on OTC exchange Sony Group Corporation stocks are traded under the ticker SNEJF.
SNEJF stock has fallen by −9.10% compared to the previous week, the month change is a 11.93% rise, over the last year Sony Group Corporation has showed a −7.65% decrease.
We've gathered analysts' opinions on Sony Group Corporation future price: according to them, SNEJF price has a max estimate of 37.47 USD and a min estimate of 22.23 USD. Watch SNEJF chart and read a more detailed Sony Group Corporation stock forecast: see what analysts think of Sony Group Corporation and suggest that you do with its stocks.
SNEJF reached its all-time high on Sep 18, 2025 with the price of 32.40 USD, and its all-time low was 1.92 USD and was reached on Nov 28, 2012. View more price dynamics on SNEJF chart.
See other stocks reaching their highest and lowest prices.
See other stocks reaching their highest and lowest prices.
SNEJF stock is 12.18% volatile and has beta coefficient of 0.77. Track Sony Group Corporation stock price on the chart and check out the list of the most volatile stocks — is Sony Group Corporation there?
Today Sony Group Corporation has the market capitalization of 137.16 B, it has increased by 5.86% over the last week.
Yes, you can track Sony Group Corporation financials in yearly and quarterly reports right on TradingView.
Sony Group Corporation is going to release the next earnings report on Nov 10, 2026. Keep track of upcoming events with our Earnings Calendar.
SNEJF earnings for the last quarter are 0.36 USD per share, whereas the estimation was 0.27 USD resulting in a 29.89% surprise. The estimated earnings for the next quarter are 0.39 USD per share. See more details about Sony Group Corporation earnings.
Sony Group Corporation revenue for the last quarter amounts to 17.45 B USD, despite the estimated figure of 16.80 B USD. In the next quarter, revenue is expected to reach 19.90 B USD.
SNEJF net income for the last quarter is 2.10 B USD, while the quarter before that showed 521.92 M USD of net income which accounts for 0.00% change. Track more Sony Group Corporation financial stats to get the full picture.
As of Aug 11, 2026, the company has 94.9 K employees. See our rating of the largest employees — is Sony Group Corporation on this list?
EBITDA measures a company's operating performance, its growth signifies an improvement in the efficiency of a company. Sony Group Corporation EBITDA is 17.49 B USD, and current EBITDA margin is 21.85%. See more stats in Sony Group Corporation financial statements.
Like other stocks, SNEJF shares are traded on stock exchanges, e.g. Nasdaq, Nyse, Euronext, and the easiest way to buy them is through an online stock broker. To do this, you need to open an account and follow a broker's procedures, then start trading. You can trade Sony Group Corporation stock right from TradingView charts — choose your broker and connect to your account.
Investing in stocks requires a comprehensive research: you should carefully study all the available data, e.g. company's financials, related news, and its technical analysis. So Sony Group Corporation technincal analysis shows the strong buy rating today, and its 1 week rating is strong buy. Since market conditions are prone to changes, it's worth looking a bit further into the future — according to the 1 month rating Sony Group Corporation stock shows the strong buy signal. See more of Sony Group Corporation technicals for a more comprehensive analysis.