Oil AnalysisHello friends
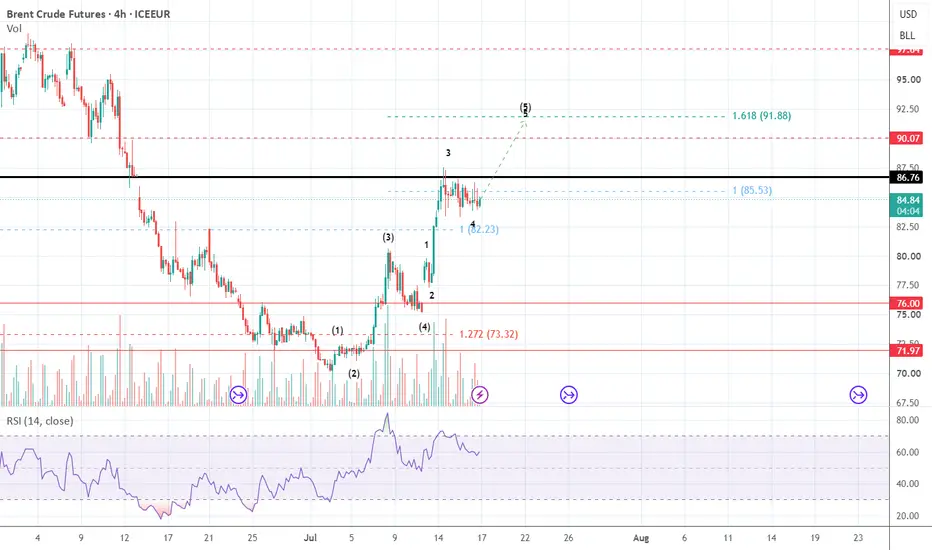
In the oil price chart, we are witnessing the formation of an Elliott wave pattern, which consists of waves 1 to 4 of the main wave and 1 to 4 of wave 5. Now, considering the Fibonacci projection and price resistance and the conflict between Iran and the United States in the Strait of
Brent Crude Oil Futures
No trades
No trades
Compare with Brent Crude Oil Futures
Oil back in focus as tensions flareIn late June we said oil was looking for a base . The 200 day moving average has provided a strong support level and renewed tensions now back in play, it seems like oil is about to make a new move higher.
There's strong support in the high US$70 per barrel range. It doesn't seem like geopolitica
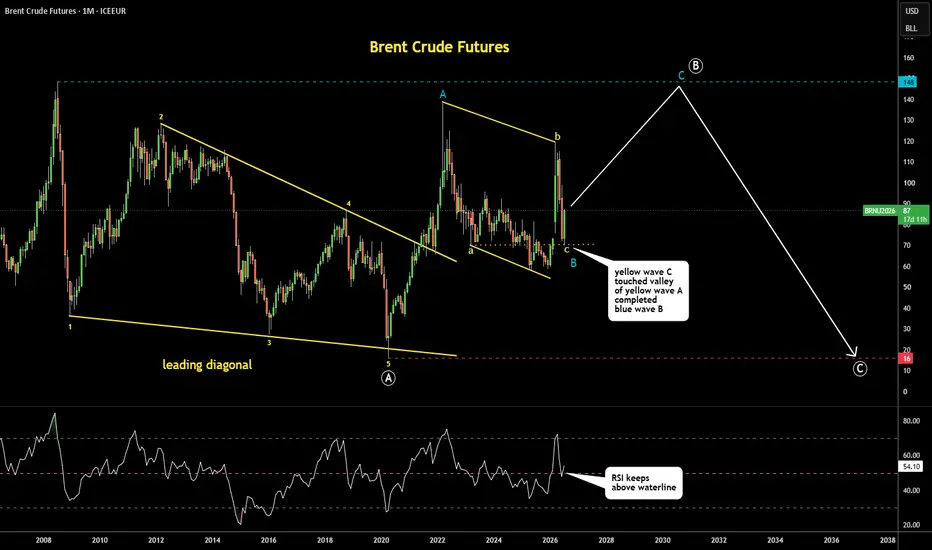
Brent Crude Update 14JUL2026: Upside Target at $148 Blue wave B might be over as irregular flat pattern was completed
when the yellow wave C of lower degree accurately retested the valley of yellow wave A at $70
RSI found support at 50 "waterline" confirming the reversal so far
In this case, the blue wave C might be in progress with the first bulli
Oil analysis update We have an oil update: 🛢️📈
According to the analysis we reposted on June 21, we expected to see increased demand for oil around the $75 mark, as well as increased tensions in the region. 🌍💥
After a month until now, everything has gone exactly according to the analysis, but we expect volatility in
Brent oil extends rebound after holding key supportBrent crude oil prices recently fell back towards the support area around $70 per barrel, filling the gap that had remained open since 2 March. That support zone has held, and the market has since rebounded sharply.
The move has become more forceful since the TradingView chart was captured on 13 Ju
Buy crude oil around 71.50, with a target of 72.90-75.00Crude Oil Market Analysis:
Fundamentals directly drove crude oil to rebound to around 72.70, with a large bullish candle on the daily chart, indicating a market rebound. Currently, it's not entirely clear whether this is a rebound or a reversal. The bullish daily candle is due to fundamental facto
WTI(20260708) Today's AnalysisMarket News:
According to Proactive Research, traders on the market prediction platform Polymarket are generally optimistic that gold will continue its rebound in July, but believe that gold prices will not return to the highs reached in January. Their bets are concentrated around the month's high
Crude Oil – Sell around 73.00, target 70.00-65.00Crude Oil Market Analysis:
Crude oil has been hovering on the daily chart recently. Short-term trading lacks clear momentum, and the overall trend remains bearish. It has approached the previous strong support level. The current trading is a normal technical game; sell on any rebound. Today, watch
WTI(20260707) Today's AnalysisMarket News:
Saudi Arabia has initiated a price war in the Asian market. With the Strait of Hormuz reopening and global oil supply continuing to increase, Saudi Aramco on Monday lowered its official selling price (OSP) for its flagship crude oil sold to Asia in August by the largest margin in at
WTI(20260706) Today's AnalysisMarket News:
The World Gold Council predicts that gold prices will hover around $4,100 this year under its baseline scenario. State Street Bank expects gold prices to rise to $5,000/ounce by early 2027. Royal Bank of Canada believes that a drop in gold prices to $4,000/ounce or below will attract
See all ideas
Summarizing what the indicators are suggesting.
Neutral
SellBuy
Strong sellStrong buy
Strong sellSellNeutralBuyStrong buy
Neutral
SellBuy
Strong sellStrong buy
Strong sellSellNeutralBuyStrong buy
Neutral
SellBuy
Strong sellStrong buy
Strong sellSellNeutralBuyStrong buy
A representation of what an asset is worth today and what the market thinks it will be worth in the future.
Displays a symbol's price movements over previous years to identify recurring trends.
Frequently asked questions
The current price of Brent Crude Oil Futures is 89.85 USD / BLL — it has fallen −4.10% in the past 24 hours. Watch Brent Crude Oil Futures price in more detail on the chart.
The volume of Brent Crude Oil Futures is 1.35 M. Track more important stats on the Brent Crude Oil Futures chart.
The nearest expiration date for Brent Crude Oil Futures is Aug 3, 2026.
Traders prefer to sell futures contracts when they've already made money on the investment, but still have plenty of time left before the expiration date. Thus, many consider it a good option to sell Brent Crude Oil Futures before Aug 3, 2026.
Open interest is the number of contracts held by traders in active positions — they're not closed or expired. For Brent Crude Oil Futures this number is 373.36 K. You can use it to track a prevailing market trend and adjust your own strategy: declining open interest for Brent Crude Oil Futures shows that traders are closing their positions, which means a weakening trend.
Buying or selling futures contracts depends on many factors: season, underlying commodity, your own trading strategy. So mostly it's up to you, but if you look for some certain calculations to take into account, you can study technical analysis for Brent Crude Oil Futures. Today its technical rating is buy, but remember that market conditions change all the time, so it's always crucial to do your own research. See more of Brent Crude Oil Futures technicals for a more comprehensive analysis.